Capability to Promise (CTP)
Handling Strategy in SAP
Master thesis work
30 credits, D-level
Product and Process Development,
Master Thesis Programme Production and Logistics
Patriya Laoniphon & Wenyi Yu
Report code: KPP231
Commissioned by: Ericsson Supply Site Katrineholm
Supervisor: David Lindberg and John Sundahl, Ericsson Katrineholm Mentor: Magnus Wiktorsson, Mälardalen University
Abstract
Nowadays, many companies attempt to adapt their production planning and strategy to make order fulfillment more flexible. In manufacturing, the capacity and capability constraints are key factors which need efficient production planning for controlling service level and minimizing inventory cost. This thesis focuses on looking for the economic and efficient strategies for Capability to Promise or CTP handling. This strategy is proposed to work for Low Volume/High Mixed product manufacturing. Moreover, SAP is used as Enterprise Resource Planning (ERP) system for steering the CTP handling strategies in order to increase automated order handling regarding cost efficiency. The results of this research are both concepts and implementations on how to set CTP handling by using SAP, regarding the demand uncertainty environment in Make to Order (MTO) fulfillment.
Key words: Master / Production planning, Capability to Promise (CTP), Low Volume/High Mixed product manufacturing, SAP and Make to Order
Acknowledgements
Patriya Laoniphon and Wenyi Yu would like to express our gratitude to everyone who has provided assistance and guidance during our working on this thesis. First of all, we would like to especially express our sincere thanks to our thesis advisor, Magnus Wiktorsson, PhD. at Mälardalen University.
We are also very grateful to all the persons we have interviewed and who kindly granted us their time, especially Martin Rudberg, PhD at Linköping University, who gave the important knowledge in this area.
Still, the most important persons for our research are perhaps our company mentors, John
Sundahl, Master planner and David Lindberg, Manager Dimensioning & Capacity management, Ericsson Supply Site Katrineholm. They have made available their support in a number of ways.
Lastly, we are indebted to our many colleagues for providing us with all the information.
It is a pleasure to thank those who made this thesis possible. Patriya Laoniphon & Wenyi Yu
Contents
1. INTRODUCTION ... 1 -1.1BACKGROUND...-1 -1.2PURPOSE...-2 -1.3PROBLEM STATEMENT...-4 -1.4PROJECT LIMITATION...-5 1.4.1 Time limitation ... 51.4.2 Tool and System ... 5
2. COMPANY DESCRIPTION... 6
-2.1ERICSSON GROUP...-6
2.1.1 History ... 6
2.1.2 Vision ... 6
-2.2ORGANIZATION...-7
2.2.1 The Business Unit Network (BNET)... 8
2.2.2 Business Unit Network Supply (BNET Supply) ... 8
2.2.3 Site, Core and Packet Supply unit... 9
-2.3ERICSSON SUPPLY SITE KATRINEHOLM...-9
2.3.1 Capacity Management ... 10
2.3.2 Dimensioning & Planning (D&P) ... 10
-2.4FUNCTIONAL SITE STRUCTURE...-11
3. METHODOLOGY ... 12
-3.1RESEARCH DESIGN...-12
-3.2VALIDITY AND RELIABILITY...-16
4. THEORETICAL BACKGROUND ... 18
-4.1LOGISTICS...-18
-4.2SUPPLY CHAIN MANAGEMENT...-18
4.2.1 Capacity Management ... 20
4.2.2 Safety Stock ... 21
-4.3PRODUCT DESIGN OR PRODUCT CHARACTERISTIC...-21
4.3.1 Low Volume and High Mix (LVHM) Products... 22
-4.3.2 High Volume/Low Mix (HVLM) and Low Volume/High Mix (LVHM) product comparison - 22 -4.4MASTER PRODUCTION PLANNING...-24
4.4.1 Plan... 24
4.4.2 Source ... 25
4.4.3 Make ... 25
-4.5ORDER FULFILLMENT PROCESS...-27
-4.6SOFTWARE SUPPORT FOR SUPPLY CHAIN MANAGEMENT...-28
4.6.1 SAP ERP (Enterprise Resource Planning System)... 28
4.6.2 SAP APO (Advanced Planner and Optimizer) ... 29
5. STUDY OF REFERENCE COMPANIES ... 32
-5.1CASE STUDY 1-VOLVO PENTA...-32
5.1.1 Forecast ... 32
5.1.2 ATP & CTP ... 33
-5.2CASE STUDY 2:VOLVO CONSTRUCTIONS EQUIPMENT...-35
5.2.1 Product and Process ... 35
5.2.2 System ... 35
5.2.3 Planning Structure ... 36
5.2.4 Setting CTP ... 36
-5.3SUGGESTIONS...-38
6. CURRENT SITUATION DESCRIPTION ... 39
-6.1PRODUCT...-39
6.1.1 Low Volume and High Mix Product... 39
6.1.2 Product level ... 40
-6.2DIMENSIONING &PLANNING...-41
6.2.1 Forecast ... 42
6.2.2 Master Planning... 44
-6.3ORDER FULFILLMENT...-47
6.3.1 Physical Make to Order process ... 48
6.3.2 Information flow... 48
-6.4THE SYSTEM IN ESSKH...-51
6.4.1 Control Manufacturing system (C:M)... 51
6.4.2 SAP ONE... 51
-6.5PRODUCTION...-53
6.5.1 Node Production ... 54
6.5.2 Standard Module Production... 55
-6.6PURCHASING...-57
6.6.1 Types of Suppliers ... 57
6.6.2 Evaluation of Suppliers... 58
6.6.3 Material Flexibility ... 59
7. CURRENT SITUATION ANALYSIS... 60
-7.1DEMAND PROBLEM...-60
7.1.1 Demand Uncertainty ... 60
7.1.2 Forecast Inaccuracy ... 61
7.1.3 Order Reallocation ... 62
7.1.4 Order Past Due (Backlog) ... 62
-7.2PRODUCTION PROBLEM...-62
-7.2.1 Node Level ... 62
-7.2.2 Standard Module Level... 63
-7.3SUPPLY PROBLEM...-64
7.3.1 Material Shortage ... 64
7.3.2 Suppliers' Performance... 65
-7.4CTPSETTING UP...-66
7.4.1 CTP (Capability to Promise) Setting Problem... 66
7.4.2 CTP on Node level ... 66
7.4.3 CTP on Standard Module level ... 67
8. SOLUTIONS & IMPLEMENTATIONS ... 69
-8.1SOLUTION...-69
8.1.1 Node Level ... 70
8.1.2 Standard Module Level ... 74
-8.2IMPLEMENTATION...-78
8.2.1 Regular Meetings ... 78
8.2.2 Alert Monitor Setting ... 80
8.2.3 Simulation Example ... 80
9 CONCLUSIONS & RECOMMENDATIONS... 82
-9.1CONCLUSION...-82
-9.2RECOMMENDATIONS...-83
9.2.1 CTP Decisions' History... 83
9.2.2 Master Data Quality ... 83
10 VALIDITY & FUTURE STUDY ... 85
-10.1ON VALIDITY OF THE RESULTS...-85
-10.2FUTURE STUDIES...-85
10.2.1 Pick from Stock (PFS) Flow... 85
10.2.2 Production Flexibility ... 85
10.2.3 CTP leveling on SM level... 86
10.2.4 Measurement of Suppliers' Performance ... 86
10.2.5 Specified Setting CTP on Node level... 86
10 REFERENCE ... 87
(11. APPENDIX)... 94
-APPENDIX 1:INTERVIEW QUESTIONS WITH VOLVO PENTA...-94
-APPENDIX 2:INTERVIEW QUESTIONS WITH VOLVO CONSTRUCTION EQUIPMENT: ...-95
-List of figure:
FIGURE 1: MULTIPLE GOALS OF THE WORKING STRATEGY... ‐ 3 ‐
FIGURE 2: OPTIMAL BALANCE... ‐ 4 ‐
FIGURE 3: THE PART OF ERICSSON’S ORGANIZATIONS WHICH ARE INVOLVED IN THIS STUDY... ‐ 7 ‐
FIGURE 4: THE BUSINESS UNIT NETWORK WITHIN ERICSSON GROUP... ‐ 8 ‐
FIGURE 5: BUSINESS UNIT NETWORK SUPPLY (BNET SUPPLY) BROKEN DOWN TO SITE, CORE AND PACKET SUPPLY...‐ 8 ‐
FIGURE 6: ILLUSTRATING ESS KH IS INCLUDED IN SITE, CORE AND PACKET SUPPLY... ‐ 9 ‐
FIGURE 7: THE ERICSSON SUPPLY SITE KATRINEHOLM BROKEN DOWN TO CAPACITY MANAGEMENT... ‐ 10 ‐
FIGURE 8: THE SECTIONS WITHIN CAPACITY MANAGEMENT AT ESS KH ... ‐ 10 ‐
FIGURE 9: ACTION PLAN OF THIS PROJECT... ‐ 16 ‐
FIGURE 10: THE ROLE OF LOGISTICS (WATERS, 2003)... ‐ 18 ‐
FIGURE 11: A SUPPLY CHAIN FLOW... ‐ 19 ‐
FIGURE 12: THE COMMON SUPPLY CHAIN PROCESSES (DICKERSBACH T.J., 2008)... ‐ 20 ‐
FIGURE 13 SAFETY STOCK AND REORDER POINT (HELP.SAP, 2011C)... ‐ 21 ‐
FIGURE 14: COMPARING HIGH VOLUME/LOW MIX SUPPLY CHAIN AND LOW VOLUME HIGH MIX SUPPLY CHAIN BY WILLIAM, 2001) ...‐ 23 ‐
FIGURE 15: THE MAIN THREE PART IN SCOR WHICH ARE INVOLVED IN THIS PAPER. (ADAPTED FROM BUSINESS‐PROCESS‐IT, 2011) ...‐ 24 ‐
FIGURE 16: COMPARING MAKE TO STOCK (MTS) AND MAKE TO ORDER (MTO) FULFILLMENT, (KEELY, 2003). ...‐ 28 ‐
FIGURE 17: ENTERPRISE RESOURCE PLANNING SYSTEM OR ERP (BOWERSOX, ET AL., 2007)... ‐ 29 ‐
FIGURE 18: RELATIVE OF SUPPLIER’S CAPACITY AND TIME LINE... ‐ 34 ‐
FIGURE 19: SHIFTING BACKLOG INTO AVAILABLE... ‐ 36 ‐
FIGURE 20: ABCD CLASSIFICATION... ‐ 39 ‐
FIGURE 21: ILLUSTRATING THE TWO PRODUCT LEVELS; NODE LEVEL AND STANDARD MODULE LEVEL...‐ 40 ‐
FIGURE 22: THE MRP PROCESS CITED IN ERICSSON INTERNAL PRESENTATIONS, 2010A... ‐ 42 ‐
FIGURE 23: PRODUCT STRUCTURE TREE CHART... ‐ 44 ‐
FIGURE 24: BACKWARD SCHEDULING FLOW... ‐ 45 ‐
FIGURE 25: FORWARD SCHEDULING FLOW... ‐ 46 ‐
FIGURE 26: ILLUSTRATING THE PROCESS FOCUS FOR THIS STUDY... ‐ 47 ‐
FIGURE 27: ILLUSTRATING PHYSICAL MTO FLOW PROCESS... ‐ 48 ‐
FIGURE 28: AGGREGATED INFORMATION MAKE‐TO‐ORDER FLOW IN A “SWIM LANE”... ‐ 49 ‐
FIGURE 29: AN EXAMPLE OF SUPPLIER'S PERFORMANCE ON MONTHLY VARIATION... ‐ 59 ‐
FIGURE 30: ROOT CAUSE ANALYSIS... ‐ 60 ‐
FIGURE 31: DEMAND UNCERTAINTY ON ONE NODE OF AXE... ‐ 61 ‐
FIGURE 32: PICK FROM STOCK (PFS) FLOW (KARLSSON P., 2009B) ... ‐ 68 ‐
FIGURE 33: CTP MATRIX... ‐ 69 ‐
FIGURE 34: PRODUCTION BASELINE FROM 100 PIECES (HELLGREN J., 2011) ... ‐ 72 ‐
FIGURE 35: PRODUCTION BASELINE FROM 300 PIECES (HELLGREN J., 2011) ... ‐ 73 ‐
FIGURE 36: THE CONCEPT OF ALERT MONITOR COMPARES CTP LEVEL AND ACTUAL ORDERS... ‐ 74 ‐
FIGURE 37: SUPPLIER DELIVERY TIME THEREFORE, IN NEAR TIME PLAN, THE PURCHASERS CAN SEE THE SITUATION BETTER AND LOWER LEVEL TO BE CLOSE TO WHAT SUPPLIER CAN DELIVER. ... ‐ 78 ‐
List of tables:
TABLE 1: THE SUMMARY OF INCLUDED RESEARCH TECHNIQUES OF THIS THESIS... ‐ 14 ‐
TABLE 2: FUNDAMENTAL DIFFERENCES BETWEEN HIGH VOLUME/LOW MIX PRODUCTS AND LOW VOLUME/HIGH MIX PRODUCTS SUPPLY CHAIN...‐ 22 ‐
TABLE 3: THE SEVEN MODULES WITHIN APO PACKAGE (KNOLMAYER, 2001) ... ‐ 30 ‐
TABLE 4: THE STATUS OF VOLVO PENTA'S CTP SETTING UP... ‐ 34 ‐
TABLE 5: THE STRUCTURE OF THE DEMAND PLANNING IS BUILT BY MANUAL AND SAP ... ‐ 43 ‐
TABLE 6: CTP LEVEL ON STANDARD MODULE LEVEL PER COMMODITY... ‐ 75 ‐
TABLE 7: THE ROLE OF STAKEHOLDERS IN CTP UPDATED PROCESS ON STANDARD MODULE LEVEL... ‐ 79 ‐
TABLE 8: A SIMULATION EXAMPLE OF SETTING CTP ON STANDARD MODULE LEVEL... ‐ 81 ‐
Glossary Table
AGO Assembly Group Object
APO Advanced Planning and Optimization
ATP Availability-to-Promise
BOM Bill Of Material
CL Customer Logistics
C:M Control Manufacturing System (A Material
handling system used at Ericsson in Katrineholm)
CTP Capability-to-Promise
ERP Enterprise Resource Planning
ESS KH Ericsson Supply Site Katrineholm
ECC ERP Central Component
LVHM Low Volume and High Mix
MTO Make-to-Order
MRF Medium Range Forecast
MRP Material Requirements Planning
MU Market Unit
PFS Pick- from-Stock
PIM Product Introduction Management
SPG Support Processor Group
SAP System, Application and Program
Thesis Structure
Chapter 1 gives a general understanding of the background to the paper, purpose, task definition and research areas.
Chapter 2 consists of a general description of the company, which helps the reader have a good understanding of the organization.
Chapter 3 presents the methodology used during different phases of the thesis.
Chapter 4 contains the theories which are used to support the descriptions, analyses and strategies of the work.
Chapter 5 lists 2 companies' interview as case study, so as to compare with Ericsson Supply Site Katrineholm's system and support the proposed solutions.
Chapter 6 describes the current state of production planning in Ericsson Supply Site Katrineholm, like products, process and the system.
Chapter 7 uses root anlaysis cause to discuss the problems behind the CTP setting. Chapter 8 gives a matrix solution for CTP handling strategy.
Chapter 9 concludes the work, gives recommendation to the company and presents the future study.
1. Introduction
This chapter introduces the background of this study. The purposes of this study are formulated and the problem statements are defined. Besides, the study boundaries are described to show the limitation of this project. Finally, the chapter is ended with summarizing each chapter in a reading instruction.
1.1 Background
The strong competition and globalization market at the present drive many companies to pay attention on customizing their product and offering the best customer service for maximizing their market share. Focusing on a manufacturing industry perspective, the manufacturers yet attempt to satisfy their customer in many ways. One of the ways to achieve customer satisfaction is to concentrate in order commitment or order promising. Manufacturers endeavor to maximize the order commitment precision which is as the significant factor that needs to synchronize the procurement; manufacturing and distribution with the customer demand (Shobrys D., 2002).
Capability-To-Promise or CTP handling is the process of committing orders against available capacity as well as inventory and represents what is the site capability. CTP check is one of the analysis processes which support the order fulfillment process (Shobrys D., 2002) which is used to determine when a new or unscheduled customer order can be delivered. It is the feature available to help manufacturing industry improve the operations and deliver a high level of customer service. CTP check processing evaluates for inbound purchase receipts, supplier lead times, and alternative sourcing options for raw material, production and labor availability. To enhance the customer satisfaction, the stakeholders, such as procurement planning, production planning, and order management, is involved to achieve this point. The procurement planning is required to support the manufacturing by maximizing supplier delivery precision in order to smooth the material flow. In the production planning is required to optimize the capability of production operation and draw up the master scheduling to establish accuracy, responsiveness and order fulfillment. The order management is involved in handling order process verification and fulfillment system. In certain circumstances, the customer demand is not steady and apparently effects the destabilization of supply chain. It is necessary to merge the customer need and all of stakeholder.
Nowadays the CTP handling level can be executed by Supply Chain Management (SCM) systems. These systems are playing the significant roles in manufacturing environment to build the factory site’s impression to customer perspective. One of them is System, Application and Program or SAP which is noted in SCM process as a tool supports SCM processes by visualizing and processing data regarding the particular business requirements (Dickersbach T.J., 2008). Since the SCM processes can essentially affect and change the organization, a strong commitment by the supporter in a sufficiently high position is necessary (Dickersbach T.J., 2008).
In this thesis, Ericsson group is the empirical study to learn how to set CTP handling level in a practical way. The Ericsson group is one of Sweden's largest companies which provide telecommunications equipment and related services to mobile and fixed network operators globally. (Ericsson, 2011b) There are many supply sites around the world such as Sweden, Mexico, Tallinn, China, India and Brazil. Ericsson supply site Katrineholm (ESS KH) is one of the supply sites within Ericsson group. This factory is driven mainly the production of various stations of the mobile telecommunication network and responsible for manufacturing of products with low volumes and high mix (Ericsson internal presentation, 2010g). This means that it is vital to have a flexible and robust scheduling and sequencing in supply chain (Veerakamolmal P., 1998). Ericsson Katrineholm supply site has been developed their production operation and started to implement the concepts of Lean and Agile Manufacturing. Moreover, they are embracing a new system landscape using SAP for improving master and order planning area.
As mentioned above, one of the factors that affects the order commitment process is CTP handling level. To be able to continue align towards the overall strategies for the site at Katrineholm when the new system is going to implement, there is a need in the master planning to increase the knowledge for setting up the suitable CTP handling level by using SAP in accordance with the site strategy for Low volume and High mix (LVHM) products and Make to Order (MTO) fulfillment.
Ericsson's offer to the customers is evaluated based on delivery precision, which is critical to not losing future orders. Product quality has to meet high standards to qualify for customer orders. Ericsson is mainly winning orders on price and delivery lead-time. Internally, Ericsson use production lead-time, delivery precision, and cost of sales as key performances indicators. The ability to deliver larger volumes is expected to be important in the future, indicating an increased importance of volume flexibility. (Selldin, 2005)
The demands placed on Ericsson by its customers give a complicated picture. Low cost is emphasized at the same time as short delivery lead times are important, which does not provide a clear indication if it is an innovative or functional product. (Selldin, 2005) Internally, the production process is measured using several different performance indicators. Components shipped directly to the final assembly are measured using on-time deliveries. Production is measured on quality performance and production on-time per unit. Delivery precision is measured for all products. (Selldin, 2005)
1.2 Purpose
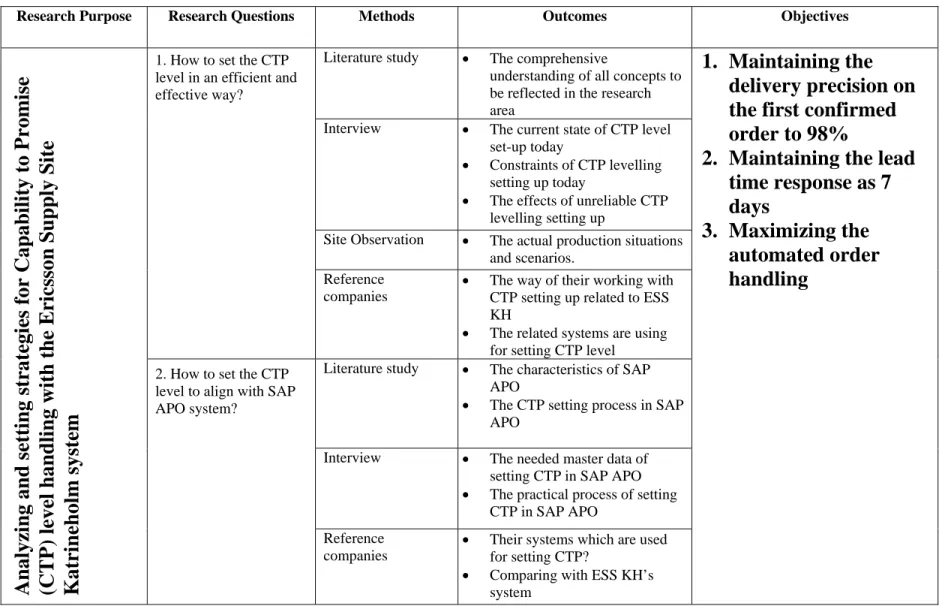
The purpose of this thesis is for ESS KH to keep the response speed, flexibility of capability to provide fast delivery within minimum risk. It is a tradeoff among 3 goals of ESS KH as shown in Figure 1.
Figure 1: Multiple goals of the working strategy
Figure 1 shows that the working strategies should support the following goals: maintaining the delivery precision on the first confirmed order to 98%, maintaining the 7 days lead time response and maximizing the automated order handling. These three goals are to simplify the CTP administration and ordering. The first goal is that Ericsson promises customers the date that the products will be delivered to them, the percentage of reaching this promise. The second goal is to maintain the resulting lead time response to 7 days. It is from the day the customer orders to the day when Ericsson responds with the delivery date. The third goal means decreasing the total amount of manual work; this means less workload in CTP orders, supporting high degree of automated orders. It is difficult to meet all three goals at the same time and a trade-off among the goals has to be found. For example, the first customers confirmation can be reached well if the transportation way is changed, having a large inventory or big capacity, however all of these will cost more in an economical thinking. On the other hand, the lead time response can be reached well if the first customers confirm is well-promised. This increases delivery cost.
Moreover, in order to meet customer demand the management decision should optimize service level with the lowest total cost. Figure 2 illustrates an optimal service level with minimal total cost. It is assumed that the total cost include the costs of lost sales, delays, excess in capability and excess in inventory. These costs increases and decreases exponentially (Ericsson internal document, 2010c).
Cost Service Level Cost for lo st sales & delays Cost for e xcess capabi lity & in ventory Optimal Balance
Figure 2: Optimal Balance
1.3 Problem Statement
The inaccurate CTP causes ESS KH's CTP setting problem. If the CTP is lower than the customer orders, then ESS KH cannot get orders which they can get. If the CTP is higher than the customer orders, than there will be a waste of production capability, as well as extra inventory.
In order to fulfill the customer promise regarding delivery precision and targets of lead times, cost and capital targets, the research focus will be looking for different
possibilities for balancing and fulfilling these preconditions. With the limited capacity, this problem needs to be solved with an order policy built on CTP. The site needs to be sure that there is capacity to fulfill the order, considering the other orders that have already been received and promised. Even if the customer lead time is standard, the site needs to be sure that when the next order is taken, there will be resources to fill it on-time along with the other orders. (Kienleong, 2010) The later chapters will build suitable strategies for Capability to Promise (CTP) to be implemented in SAP, which ESS KH can adapt within the site strategies. With the help of different implementation plans, the strategies will align with the existing system and improve the system. The two research questions are:
1. How to set the CTP level in an efficient and effective way? 2. How to set the CTP level to align with SAP APO system?
To find answers for these problems, different methods will be used to research different areas. Through literature study, below topics will be studied: MRP, SAP APO, CTP, CTP setting, demand uncertainty, production capacity, safety stock and etc. Through ESS KH's site observation, below departments will be studied: production, purchasing, order management and Dimensioning & Planning. Through ESS KH's site interviews, discussed topics include: current state of CTP level set up, constraints of CTP setting, the effects of unreliable CTP setting up, needed master data in SAP APO, practical process of setting CTP and etc. Through reference companies' interviews, different
comparable areas consist of their ways of working with CTP setting up, the related systems used for setting up CTP, the difficulties they have when they start using CTP as a tool and etc.
1.4 Project Limitation
In this section, the limiting factors and available time for this thesis are defined.
1.4.1 Time limitation
The thesis project was conducted between 24th January and 10th June 2011, while the SAP ONE project, that the thesis is closely connected to, is from 17th January to October 2011. Due to this, this thesis project was not able to follow the whole SAP ONE migration project and check the application process. As this project is finished after 20 weeks, the SAP ONE will go live and be further developed after that time. This limits the real application of our conclusions and to some extent the feasibility.
1.4.2 Tool and System
SAP will be used as system for managing the CTP handling strategy in order to align with the strategies and methods with ESS KH.
2. Company Description
This chapter gives a general understanding of the Ericsson Company. It is divided into three parts: Ericsson Group, Organization and Katrineholm site. The section on the Ericsson Group describes the company's history, vision, objective and product as a whole. Next, the organization part is addressed in order to see the structure of Ericsson by narrowing down to Katrineholm site. The final part definitely will be described in terms of its position in Ericsson which environment factory in Katrineholm work and which parties are involved in the thesis. This chapter is primarily intended for those who have no direct related to the degree project or company and who want to get a brief description of the company.
2.1 Ericsson Group
2.1.1 History
Ericsson has been a leader in driving technology forward, switching from telegraph to telephone all the way to the roll out of 4G (Fourth generation mobile phone system). It has helped from the industry's standards, from NMT (Nordic Mobile Telephony) and GSM (Global System for Mobile Communications) to LTE (Long Term Evolution) which is a next generation mobile wireless broadband technology that will enable operators to offer wireless broadband services. It also has one of the richest telecom heritages and was one of the first companies to establish operations overseas (Ericsson internal presentation, 2010g).
Areas that Ericsson covers are: Mobile, 2G ,3G and 4G
Fixed systems, broadband and fixed telephony
Transmission and Transport, for mobile, fixed and other types of networks The service layer, applications and end-user services
Services, consulting, systems integration, managed services, deployment and optimization of networks, training and technical assistance
Cell phones, mobile phones and other mobile communication (through joint venture Sony Ericsson)
The company has about 90,261 employees where of about 18,200 are employed in Sweden. Customers are spread across 140 countries and there is over 1 000 different telecommunications network around the world that uses its technology (Ericsson, 2010c).
2.1.2 Vision
“To be the prime driver in an all-communicating world” is the vision of Ericsson which is the passionate vision to be perceived as Best in Class and the best alternative within the framework for own value proposition. The customers should perceive Ericsson as the best in class suppliers, maintaining the stakeholder confidence to allow it to continue to invest in front-edge technologies and next generation ways of working. It also wants to be perceived as a highly competent partner and competence center playing an important role in the global development in supply. (Ericsson, 2011c)
2.2 Organization
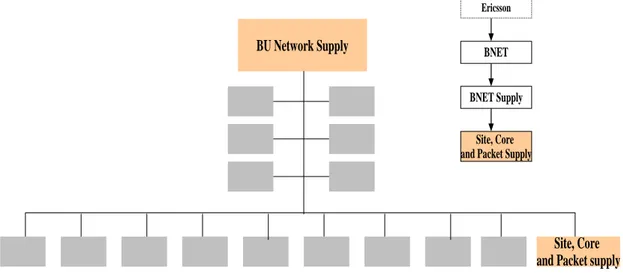
The Ericsson organization is based on two basic functionalities which are creating offerings (Business Unit: BU) and selling offerings (Market Unit: MU). This part will describe overview of responsibility in each unit which is involved in this study from the big view as business unit (BU), Business Unit Network (BNET), Business Unit Network Supply (BNET Supply) to Site Core and Packet Supply respectively as illustrated in Figure 3. After that, Ericsson Supply Site Katrineholm (ESS KH) and Capacity Management department in ESS KH will be described in section 2.3.
Figure 3: The part of Ericsson’s organizations which are involved in this study Business Unit
A Business Unit is a unit responsible for product management, product provisioning, marketing, business management and supply management of a portfolio of packages of total solutions, systems, products and services within its defined scope. Moreover, this unit endeavor to develop and maintain a competitive, high-quality offering and have consolidated financial responsibility and also maximize profitable growth with regard to customer satisfaction and performance. The head of a Business Unit reports to the President & CEO (Ericsson internal document, 2010a).
Market Unit
A Market Unit is responsible for manage customer relationships; maximize sales and profitable business through an efficient local operation with financial responsibility through account management, in support of key account managers. The Head of a Market Unit reports to a member of the Group Management Team.
2.2.1 The Business Unit Network (BNET)
The Business Unit Network is one of the Business Unit (BU) within the Ericsson organization as illustrated in Figure 4. It takes care of order planning and order fulfillment of the company’s overall logistics chain.
regions C U S T O M E R S
CEO Group Functions
RESEARCH BUSINESS UNIT NETWORKS BUSINESS UNIT GLOBAL SERVICES BUSINESS UNIT MULTIMEDIA BUSINESS UNIT CDMA MOBILE SYSTEMS
Joint venture companies Joint venture companies
Sony Ericsson mobile communications ST -Ericsson
Operations & competence center Operations & competence center Engagement practices Engagement practices Customer units Customer units regions C U S T O M E R S
CEO Group Functions
RESEARCH BUSINESS UNIT NETWORKS BUSINESS UNIT GLOBAL SERVICES BUSINESS UNIT MULTIMEDIA BUSINESS UNIT CDMA MOBILE SYSTEMS
Joint venture companies
Joint venture companies
Sony Ericsson mobile communications ST-Ericsson
Operations & competence center Operations & competence center Engagement practices Engagement practices Customer units Customer units regions C U S T O M E R S
CEO Group Functions
RESEARCH BUSINESS UNIT NETWORKS BUSINESS UNIT GLOBAL SERVICES BUSINESS UNIT MULTIMEDIA BUSINESS UNIT CDMA MOBILE SYSTEMS
Joint venture companies Joint venture companies
Sony Ericsson mobile communications ST -Ericsson
Operations & competence center Operations & competence center Engagement practices Engagement practices Customer units Customer units regions C U S T O M E R S
CEO Group Functions
RESEARCH BUSINESS UNIT NETWORKS BUSINESS UNIT GLOBAL SERVICES BUSINESS UNIT MULTIMEDIA BUSINESS UNIT CDMA MOBILE SYSTEMS
Joint venture companies
Joint venture companies
Sony Ericsson mobile communications ST-Ericsson
Operations & competence center Operations & competence center Engagement practices Engagement practices Customer units Customer units
Figure 4: The Business Unit Network within Ericsson Group
2.2.2 Business Unit Network Supply (BNET Supply)
Business Unit Network Supply functions as part of the Business Unit Network (BNET) in section 2.2.2 above. The main task to support and satisfy customers with both hardware and software systems to the Ericsson offer by BNET. Supply organization is in turn divided into a number of functions and product areas with underlying of functions and product areas with underlying production units for each product (Ericsson internal website, 2011). One of the areas under the BNET supply is Site, Core and Packet Supply as illustrated in Figure 5.
BU Network Supply
Ericsson
BNET
Site, Core and Packet supply BNET Supply
Site, Core and Packet Supply
Figure 5: Business Unit Network Supply (BNET Supply) broken down to Site, Core and Packet Supply
2.2.3 Site, Core and Packet Supply unit
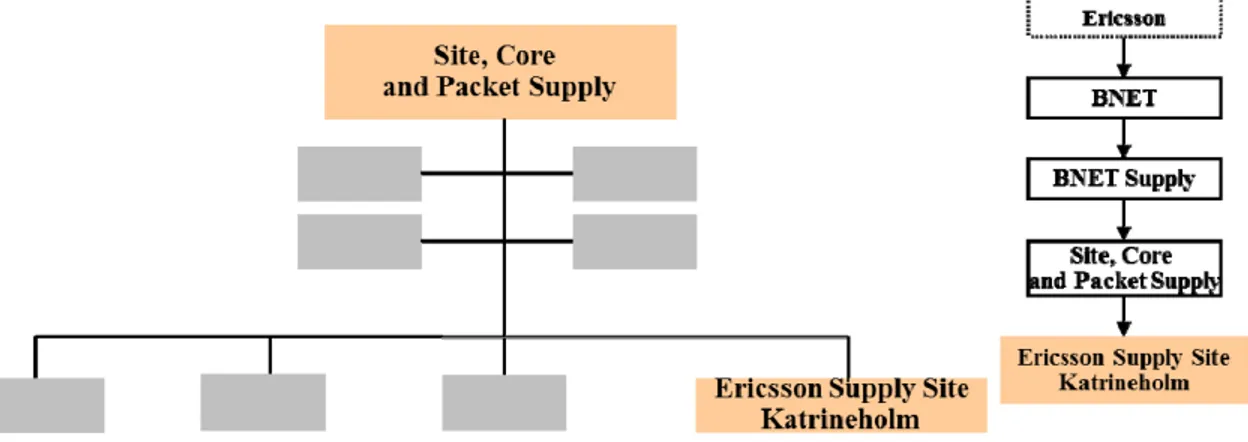
Site, Core and Packet Supply unit will responsible for driving supply chain and supply process improvements and controlling high and reliable performance within Ericsson's manufacturing, as well as from suppliers. The mission is to contribute to Ericsson’s success by securing a flexible, reliable and cost-effective production and supply of Site, Core and Packet products. One of production sites is managed by the Katrineholm unit (ESS KH) as followed in Figure 6 (Ericsson internal website, 2010).
Figure 6: Illustrating ESS KH is included in Site, Core and Packet Supply
2.3 Ericsson Supply Site Katrineholm
Ericsson Supply Site Katrineholm (ESS KH) is a node production center (NPC) for Ericsson's system solution and responsible for providing low volume/high mix production for core systems and platforms such as wire line, mobile core and multimedia (Ericsson internal presentation, 2010g).
ESS KH produces mobile Core (MSC / MCC server, Mobile Media Gateway and etc.), Multimedia (MMS, UPG, MOIP and etc.) and Wire line (former was telephony). It is specialized on industrialization of new system products and modules and the responsibility goes from early participation in product development projects, to developing maintenance chains for our finished products and systems, with high variation in low volume products( or is called Low Volume/High Mix product: LVHM) which is the core part of the system. Site Katrineholm, this study will focus on capacity management area which will be summarized the whole working area in following part. ESS KH wants to continue to be an appreciated partner driving Ericsson Low Volume/High Mix (LVHM) supply to perform better than customer expectations on a global basis. The service includes industrialization and prototyping for products in the LVHM product segment, product life cycle management, global master responsibility for the products portfolio, LVHM manufacturing, EOL manufacturing management, AMS services, and consulting services like logistics development, operational excellence and process development. Within the organizational structure of ESS KH, this study will focus on the capacity management department as illustrated in Figure 7.
Ericsson Supply Site Katrineholm Ericsson BNET Capacity Management BNET Supply Site, Core and Packet Supply
Ericsson Supply Site Katrineholm
Capacity Management
Figure 7: The Ericsson Supply Site Katrineholm broken down to Capacity Management
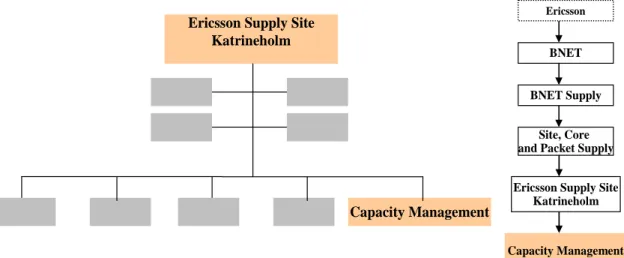
2.3.1 Capacity Management
Capacity Management is responsible for developing and dimensioning cost efficient and flexible supply chains in order to meet customer needs. The working areas in Capacity Management department include three functions; System, Report and Tool, Order Management and Dimensioning & Planning with one Support & Business Control Operational department. This study area is included in Dimensioning & Planning department, illustrated in Figure 8.
Capacity Management
Ericsson
BNET
Dimensioning & Planning
BNET Supply
Site, Core and Packet Supply
Ericsson Supply Site Katrineholm
Capacity Management
Order Management System, Report and Tool
Support & Business Control Operational Department
Dimensioning & Planning
Figure 8: The sections within Capacity Management at ESS KH
2.3.2 Dimensioning & Planning (D&P)
This study will be included in the Dimensioning & Planning department which is to support ESS KH level in adapting to the strategies and targets for the future within lean and agile philosophies to be able to maximize customer service to minimal cost. There are five working areas at dimensioning and planning (Ericsson internal presentations, 2010a):
1. MRP Process (within Katrineholm site) 2. Buffer dimensioning processes
3. Product Introduction Project (Master Planning/Dimensioning parts)
4. Logistics Development (Order planning processes, capacity planning processes etc. within ESS KH)
5. Logistics Development/ Global engagement (Strategic project core system supply, take part in central BNET supply planning development and supporting clone sites in logistics development)
2.4 Functional site structure
In order to provide understanding of the delivery process (which will be explained more in detail in Chapter 6) the following list describes some key supply sites and functions used within the material flows for the deliver process (Ericsson internal document, 2010a).
Ericsson Distribution Centre (EDC) or Stored Packed Goods (SPG): Warehouse for BU controlled packed material connected to a customer order that awaits pick-up by the DSP. Normally co-located with a global or regional warehouse.
Node Production Center: Factory for production/assembly of Ericsson material, either Make-to-order or Make-to-stock.
- 12 -
3. Methodology
This chapter presented the selected research design, the way of study and a discussion about the quality of the studies performed.
3.1 Research design
The way to conduct this thesis relied on the company's needs (Ericsson supply site Katrineholm) and authors’ fundamental ideas and opinions. The choice of method was based on the objective of the study. There are three possible methodological approaches to build on when a scientific study is designed; qualitative, quantitative and mixed approach.
Qualitative research can be conducted as a research strategy which includes analysis of texts, pictures, representation of data in figures and personal interpretation of the findings all inform qualitative procedures (Creswell, 2009). On the other hand, quantitative research can be conducted as a research strategy which involves specific methods, especially in survey and experimental research. Those relate to identifying the sample and population (Creswell, 2009). Nevertheless, the characteristics of qualitative and quantitative research approaches are compromised in a so-called mixed approach. Though a research can be predominantly approached in either of the two methods but it can also contain some characteristics of the other (Creswell, 2009).
This thesis is mainly about learning, analyzing and building a potentially strategies for setting CTP level. The expected result of the thesis is more likely to be expressed in a qualitative method than quantitatively. For this reason a qualitative research approach is predominant manner used in this thesis. After research approach (qualitative) was chosen, the designs of the research techniques were made according to the selected approach in order to visualize research problems. The main steps in qualitative research are suggested by Creswell (2009). These are the purpose, research questions, conceptual/theoretical frameworks, data collection techniques, data analysis, write-up the result of the study/conclusions and validation. The table 1 below shows the summary of included research techniques which lead to achieve the three objectives of this thesis.
Research Purpose Research Questions Methods Outcomes Objectives
Literature study The comprehensive
understanding of all concepts to be reflected in the research area
Interview The current state of CTP level set-up today
Constraints of CTP levelling setting up today
The effects of unreliable CTP levelling setting up
Site Observation The actual production situations and scenarios.
1. How to set the CTP level in an efficient and effective way?
Reference companies
The way of their working with CTP setting up related to ESS KH
The related systems are using for setting CTP level Literature study The characteristics of SAP
APO
The CTP setting process in SAP APO
Interview The needed master data of setting CTP in SAP APO The practical process of setting
CTP in SAP APO
Analyzing and setting strategies
for Capability to Promise
(CTP) level handling with
the Ericsson Supply Site
Katrineholm system
2. How to set the CTP level to align with SAP APO system?
Reference companies
Their systems which are used for setting CTP?
Comparing with ESS KH’s system
1. Maintaining the
delivery precision on
the first confirmed
order to 98%
2. Maintaining the lead
time response as 7
days
3. Maximizing the
automated order
handling
Table 1: The summary of included research techniques of this thesis
- 15 - Data collection
The relevant data in this thesis gathered from both primary and secondary data. The sources of the primary data will be interviews and observations. The secondary data will be printed and electronic resources.
1. Primary data A. Interview
Interview approach will be used to extract knowledge from experienced professionals. The four stakeholders in ESS KH are key interviewees; the production planning department, purchasing department, order management department and production department. Moreover, the interview approach will answer what the current state CTP set up today, the constraints of setting CTP level and the effects of unreliable setting CTP level.
B. Site observation
Visits to production sites in ESS KH will be conducted in order to understand the production process. It will also enable the researcher to identify the actual production situations and scenarios.
2. Secondary data A. Literature study
This part will be used to set up the theoretical framework which gives a comprehensive understanding of all concepts to be reflected in the research area. In the theoretical frame work basic concepts such as Supply Chain Management, Logistics, Product characteristics, Low-Volume/High-mix products, Order Fulfillment Process, Master scheduling, planning process, ATP & CTP application, MRP implementation, SAP application from SCM with SAP APO are some to mention. The sources of the literatures will be academically legitimate databases for electronic resources and books for printed resources. When necessary, internal resources from the company will be used on issues not addressed by the academic.
B. Case study
To choose case study as a research method, one unit was analyzed in the entire of this thesis, Ericsson supply site Katrineholm, Sweden. Reference studies were also conducted in order to allow a comparison with other companies, Volvo Penta in Gothenburg, Sweden and Volvo Construction Equipment in Eskilstuna, Sweden. The other units of analysis were selected from their similar way of setting capability (Yin, 2003) in order to fulfill customer orders by using advanced planning system from their different products and system. External case studies aim to compare the understanding of the use of complicated CTP leveling handling in these companies. The company's internal documentation, figures are graphs from different internal departments are needed for analyzing which describes the products, processes, and systems. The interview is arranged in order to grip on how they work with setting CTP in the best way. The interview question of Volvo Penta is attached in Appendix 1 and Volvo Construction Equipment in the Appendix 2.
Data analysis
Relying on a single cause can limit the solutions and some better solutions can be missing. The root cause analysis, hence, is used to be as a tool to analyze and identify the causes that are beneath the surface problems which will define what the problem is, why it happened and what should be done to prevent it (Thinkreliability, 2011). There are three basic steps in root cause analysis method as following; defining the issue by its impact to overall goals, analyzing the causes in a visual map and preventing or mitigate any negative impact to the goals by selecting the most effective solutions and any negative impact to the goals by selecting the most effective solutions
After we designed our research methodology, we synchronize the method and project time line with this project’s action plan by dividing into three phases as per Figure 9 below; Action Plan P1 Learning P2 Analyzing P3 Building
Product Process System Interviews
Literature Review
Case study Strategy/
Method Tool Box
Implementation Plan Comparable Company Underlining System
Figure 9: Action plan of this project
The action plan was divided into three phases; Phase 1 is a so-called Learning current state. This phase includes learning involved product, process and system. Analyzing current situation is in Phase 2, the methodology was conducted by using internal interviews, external case study which includes literature review and comparable companies, Underlining system. Phase 3 is Building which consists of strategies/methods, tool box and implementation plan.
3.2 Validity and reliability
The validity of the paper depends on the result consonant with the reality. Construct validity refers to if the thesis has been carried out in the right. For reliability, it is to certify the fact that the same results could be found if this research's conducted in another time by another researcher.
- 17 -
There are several methods for assuring validity and reliability of the results in qualitative research perspective. In this thesis, multiple views were used to ensure the validity. Interviews and site observations from different involved parties were made. Each department would get the similar interview questions according to research questions in order to get different aspects. Moreover, repeated investigation, either contact via email, telephone or face-to-face, were made to guarantee the information in discussion. This technique can increase credibility of data collection.
The presenting study progress and results to the company supervisor and manager on a regular basis is also one of techniques that was used to ensure that the results of this study are useful to the company.
The choice of reference companies are one of the techniques which enhances the possibility of generalization, compared to a single study. The selection of cases was made from some criteria in order to study the same phenomenon. The similar resource planning system as ERP for achieving order promising was chosen to study similarities between the cases even though they are different product types.
Reliability of this thesis can be heightened according to the guideline from Yin (2003). This book recommends organizing well documented way in order that other researchers can follow the same line of action and come to the same results. The interview questions have been well documented and enclosed at the end of this thesis (Appendix 1 and Appendix 2). In addition, the contact information which could contact in the future is listed at the end of this paper as well (Appendix 3).
4. Theoretical Background
This chapter contains the theoretical background and theories which are used to support the strategies and analyses of the work. It starts off by introducing Logistics and Supply Chain Management to which are the basic knowledge but they are important to understand in the beginning. This theoretical frame of reference deals with demand uncertainty, capacity management and safety stock. The product design and product characteristics are outlined. The master planning is further discussed as well as orders fulfillment process will be defined. At the end of the chapter two relevant software support for supply chain management; SAP ERP and SAP APO is used to described how Capability to Promise (CTP) work with.
4.1 Logistics
Waters, 2003 defines logistics as follows:
"Logistics is the function responsible for the flow of materials from suppliers into an organization, through operations within the organization, and then out to customers."
External Supplier
Inbound Logistics External
customer Outbound Logistics
Materials Management Operations within the organization
Logistics
Figure 10: The role of logistics (Waters, 2003)
From the Figure 10, it shows the role of logistics in general. Logistics hence include the flow of goods/services and integrated information between the point of origin and the point of consumption. Logistics is a channel of the supply chain which adds the value of time and place utility (Knolmayer, 2001).
4.2 Supply Chain Management
A supply chain is the network or the system of organizations, people, technology, activities, information and resources which are involved transforming natural resources, raw materials and components into a finished goods or service for the final customer (Selldin 2004). Waters 2003 defined supply chain as follows;
"A Supply Chain consists of the series of activities and organizations that materials move through on their journey from initial suppliers to final customers."
Typically, a supply chain is built up of several production activities which involve several production unit and storage points, connected by transportation of goods and by transforming information, as illustrated in Figure 11 (Selldin, 2004).
From
Suppliers CustomersFrom
Supply Chain Node Production/Storage Transportation Inventory Manufacturing Physical flow Information flow
Figure 11: A supply chain flow Physical flow
The products are transformed through the supply chain from raw material located upstream in the supply chain to the final product for the end customers located downstream.
Information flow
Information in a supply chain can comprise of a combination of all involved functions such as sales data, customer orders, inventory levels, capacity availability, production plans and demand forecasts (Selldin, 2004). The information flow will be transferred between the supply chain in different supply chain nodes upstream and downstream. Logistics and supply chain functions can overlap. Supply chain includes the logistics business functions above, and also includes purchasing, sourcing, procurement, buying, manufacturing operations, production scheduling and inventory control and materials management, facilities location planning, the information technology to coordinate between suppliers, the company, and customers (wholesalers and retailers and end users). In the past, manufacturers focus on logistics management which are small concern for improving manufacturing such as the optimization of transportation and distribution. (Dickersbach, 2008) But for now, supply chain management has more improvements and efficiency (Dickersbach, 2008). This integrates between different logistical functions and between planning and execution. Moreover, supply chain management will take all the processes; plan, source, make, delivery-per supply chain into account. (Dickersbach, 2008) The common supply chain processes cover the five
areas: Demand Planning, Order fulfillment (Sales, Transportation Planning), Distribution (Distribution Planning, Replenishment, VMI (Vendor Managed Inventory)), Production (Production Planning, Detailed Scheduling, Production Execution) and External procurement (Purchasing, Subcontracting) as following figure 12.(Dickersbach, 2008) Customers VMI Customers Distribution Centers Plants Suppliers Integrated Distribution & Production Planning Sales VMI Transportation Planning Demand Planning Distribution Planning Replenishment Production Planning Detailed Scheduling Production Execution Purchasing Subcontracting
Figure 12: The common supply chain processes (Dickersbach T.J., 2008) 4.2.1 Capacity Management
The capacity management is one of significant functions in Supply chain management which is included in production and operation management part. The capacity of a production unit, such as machine, factory is its ability to produce or do that which the customer requires.
In capacity calculation is equal the maximum capacity multiply by availability rate and efficiency rate and yield rate (Logistik, 2010) as follows;
Calculated capacity = Maximum capacity × Availability rate × Efficiency rate × Yield rate
Where:
Maximum Capacity: These are the total working hours for a given equipment on a 7 days a week/24 hours a day basis
Availability Rate: This ratio is the actual equipment run time compared to the full opening hours. Generally, it deducts the shut down time, idle time and the
maintenance time.
Efficiency Rate: This ratio compares the standard run time to complete an operation with the actual time spent to complete the operation.
Yield Rate: This is a ratio which takes into account the defects produced at the line or equipment that is wasting capacity.
4.2.2 Safety Stock
Safety Stock is the extra stock that is maintained to moderate risk of stock outs because of supply and demand uncertainty. The amount of safety stock depends on business policy of each company. Too much safety stock can resulting in high holding costs of inventory. On the other hand, too little safety stock can affect insufficient material or final products which result in losing customers. Therefore, the right balance of safety stock level is essential in manufacturing. The figure 13 below shows that safety stock must be set at a level which covers both excess material consumption within the replenishment lead time and the additional requirements that might occur during delivery delays. (Help.sap, 2011c)
Figure 13 Safety Stock and Reorder point (Help.sap, 2011c)
4.3 Product Design or Product Characteristic
In a supply chain perspective, product design or product characteristics are one of method can classify supply chain management. Different product lines result in different supply chain networks. This paper addresses two kinds of product types; High Volume/Low Mix Product and Low Volume/High Mix Product. In this thesis, Low-Volume/High-Mixed (LVHM) product will be the case study which is concerned.
- 22 -
4.3.1 Low Volume and High Mix (LVHM) Products
LVHM manufacturing mainly consider how quickly they can deliver exactly what their customers need. Normally, a LVHM supply chain network involves a wide supply base and highly random customer connections (William, 2001). This network also often combined a deep Bill of Materials (BOM) with many alternative routings. The production planning strategies for LVHM are often opposite from the high volume/low mix production which can balance capacity easier. The master planning normally is used in LVHM is Make to Order or MTO. In the planning of operation, the most important information is the customer orders, inventory levels and capacity availability (Selldin and Olhager, 2004). All of this information is included in Order fulfillment process which will be explained in following part.
4.3.2 High Volume/Low Mix (HVLM) and Low Volume/High Mix (LVHM) product comparison
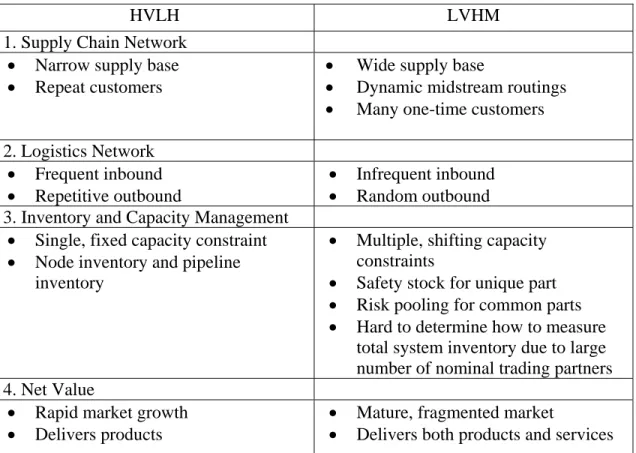
There are four fundamental differences between two kinds of products which are high volume/low mix products and low volume/high mix products (William, 2001) as following Table 2 below;
HVLH LVHM 1. Supply Chain Network
Narrow supply base
Repeat customers Wide supply base Dynamic midstream routings Many one-time customers 2. Logistics Network
Frequent inbound
Repetitive outbound Infrequent inbound Random outbound 3. Inventory and Capacity Management
Single, fixed capacity constraint Node inventory and pipeline
inventory
Multiple, shifting capacity constraints
Safety stock for unique part Risk pooling for common parts Hard to determine how to measure
total system inventory due to large number of nominal trading partners 4. Net Value
Rapid market growth
Delivers products Mature, fragmented market Delivers both products and services Table 2: Fundamental differences between high volume/low mix products and low volume/high mix products supply chain
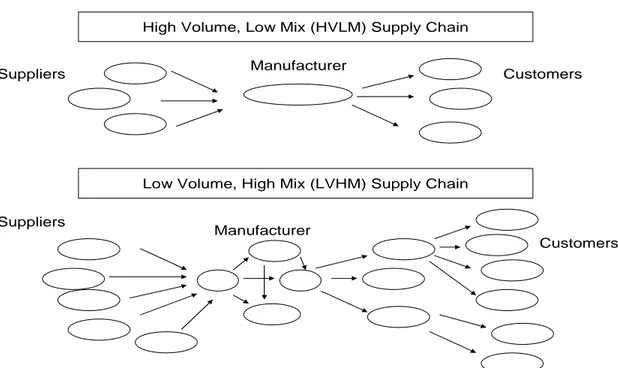
Supply Chain Network
The supply chain network can be described by dividing into three streams; upstream supply base, the value-adding midstream and the downstream customer set.
High Volume, Low Mix (HVLM) Supply Chain
Low Volume, High Mix (LVHM) Supply Chain
Suppliers Customers
Suppliers
Customers Manufacturer
Manufacturer
Figure 14: Comparing High Volume/Low Mix supply chain and Low Volume High Mix supply chain by William, 2001)
From figure 13 above, we can see that the upstream supply base of LVHM is wider as the Bill of Material across the full product range contains a relatively larger number of unique materials. For the value-adding midstream normally consists of a dynamic manufacturing in order to achieve the required set of alternative product routing. For the downstream, customer set is broader and the finished products are driven by more varied customer needs.
Logistics Networks
Variability is the obstacle of a logistics network. It causes logistics connections within the network to be unpredictable (William, 2001) or unexpectedly expensive. For HVLM, the inbound logistics path is more frequent than another. The outbound logistics paths will appear quite repetitive. On the other hand, the frequency and quantity of customer orders for LVHM product will be random (William, 2001). Therefore, both supply and demand sides in LVHM’s logistics networks are dynamic. Moreover, the product variability challenges the logistics network and achieved customer service level. The reason is unless the supply chain is holding stock on every product or option combination, customer need to wait for product to be produced. Inventory and Capacity Management
Concerning the supply and demand pattern, a LVHM scenario leads to different operating characteristics. For the supply side in LVHM, continuousness of supply is based on the careful management of safety stock inventory levels and also material risk pooling ensuring an ability to deal in real-time with multiple, shifting system constraints defined by product mix. (William, 2001) For the demand side, a HVLM demand pattern
is quite weighed toward repeated customer orders from a relatively narrow customer base. This in contrary with the demand pattern in LVHM, that is more weighted toward many different customers placing one time orders. From a supply chain perspective, its responsiveness to demand uncertainty depends on the prompt availability of inventory and capacity.
Net Value
From a Supply chain perspective, the LVHM can create a net value included in customer value and shareholder value. Company can gain customer satisfaction because their customers benefit from a perfect delivery at the lower cost on the product mix (William, 2001). Meanwhile, shareholders are satisfied since the profitable revenue growth build on a shrinking asset which is from a larger cash flow for reinvestment and a higher stock value.
4.4 Master Production Planning
The master production planning is the common basis for the supply processes (supply recommendations for purchasing, production, distribution etc.) and the order promising process (based on ATP and CTP quantities). By that, supply processes are synchronized with order promising, resulting in reliable order quotes. As a consequence the on time delivery KPI is improved (Knolmayer, 2001). By describing supply chains using some of the SCOR (Supply Chain Operations Reference) process modeling building blocks. SCOR is based on five distinct management processes: Plan, Source, Make, Deliver, and Return. But in this research will not emphasize on the last two processes. The figure15 below shows the three parts in SCOR model process building block which are explained in this section.
Figure 15: The main three part in SCOR which are involved in this paper. (Adapted from business-process-it, 2011)
4.4.1 Plan
- 24 -
The plan is the process that balances between aggregate demand and supply to develop the action which best meets sourcing, production, and delivery requirements (business-process-it, 2011). In the planning of operation, the most important information is the
- 25 -
customer orders, inventory levels and capacity availability. (Selldin, 2004) The example of planning as follows:
Demand planning Production management Supply chain
Change Management
Manufacturing resource planning Capacity planning
Forecasting
Available/capable to promise. 4.4.2 Source
The Source is the process that procures goods and services to meet planned or actual demand. The example of source process as follow:
Inventory management Procurement Vendor management Quality control Outsourcing/ subcontracting Purchase management Direct materials sourcing Supply management
Product lifecycle management 4.4.3 Make
This process transform product to a finished state to meet planned and actual demand. The example of actions which is included in "Make" process as follows:
Bill Of Materials or BOMs and routings
Production Strategy: Planning, scheduling and control. From the concept of a customer order decoupling point (CODP), the CODP separates the production strategy into two key strategies: (Wikner, 2006)
o Make To Stock (MTS): This strategy is based on stock-driven support among accumulation of inventory, customer service and capacity utilization which fluctuates with the level of demand.
o Make To Order (MTO): Different from MTS, this strategy is based on order-driven which fluctuate with the level of delivery precision (from Supplier).
(Dickersbach, 2008 ) MTO 'supports products of wide variety and custom design', 'typically produced in low units volumes', and 'where the firm's competitive advantage is in providing product technology requirements in line with the customer's delivery and quality requirements.' (Selldin, 2005)
- 26 - Material Requirements Planning or MRP
Material Requirements Planning (MRP) is a material planning methodology developed in the 1970's making use of computer technology. The main features of MRP are the creation of material requirements via exploding the bills of material, and time-phasing of requirements using posted average lead times. MRP II was developed as the second generation of MRP and it features the closed loop system: production planning drives the master schedule which drives the material plan which is the input to the capacity plan. Feedback loops provide input to the upper levels as a reiterative process. (rockfordconsulting, 1999)
MRP techniques essentially drove the development of manufacturing off-the-shelf software packages, utilizing an integrated data base. These systems evolved into what is now known as Enterprise Resource Planning (ERP) systems. (rockfordconsulting, 1999) In MRPII operation, forecasts are combined and adjusted for customer orders, and fed to the master scheduling module. Once the master schedule is set, the MRP process explodes the bills of material, usually overnight or on weekends, and develops the requirements for material. The material requirements feed the capacity planning module which tests the schedule developed by MRP against current capacity. This feedback loop creates two alternatives: increase capacity or adjust the master schedule. Netting of on-hand inventory balances and work-in-process is included as a regenerative process. (rockfordconsulting, 1999)
The Issues
Material Requirements Planning of any generation assumes a finely tuned data system, which seldom ever happens. It also works from lead times, a falsity because both external and internal lead times are dynamic and change daily. MRP also assumes infinite capacity which is unrealistic and difficult to manage. The end result is usually an increase of inventory caused by the manufacture of wrong parts, the very thing MRP was designed to resolve.(rockfordconsulting, 1999)
One reason for the excess generation of inventory is that the data system and accuracy required for MRP to properly run is difficult to maintain, and the MRP review system is notorious for printing tons of unused material review reports. It also requires de-expediting to prevent overstocking, which is seldom accomplished because it is often treated with low priority. (rockfordconsulting, 1999)
Finally MRP, utilizing time-phased order point methodology, is a push system that assumes demands rather than reacts to a true demand as in Demand Flow Technology. When driven by a forecast, as it is supposed to do, it reacts to the uncertainty of a forecast and produces parts that one hopes one will need. (rockfordconsulting, 1999)
- 27 - Pragmatic Applications
Material Requirements Planning techniques have been proven to be ineffective at the micro level. However, if decoupled from the execution systems, provides a good methodology for forecasting both internal and supplier capacity requirements. It is necessary to advocate "cutting the belt" between planning and execution. That is, use MRP for forecasting high level requirements, but use demand flow technology, finite capacity loading, and true pull systems, as Kanban, for executing the daily production needs. (rockfordconsulting, 1999)
MRP Process
MRP Approach uses the information about schedules, products and materials. These come from three main sources: (Water, 2003)
1. Master scheduling: giving the number of every product to be made in every period 2. Bill of Materials: listing the materials needed for every product
3. Inventory records: showing the materials available MRP Control
MRP-type control 'is appropriate when a wide variety of custom products is produced in low unit volumes', 'supports markets characterized by rapid changes in product
technology, high rates of new product introduction, and substantial changes in product design'. (Selldin, 2005)
Configuration Job Scheduling
Shop floor data collection Quality control
Costing
4.5 Order Fulfillment Process
Order fulfillment is one of key process in managing the supply chain. It is the customers' orders that put the supply chain and fill them efficiently and effectively is the first step in providing customer service. The order fulfillment process involves designing a network and a process that a firm to meet customer requests while minimizing the total delivered cost and maximizing the firm's profit. It needs to be implemented cross-functionally and with the coordination of key suppliers and customers (Keely, 2003). Order fulfillment is a crucial part of many businesses and the process also can be determined in different ways which depends on what kind of business is. Nowadays, there are many softwares that can support order fulfillment as following section. This thesis mainly discuss in the Make to Order (MTO) process which has dynamic demand rate, adaptable production and customer-unique products characteristics. Comparing with Make to Stock (MTS), this process has stable demand rate, cost-efficient production and standardized products. The figure 16 below shows the MTS and MTO which has Customer Decouple point in between to keep the buffer to be cushion.
Figure 16: Comparing Make to Stock (MTS) and Make to Order (MTO) fulfillment, (Keely, 2003).
4.6 Software Support for Supply Chain Management
This section introduces systems in support of logistics and supply chain management. It demonstrates the principles and theory of good design of stored data and integrated information systems support and gives exposure to the most modern implementations of this in the form of the Enterprise Resource Planning software and advanced supply chain management system which this paper will mention only SAP APO (Advanced Planner and Optimizer). (Knolmayer, et al. 2001)
4.6.1 SAP ERP (Enterprise Resource Planning System)
One of the systems which support supply chain management is known as Enterprise Resource Planning System or ERP, with a scope illustrated in figure 17 as follows:
Supplier Operations Supplier Operations purchasing Material Requirements planning Master Scheduling Order and delivery Customer Operations Internal MRP External ERP
Co-ordinated operations in all organizations
Figure 17: Enterprise Resource Planning System or ERP (Bowersox, et al., 2007)
The worldwide market leader of ERP systems is the SAP R/3 system (Knolmayer, et al. 2001). As stated by the vendor, the potential benefits of SAP ERP are efficient business process, inventory reduction, and lead time reduction. SAP R/3 was replaced with the introduction of ERP Central Component (SAP ECC). SAP R/3 can be described as the predecessor of SAP ECC. Moreover, The SAP Business Warehouse, SAP Strategic Enterprise Management and Internet Transaction Server were also merged into SAP ECC.
4.6.2 SAP APO (Advanced Planner and Optimizer)
This study will describe the SAP APO knowledge in order to lay the theoretical background and make more understand in ESS KH's system in Chapter 6. SAP APO is a whole suite of supply chain planner applications which synchronizes supply chain knowledge and provide forecasting, planning and optimization. SAP APO is in real time and any data related to the production, the sales or the supplies is immediately transferred from one system to another without requiring any batch processing. This application provides many functions for both intra- and inter-organization regarding planning, scheduling and monitoring. There are seven modules included in APO package that uses a shared database (Knolmayer, 2001) as shown in table 3. The benefits of the SAP APO is that it provides the basis for an end-to-end supply chain management solution, seamlessly linking all key processes from order generation to production planning to transportation.