J
Ö N K Ö P I N GI
N T E R N A T I O N A LB
U S I N E S SS
C H O O L JÖNKÖPING UNIVERSITYH i g h f l y e r s
A Study on Competition, Price and Service Quality
in the European Aviation Industry
Master Thesis within Business Administration Authors: James N. Finklea II
Jakob F. Kegel
Tutor: Helén Anderson
Master Thesis within Business Administration
Title: High flyers. A Study on Competition, Price and Service Quality in the European Aviation Industry.
Authors: James N. Finklea II, Jakob F. Kegel
Tutor: Helén Anderson
Date: 2005-05-26
Subject terms: Business Administration Abstract
Background: Since the airline deregulation was completed in 1997, a new business model
has emerged in the European civil aviation industry. It has caused a shift in the way people travel within Europe. The airlines operating under this new business model known as point-to-point, have created a new outlet for commercial passenger travel and raised con-cerns for established flag carriers.
Problem: This study is of great importance due to the fact that people are traveling more
frequently and wish to do so quicker and more efficiently. With so many options to choose from and cost being an important decision maker for both companies and consumers, a study of this industry in terms of competition, price and service quality is of great impor-tance.
Purpose: The purpose of this thesis is to investigate and describe whether or not changes in the competitive landscape of the European civil aviation industry are related to the movement of economy class prices. The thesis also looks at whether or not changes in the competitive landscape are related to changes in service quality in the same industry. Both flag-carriers and low-cost carriers in terms of their business models will be investigated.
Method: The method chosen for this study was of an integrated approach based solely on
secondary data due to the sheer size and scope of this industry. This study investigated the two major business models of this industry through routes to the major cities and capitals of Western Europe from Stockholm Arlanda airport and Stockholm Skavsta airport. A literature study coupled with a comparative analysis has also been done.
Conclusions: Dramatic change is occurring in the industry. Competition is increasing not only between companies but between two competing business models. Increased competi-tion is leading to better on-time performance but lower in-flight and ground service quality. Aggregate price level has risen for flag carries with the opposite happening for low-cost carriers. The increased competition is threatening the ill-performing flag carriers and will most likely transform the industry.
Table of Contents
1
Introduction ... 4
1.1 Point of Departure ...4 1.2 Problem Statement...5 1.3 Purpose ...62
Frame of Reference ... 7
2.1 Competition ...72.1.1 Five forces model ...8
2.2 Price ...12 2.3 Service Quality ...14 2.4 Business Models ...15 2.4.1 Hub-and-spoke ...15 2.4.2 Point-to-point ...16 2.5 Research Aspirations ...17
3
Method ... 18
3.1 Method Choice ...18 3.2 Data Types ...18 3.3 Data Collection ...19 3.4 Method Credibility...20 3.4.1 Reliability ...20 3.4.2 Validity...21 3.5 Method Limitations ...214
Empirical Findings and Analysis... 23
4.1 Competition ...23
4.1.1 Supply and demand of seats ...25
4.2 Price Data...30
4.2.1 Flag carrier financials ...31
4.2.2 Low-cost carrier financials ...33
4.2.3 Analysis of relation between competition and price ...35
4.3 Service Quality ...36
4.3.1 On-time performance...36
4.3.2 Flag carrier service quality...37
4.3.3 Low-cost carrier service quality ...37
4.3.4 Analysis of relation between competition and service quality ...38
5
Conclusions ... 40
5.1 Competition Conclusions...40
5.2 Price Conclusions...40
5.3 Service Quality Conclusions ...41
5.4 Connection between Price and Service Quality...41
References... 43
Appendix... 47
Figures
Figure 2-1. Five-forces model ...8Figure 2-2. Competing airline business models ...15
Figure 4-1. “Goodbye Lufthansa” ...23
Figure 4-2. Market shares of intra-EU air travel ...24
Figure 4-3. SAS market share 2002...25
Figure 4-4. Market share in European air travel. ...25
Figure 4-5. Arlanda seat supply ...26
Figure 4-6. Arlanda departure volume...27
Figure 4-7. Supply and demand spread Arlanda...27
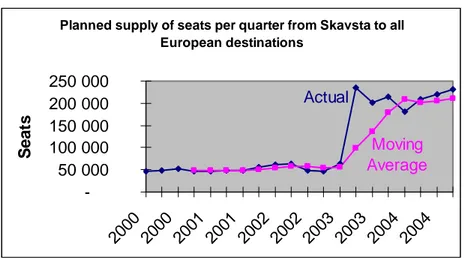
Figure 4-8. Skavsta seat supply ...28
Figure 4-9. Skavsta departure volume. ...28
Figure 4-10. Supply and demand spread Skavsta. ...29
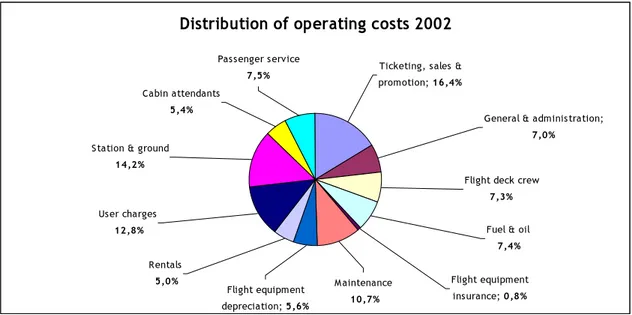
Figure 4-11. Operating costs 2002...30
Figure 4-12. Rising concerns for airlines. ...30
Figure 4-13. European departure delays...36
Figure 4-14. Primary departure delay cause. ...37
Tables
Table 4-1. Flag carrier financial results ...31Table 4-2. Cost of low class operation ...31
Table 4-3. Ryanair financial and passenger data ...34
Table 4-4. Flag carrier vs Low-cost carrier cost comparison ...35
1 Introduction
__________________________________________________________________________________________________________ In this chapter, an introduction to the European airline industry will be given. In addition, our specific problem will be stated, as well as our purpose explained. Furthermore, the actors this study will include will be defined, along with a brief overview of the size and scope of the airline industry in Europe.
__________________________________________________________________________________________________________
1.1 Point of Departure
The commercial airline industry in Europe is unique and fascinating at the same time. Be-fore 1997, the effects of government regulation had limited competition among aviation companies within and outside of Europe. Known as flag carriers, the major airlines of Europe all operated under strict controls in their respective nations, for instance, British Airways in the United Kingdom, Air France in France and SAS in Scandinavia. A sense of “conservative nationalistic character” limited the entry of new airlines into the market as well as partially inhibited the progress of full international growth (Chan, 2000). This na-tionalistic business behavior dates back to the post World War II era, when most airlines were either government-owned or government-controlled. Such controls dictated which airlines could fly where, how many seats they could offer and in many cases, what fares they could charge for routes. Airline regulation imposed by governments in Europe re-sulted in inefficiency, financial losses and foregone consumer benefits (The Economist, 2003-10-02). Furthermore, these flag carriers represented the nations they operated in, as flying ambassadors who were viewed as symbols of national pride and prestige. As a result, it was very difficult to form international air agreements, contracts and provide services to the flying public between European nations (Chan, 2000).
As time went on and the governments of Europe began to cooperate towards the unifica-tion of the continent, government regulaunifica-tions started to slowly lift on airline operaunifica-tions. In 1987 partial deregulation started to take shape, however this process was not fully complete until 1997. In an increasingly global economy, the airline industry was not only serving the flying public at the heart of the travel and tourism industry, but also had a huge impact on other industries since over 25% of the world’s manufactured exports reach their destina-tions by air (Chan, 2000). The relaxed controls through the European Union’s Open-Sky Treaty (1992) coupled with an increase in passenger demand in the late 20th and early 21st
century, led the way for heightened competition and the emergence of new airlines (Riley, 2003).
The new airlines that were emerging in Europe at the end of the 20th century had a new and innovative business model that was very different from that already established by the flag carriers. The newcomers were utilizing similar routes but with cheaper facilities, smaller airports, higher load factors and faster turn-around times resulting in lower operating costs. The result was airlines that could offer much lower fares. The low-cost carriers were born. At present there are some 50 low-cost carriers of different sizes operating all over Europe. The largest and most recognizable is the Irish based carrier, Ryanair. Other low-cost carri-ers in Europe include Easy Jet, Virgin Express, Wizz Air and Snowflake. In Europe and elsewhere low-cost carriers have begun to accumulate market share from the more expen-sive flag carriers over the past 5 years. Only at Arlanda airport, 10% of all departing pas-sengers used low-cost airlines in 2004 (Luftfartsverket, 2005).
ings by the low-cost carriers in terms of service on-board the plane on short haul flights by not offering free food and drinks. Two interesting questions arise: firstly how passengers are defining service quality of air travel and secondly if flag carriers, as a result of the emer-gence of low-cost carriers, have decreased their service quality?
Economic theory suggests that increased competition will result in lower prices. However the result on service quality is ambiguous and not well researched. The increased presence of low-cost carriers in this industry will most likely result in lower prices, but what about service quality? We feel that both the relations between competition and price, as well as competition and service quality can yield important results for this industry and thus are worth investigating. Therefore, this thesis will focus on the relations between competition, price and service quality in the European airline industry. Theory will be connected to the real world through an empirical analysis of flag carriers and low-cost carriers including their respective business models in an attempt to see how increased competition interplays with service quality and price.
1.2 Problem Statement
The overall research problem of our thesis can be summarized in the following way: What are
the major results and effects of competition within the European commercial airline industry? In order to
adequately address and answer this research problem, an investigation of both flag carriers and low-cost carriers will be conducted. Our aim is to compare and contrast the two business models in terms of price and service quality and see what effects, if any, competition has on European airlines. We will do this by formulating answers to the following research ques-tions:
1. What theoretical framework should be used when investigating competition, price and service quality?
2. Which airlines are important to include in this study?
3. What are the strategies of both flag carriers and low-cost carriers with regards to competition, price and service quality issues?
4. Which business model is proving to be successful for both businesses and their customers in an ever demanding market?
This particular study is of great importance due to the fact that people are traveling more frequently and efficiently than in the past. With so many options to choose from and cost being an important deciding factor for both companies and consumers, a study of this in-dustry in terms of competition, price and service quality is of great importance. Not just to the companies investigated, but also of importance to the general flying public who utilize these air carriers for their travel needs. We would therefore like to see which of the two classes of air carriers, low-cost and flag carriers, are succeeding in meeting the public’s wants and needs. In order to achieve this we will be conducting an investigation of both flag carriers and low-cost carriers. Flag carriers for example are airlines such as but not lim-ited to British Airways, Air France, Lufthansa, KLM Royal Dutch Airlines and SAS Scan-dinavian Airlines.
For low-cost carriers, we will be investigating Ryanair which at present, is Europe’s largest low-cost carrier in terms of passenger volume and most important in terms of industry im-pact (Ryanair, 2004). Low-cost carriers are operating under a distinct business model and it
is therefore appropriate to assume that the operations of Ryanair are good proxy of the op-erations of low-cost carriers in general. Since much of the data about competition, price and service quality is proprietary, aggregated industry data will mainly be investigated in this thesis.
1.3 Purpose
The purpose of this thesis is to investigate and describe whether or not changes in the competitive landscape of the European civil aviation industry are related to the movement of economy class prices. The thesis also looks at whether or not changes in the competitive landscape are related to changes in service quality in the same industry. Both flag-carriers and low-cost carriers in terms of their business models will be investigated.
2 Frame of Reference
__________________________________________________________________________________________________________ This chapter will begin with an overview of the theories supporting and providing background to competition, service quality and price in the European civil aviation industry . Descriptions will follow of the different business models employed by flag carriers and low-cost carriers.
__________________________________________________________________________________________________________
2.1 Competition
Competition; defined as rivalry between individuals, groups, nations or even organisms has existed as long as our planet, if not longer. Adam Smith (1776) defined competition as the rivalry between sellers to dispose supplies and between buyers to obtain supplies. He ex-plained how changing supply will affect the price. He did this in the theorem on the alloca-tion of resources. According to this theorem, an owner of any productive resource will seek to employ it wherever it yields the greatest return. Under competition, every resource will therefore yield the same return or it will be reallocated, meaning transferred to another in-dustry. John Stuart Mill (1848: p. 3) summed this up very clearly by stating: “There cannot be two prices in the same market.” Smith (1776) knew that knowledge must exist about the returns not only within one industry, but also across industries and that the reallocation of resources might take time, but in the long run, he argued, returns would equalize.
As the concept of competition can be applied to any situation where the supply is limited, the definition is not very stringent. Smith’s (1776) definition only required a number of buyers and sellers to be present for the concept to occur. The number of suppliers or buy-ers present changes the intensity of competition, but the definition does not give much help in determining the difference in intensity between markets or industries.
Edgeworth (1881) was the first one to come up with a clear definition of perfect competition. His definition can be summarized in two points: There are an indefinitely large number of buyers and sellers present. Each trader can make tentative contracts with everyone and alter those contracts at will. Even though the author did not address the issue of market failures and perfect information, his definition is still valid.
Today perfect competition is defined by Parkin, Powell and Matthews (2000) as a market where: (1) there are many firms, each selling an identical product; (2) there are many buyers; (3) there are no entry or exit restrictions; (4) firms have no advantage over potential new en-trants; and (5) firms and buyers are completely informed about the prices of the products of each firm in the industry.
Despite the clarity of the competition definition in economic theory, it is highly theoreti-cal and not very practitheoreti-cal. Perfect competition has not been observed in any real industry or market. Therefore it is not helpful when determining competition from a management perspective. For the partial purpose of this thesis - to determine whether competition has increased or decreased in the European civil aviation industry - the five forces model (Porter, 1979) is more appropriate to utilize.
2.1.1 Five forces model1
The risk adjusted rate of return should, according to the economic competition theory, be equal between industries (Mill, 1848). However, as Johnson and Scholes (2001) shows this is not always true. There seems to be more variables influencing competition than has been described so far. Using Porter’s (1979) five-forces model for industry analysis creates a better understanding of industry competition and the consequent profitability that can be achieved (Figure 2-1). According to the model, buyer and supplier power, barriers to entry, product substitutes and firm rivalry make up the basis for industry ri-valry which determines the profitability. Depending on the interaction and individual strengths of the five forces, rivalry in an industry will vary. Rivalry is primarily measured by the industry concentration ratio. High industry concentration ratio means that a few firms have a substantial amount of the market share. Bruce Henderson, founder of the consulting company BCG created the rule of “three and four”: a stable industry - an in-dustry with low rivalry - will have no more than three significant players. The largest player will have no more than four times the market share of the smallest. Under such circumstances the rivalry is low. On the other hand, fragmented industries with many players and none with a dominating position will face high rivalry. From a management perspective, the level of rivalry can therefore be understood as the level of competition between companies in an industry.
When using the five forces model, it is important that the researcher is clear of what indus-try is being analyzed. This is due to the interconnection between the five forces model and the concepts of the value chain and the value systems. The value chain is picturing the company as a unit, inputting raw material, adding value to this material at different stages in the production process and eventually creating an output (Porter, 1980). The value chain of a company is connected to the various value chains of the company’s suppliers and buyers. The interconnected value chains make up a value system where every company is both a supplier and a buyer. As a simple example, strong buyer power when analyzing the car
sup-ply industry will translate into weak supplier power when analyzing the car industry.
Figure 2-1. Five-forces model (Porter, 1979).
1 All information in section 2.1.1 through section 2.1.1.5 are referenced from Porter (1979; 1980) if not stated otherwise.
2.1.1.1 Buyer and supplier power
The two forces, buyer power and supplier power can be seen as mirror images of each other. According to Porter’s (1979) model, every firm is both a buyer and a supplier de-pending on what industry the researcher is analyzing. Therefore the same conditions will affect the two forces but in opposite directions. However, the researcher must remember that strong buyer power does not, by definition, translate into weak supplier power when conducting an industry analysis. The reason is that the five forces model is applied on an industry having the value system in mind. The industry under investigation will have sup-pliers supplying the input and buyers buying the output. Therefore an industry can simulta-neously experience strong buyer power and strong supplier power.
The clearest case of strong buyer power and weak supplier power emerges in monopsonis-tic conditions, defined as a market with one buyer and many suppliers. In such conditions, the buyer will exercise power over the suppliers. Even though there are few monopsonies in the real world, there are unbalances between buyers and the suppliers resembling mo-nopsonistic conditions. For instance, the relation between a car manufacturer and the re-gional suppliers can often display monopsonistic characteristics. The suppliers’ dependency on the car manufacturer creates strong buyer power if the analysis is on the supplier indus-try and weak supplier power if the analysis is on the car indusindus-try.
Buyer and supplier concentrations in terms of the market share controlled create both buyer and supplier power. A buyer of consumer goods such as Wal-Mart and a supplier of computer components such as Intel, both exercise strong power due to the market share they control.
The quantity of total output purchased by a buyer increases the buyer power and weakens the supplier power. On the other hand, if the number of buyers is large and what they are buying is critical for their own production process, buyer power tends to decrease and sup-plier power increases.
Buyer power can decrease if the cost for switching from one industry firm to another is high. For instance, car suppliers developing not only parts but complete components have raised the switching cost for the buyer of the component.
Backward and forward integration refers to the acquisition of a supplier or a buyer by an industry firm. If there is a real threat of forward integration, buyer power tends to decrease. If a buyer is threatening with backward integration – buying a firm in the industry – buyer power tends to increase.
2.1.1.2 Threat of substitute
Threats of substitutes originate from products in other industries that can potentially re-place the industry’s product.2 A substitute product limits the maximum price that can be
charged by the industry. This puts pressure on industry profitability and therefore creates competition between the firms in the industry. As more substitutes are created or as a par-ticular substitute increases in importance, the demand elasticity becomes larger for the in-dustry product, meaning that customers become more price sensitive. In the airline
indus-2 The five forces model is applicable not only to firms producing products but also to firms producing ser-vice. For the purpose of communicative precision, whenever using the term products the authors refer also to services.
try there are few real substitutes as the alternatives such as cars, busses and trains are often not a feasible alternative for long distance travel. However, one could look at the product offered by low-cost carriers as a substitute for an often more expensive product offered by flag carriers. Furthermore, as technology develops, substitutes emerge. For instance, the development of the X2000 train between Gothenburg and Stockholm is starting to emerge as a substitute for air travel, as the total travel time with the train approaches that of the air-line when transfers to and from airports are included. The threat of substitutes is hence al-ways present but the risks can be either low or high.
2.1.1.3 Potential entrance
In competition theory, firms are allowed to freely enter and exit the industry depending on the expected returns. This makes the risk adjusted return equal across industries. As returns in an industry increase more firms will enter the industry, driving profits down to a level which causes firms to leave the industry. The reality looks different. Firms already in an in-dustry have no interest in new entrants and will attempt to keep other firms out by establish-ing barriers to entry. Barriers to entry constitute legal, financial, or organizational hinders that prevent new firms from entering the industry.
Governments are still important barrier builders in industries they believe should be pro-tected. This has been apparent in the airline industry until the deregulations were initiated in 1987. However, the broad emergence of free trade through the World Trade Organiza-tion and the EU is making it increasingly more difficult for governments to protect indus-tries (The Economist, 2003-10-02).
Patents and proprietary knowledge can hinder firms from entering an industry as the nec-essary assets to operate are not available. This is not an important barrier in the airline in-dustry. More important are instead the distribution channels. In the airline industry airports are seen as the most important distribution channel for the industry’s products. For many years the airports were government owned and only firms authorized by the government could utilize them. Since the government was protecting the national carriers, owning the airports was an effective way of keeping all foreign competition away. The deregulation of the industry made airports for-profit organizations accepting any airline, dramatically lower-ing the barriers to entry.
Internal economies of scale can hinder companies from entering an industry as the in-vestments can be prohibitive. The drawback of high economies of scale is that they also constitute an exit barrier for the firms already involved in the industry. This is the case with the airline industry where several large airlines end up as unprofitable players in a high rivalry industry.
2.1.1.4 Industry rivalry
The four forces discussed above are all indirectly influencing industry rivalry (competition). Industry characteristics will also determine rivalry, but the effect is more direct. The total number of firms in an industry is directly related to the level of rivalry: the more firms com-peting in an industry, the greater the rivalry. The rivalry can also be enhanced or weakened depending on the over-all growth rate of the industry. The slower market growth, the larger the rivalry as increased turn-over can only be achieved at the expense of a competitor and not simply through an expanding market.
de-high fixed cost industry will try to increase their market share, leading to de-high rivalry. Stor-age cost and perishability also have a positive relation to rivalry. The higher storStor-age cost and/or perishability, the higher the rivalry as firms will fight to get rid of their stock.
Switching costs do not only influence supplier and buyer power but also industry rivalry: The lower the switching costs between industry products, the higher the rivalry as firms have to compete harder to keep their customers. One way to avoid this is through product differentiation. If a firm can differentiate its products from the competitors in the same in-dustry, like Caterpillar has done with heavy vehicles, the firm can experience higher profit-ability and less competition – the rivalry decreases.
Strategic stakes in the form of potentially large gains or losses can increase the level of ri-valry. Often technological, economic, or political change can spark the increase in riri-valry. Industry shakeout, defined as previously high-growth industries with many firms facing slow growth, increases rivalry. When the industry passes the point of maximum capacity and profits starts to shrink, industry shakeouts may occur. This can also be understood as an increase in the strategic stakes, as firms will survive or die. Exit barriers will also increase the rivalry. Asset specification is a common exit barrier. When the production assets are highly purpose specific, they might in certain circumstances be difficult to sell.
In a low rivalry industry there are often unwritten rules of the industry. When competitors are not directly competing with each other; the industry is said to be disciplined as all compa-nies are behaving according to the unwritten rules of the industry. Explicit collusion in most countries is illegal and the understanding is therefore informal and often based on historical considerations of the consequences of direct competition. Stable industries have always ex-perienced high rivalry and cut-throat competition and are aware of the decreasing industry profitability created by explicit and direct competition. However, firm diversity can increase rivalry due to differences in history, goals, working methods and often a lack of understand-ing of the unwritten industry rules. The American healthcare business with both profit-making and non-profit organizations is often used as an example by Porter (1979).
Stable industries can be destabilized leading to increased rivalry by newcomers that break the unwritten rules. Destabilization of industries is often coupled with technological devel-opment or market deregulation. This has been the case in the airline industry. Four impor-tant changes that have a destabilizing effect are: changing prices, improved product differ-entiation, changing distribution channels and new relationships with suppliers. By changing prices, a firm will change the profitability of the other firms and destabilize the relations. By dramatically changing production processes or product features, firms will have an impact on both pricing and customer preferences through product differentiation. By innovative ways of distribution, newcomers can challenge the incumbents and destroy power struc-tures within industries. Vertical integration will also change distribution channels. By changing relations with the suppliers or creating completely new relations, a firm will have an impact on the input and can therefore dramatically change industry relations.
2.1.1.5 Critique of the five forces model
Porter has a background in industrial economics which is reflected in many of his models. The view of industries is often through the metaphor of an assembly line making his mod-els linear. Two of the biggest critics towards the omnipotent endorsement of Porter, espe-cially in popular press, are Normann and Ramírez (1994). They argue that the metaphor of an assembly line used in the value chain analysis that spilled over to the five forces model, does not belong in today’s world dominated by services. They suggest value constellation as
an alternative to the value chain. An analysis using the value constellation concept opens up for new relations and new type of value creation by viewing the relations as more dynamic and flexible compared to the view in the value chain. However, despite the theoretical al-lure of the value constellation concept, it is still unexplored and has not gone through rig-orous qualitative and quantitative testing. Therefore, the authors believe the five forces model and the underlying value chain concept to be more appropriate for this study, de-spite its linear view of the world.
2.1.1.6 Competition summary
The authors understanding of competition has its base on the classic definition of perfect competition. To make this highly theoretical concept applicable in this study, the authors have used the five forces model of industry analysis to determine the level of competi-tion. Implicitly the authors therefore suggest that rivalry, which is measured by the model and competition are synonyms describing the same phenomenon. Choosing the five forces model is more appropriate considering that the problem under investigation is viewed from a management perspective rather than from an economics perspective.
2.2 Price
Basic macroeconomic theory suggests that whenever free competition is allowed, consumer prices will fall compared to consumer prices in a monopolistic or oligopolistic market situa-tion (Parkin, Powell & Matthews, 2000). The recent deregulasitua-tion in the European civil avia-tion industry is the kind of event that according to theory, should increase competiavia-tion and drive down prices. Below we will expand on the theory of price before empirically investi-gating if a change in price has occurred.
The major purpose of any science is to explain or understand a phenomenon that is ob-served. In dealing with prices in the European civil aviation industry, economic pricing theory ought to be able to explain the basis of product prices. This implies that this theory should be able to address issues such as looking at why the price for product A is higher than product B and why the price level for both is where it is. Furthermore, this theory should address why price is stable over a certain time period and how or why it can sud-denly change.
In theory, price should be determined as total average cost plus a normal profit (equals op-portunity cost) as this would constitute a fair price (Fog, 1994). However, changes in the competitive landscape, such as the deregulation in the airline industry, may cause prices to be below this level. The reason being that companies would be prepared to operate below the opportunity cost and run a loss in order to defend their market position and possible future profits (Fog, 1994).
There are two main types of economic perspectives on price that result in two separate theo-ries. The first is a macroeconomic perspective on price. This looks at the full view of the whole economy and focuses on general price level. It paints a broad picture of what is going on in a certain market or area. The aim of this perspective is to explain how prices are formed, why prices change and why some change more frequently or drastically than others. The theory that this perspective leads to is what is known as a normative theory (Fog, 1994). This theory is more or less a guide to the decision maker of a firm or business on how to achieve a de-sired price and economic position for a certain product or service (Fog, 1994).
The second main economic perspective on price is classified as microeconomic. The micro-economic perspective on price focuses on the individual firm or seller. Its main goal is an attempt to explain all problems connected with the determining of specific prices in spe-cific firms. For instance in this study, this theory will explain how airlines adequately de-termine and justify the fare prices at which they sell seats to customers. The microeconomic perspective on price leads to what is known as the descriptive theory which is usually viewed from the outside of a company. The main goal or aim of this theory is to explain why prices are set the way that they are. The descriptive theory has not only a value in it-self. It can also be helpful to governments, politicians and others by having a certain pre-dictive value. Descriptive economic theory should be able to address such issues as one, the likely effect on price when a specific tax is imposed on a specific product. A second issue is the likely price effect of a specific increase in labor wages. Lastly, the descriptive theory looks at the effect of prices when a general increase in demand occurs.
This thesis will mostly focus on the microeconomic perspective on prices and the descriptive theory. Furthermore, within that descriptive theory, we will pay close attention to the possi-ble answer to that third question. We will be asking, “if a general increase in demand occurs within this industry, what will be the effect on company revenues and expenses for both flag carriers and low-cost carriers?”
In order to adequately classify price theories, Fog (1994) states that it is convenient to place all different types of pricing into the following three broad categories. The first includes all cases where price is determined by factors on the demand side, or at least so that demand considerations are dominant. This is known as Market Price Theory. The second category of price includes all cases where price is determined exclusively or mainly by cost factors. The major type is full cost pricing, which is based on allocation of all costs to each individual product, also known as Full Cost Theory. Finally, the last pricing category includes prices that are determined by the interplay between demand and cost factors. This is called Marginal Theory and prices set according to economic theory will be placed in this group.
To classify pricing theory as well as organize pricing data, we will take calculations and sta-tistical analysis of secondary pricing data from the airlines and from the industry as a whole. According to Fog (1994), such an analysis explains what happens to prices over time. In order to create such an analysis, it will be important to statistically determine the relative demand and cost function either through a regression analysis or through a moving average analysis through the use of Microsoft Excel. Furthermore according to Fog (1994) opti-mum price is determined by three main factors. The first is when the difference between total revenue and total cost is at maximum. Secondly, the average (gross or net) revenue per unit that is multiplied by the number of units sold is higher than cost. Finally, optimum price can be determined economically when marginal costs equals marginal revenue (Fog 1994).
The relation between price and competition has been extensively researched by economic theorists such as Sanior (1836), Edgeworth (1881), Porter (1979) and Parkin et al. (2000). This relation has been intuitively easy to understand. However, the relation between com-petition and service quality is less so, due to the complexity and subjectivity of the nature of service quality. All economic policy should be about maximizing utility and thus it is im-portant to investigate how service quality is affected by changes in competition and price, as we believe that service quality increases utility.
2.3 Service Quality
The use of the term service quality in business, academia and daily life is as frequent as there are definitions of it for the simple reason that service quality is defined in the eyes of the beholder. Nevertheless we will attempt to define it more stringently.
In a service company, the term service quality is difficult to measure as service quality is not something absolute, but is determined by an interplay between a customer’s perception and expectation. Service quality is perceived to be high if the service satisfies the customer’s ex-pectations. Satisfaction is therefore seen as a good proxy for service quality.
Maister (1993) states that customer satisfaction is the result of a mental comparison proc-ess between expectation and perception. The procproc-ess will result in satisfaction if the differ-ence between perception and expectation is zero, or if the perceived value is greater than the expected. This means that customers will be satisfied if the service provided is equal or above their expectations. Maister is however not alone nor the first to have this view on service quality. Grönroos (1983) developed the Total Perceived Quality Model that is also based on the interplay between expectation and perception. The same logic is fundamental for SERVQUAL, one of the most successful service quality measurement frameworks (Parasuraman, Zeithaml & Berry, 1988). Often, the reason for pursuing high service quality is customer satisfaction and the resulting positive cash flow. Along with price, service qual-ity can be considered as the only differing factor between competing airlines and thus a de-terminant for competitive advantage and profitability. Therefore this thesis will follow this stream of research and look at service quality, at the most general level, as customer satis-faction resulting from an interplay between perception and expectations.
The SERVQUAL framework identifies five main criterions namely: tangibles, reliability, re-sponsiveness, assurance and empathy. Parasuraman et al. (1988) found that the most im-portant criterion determining the perceived level of service quality by customers, irrespec-tive of industry, is reliability. This is corresponding to the findings by several authors re-searching the European civil aviation industry. One of the most commonly cited reason for customer dissatisfaction is the lack of on-time performance which can be viewed as ab-sence of reliability (Mazzeo, 2003; Bowen & Headley, 2001; Dresner & Xu, 1995). The lack of on-time performance also shows positive correlation with customer complains and bag-gage losses.
In a service quality analysis it is important to distinguish the process element from the out-come element. The process element is the interaction between the service provider and the customer while the outcome element is the actual benefit eventually received by the cus-tomer. The process element is often considered to have higher influences on perceived ser-vice quality (Blanchard & Galloway, 1994). However, considering the findings that reliabil-ity in terms of on-time performance is the most important service qualreliabil-ity determinant, it is reasonable to assume that the outcome element has a larger than average impact on total customer satisfaction in the airline industry. If an airline is chronically late (outcome ele-ment), the service quality before, during and after the flight (process element) will in most cases not be enough to satisfy the customer. Therefore this thesis will mainly focus on the outcome element of the satisfaction process, more specifically on-time performance.
It is important to look at competition, price and service quality in the light of the two dif-ferent business models used by flag and low-cost carriers in order to understand how they influence the three areas under investigation. Understanding the business models may shed
some light on the differences in competition, price and service quality between flag and low-cost carriers and in the industry as a whole.
2.4 Business Models
Wikipedia (2005) defines business model as “the mechanisms by which a business intends to generate revenue and profit.” The hub-and-spoke business model employed by flag car-riers and the point-to-point business model employed by low-cost carcar-riers, are different in terms of how to transport passengers most efficiently which affects the company’s’ phi-losophy about service quality and price. This influences the competitive landscape and therefore the two business models will be presented below.
Figure 2-2. Competing airline business models.
2.4.1 Hub-and-spoke
The majority of established, international airlines known as flag carriers operate according to a very specific business model known as hub-and-spoke. The hub-and-spoke system moves passengers from smaller second-tier “spoke” airports (e.g. Göteborg Landvetter or Berlin Tegel) to a larger hub airport (e.g. Stockholm Arlanda, London Heathrow, or Paris Charles de Gaulle). The hub airport acts like a feeder where all connecting passengers will pass through to eventually get to their destinations. For example, when flying from Göte-borg, Sweden to St Petersburg, Russia on Lufthansa, one will pass, or connect through Luf-thansa’s hub airport at Frankfurt Main, Germany (Lufthansa, 2005).
In general, airlines employing the hub-and-spoke model break-even or take a small loss on at least some of the spoke-to-hub flights, in order to maximize the profits they can create on the lucrative hub-to-hub flights (Doganis, 2001). For example, flying from Göteborg Sweden to New York USA transatlantic on Air France, one will connect through Paris Charles de Gaulle airport. Air France is prepared to make little or no money off the short Göteborg to Paris flight in order to maximize the load factor and profit on the long hub-to-hub flight from Paris to New York. (Air France, 2005). Airlines not only increase the load factor, but also charge a premium on business and first class
on the hub-to-hub routes. On cross-continental and especially on some transatlantic or transpacific routes, higher prices can be implemented by airlines: hence, these routes are disproportionately important to a hub-and-spoke within Europe. This is so because the same higher charges cannot be implemented on flight within Europe which somewhat il-lustrates where flag carriers are both making and loosing money.
Airlines utilizing the hub-and-spoke system are facing strong economic pressure. The costs associated with building a hub-and-spoke system are immense. Different aircraft models, ex-pensive gate and landing rights at hub airports, airport taxes and fees, terminal and office space for both passengers and employees, along with complicated booking systems (Doganis, 2001) create powerful barriers to entry for potential competitors. and make the system less flexible for changing customer demands. This not only makes it expensive for the airline to carry out business, but also makes it expensive for the flying public to purchase tickets and travel (Doganis, 2001).
2.4.2 Point-to-point
A new business model within the airline industry has been emerging around the world in the last two decades. The general public’s desire to travel quickly, efficiently and cheaply gave birth to a new kind of airline: the low-cost carrier. These airlines are built on the “point-to-point” business model which has proven very efficient in an ever more turbulent market (Percy, January 2004). The basic premise behind this model is an attempt to fly shorter distances between secondary airports in under-serviced cities and locations. For ex-ample, Stockholm Skavsta or London Stantead as compared to Stockholm Arlanda or London Heathrow. These airports are far less congested, enabling low-cost carriers to turnaround aircraft much faster than competitors, which allows for more frequent flights, more efficient aircraft usage and most importantly, increased revenue per aircraft seat. This is done by getting more flights per year out of each plane (Percy, January 2004).
Secondary airports bring with them the benefits of lower airport fees and taxes associated with costs for landing, gate slots, operational rights, wages and property rents. Low-cost car-riers can also generate barcar-riers to entry by locking up gate rights at the airports they operate in, thereby keeping particular carriers and competitors out (Percy, January 2004). Airports where low-cost carriers operate are often much smaller than hub airports and as a result, of-fer fewer restaurants, shops and passenger facilities. According to theory behind the point-to-point business model, passengers are supposed to spend less time within the airport as the point-to-point model does not transfer passengers to a hub but directly to their destination. Therefore there is no need to offer the same facilities as on the hub airports. This greatly re-duces the airport costs which airlines and passengers have to pay (Percy, January 2004). Low-cost carriers are often known as “no-frills” airlines. This means that a passenger will receive basic and bare minimum services when traveling from point A to point B (Percy, January 2004). Typical examples of such services are ticketless traveling, less allowable weight with checked luggage, less cabin luggage allowed on-board and little to no meal or entertainment on-board. In the case where food is offered, it is usually done through an a-la-carte menu for various prices which are paid for by the passenger. Entertainment is usu-ally limited to a free in-flight magazine or newspaper with no movies or television pro-grams. Most low-cost carrier flights don’t last long enough to show a full length feature film anyway. This is also cost saving not having to outfit the aircraft with an expensive en-tertainment system (Doganis, 2001).
Another advantage to the low-cost carrier business model is that most low-cost carriers will only operate one type of medium bodied aircraft (Percy, January 2004). For example Europe’s largest low-cost carrier, Ryanair, solely operates a fleet of Boeing B737 aircraft which can hold approximately 190 passengers in a single class configuration and fly a range of 5,425km at a cruising speed of 853km/hr or 0.785 mach (Boeing, 2005). The advantages of operating just one aircraft are reduced maintenance costs coupled with simple, identical training for all pilots and crew. Identical parts and products can be on hand wherever the air-craft flies, making it easier for quick and efficient repairs when needed. This reduces the op-erating expense for the company. Furthermore, fuel costs become easier to predict and thus hedged for when operating just one model of aircraft (Percy, January 2004). Therefore, most costs for a low-cost carrier can be considered fixed and easier to plan for.
Thus far, we have seen distinct differences between these two business models operating in this industry. Both the theoretical framework and business model overview have lead us to an appropriate basis on which to investigate the relations between both competition and price as well as the relation between competition and service quality.
2.5 Research Aspirations
This chapter provides an overview of the appropriate theories concerning the European civil aviation industry in terms of competition, service quality and price. Along with that, descriptions of the different business models employed by flag carriers and low-cost carri-ers were also illustrated. Due to all of this valuable and relevant information, in conjunction with the purpose in mind, we have formulated the following research questions we believe will be helpful in fulfilling our purpose. The following questions will be answered and fur-ther discussed in our analysis and conclusions;
1. What has been the effect of the point-to-point, low-cost carrier business model on this industry? Who is competing against who?
2. What has Porter’s (1979) five forces model helped to tell us about competition in this industry?
3. If a general increase in demand occurs within this industry, what will be the effect on company revenues and expenses for both flag carriers and low-cost carriers?
4. Are low-cost carriers able to outperform flag carriers in terms of cost control? 5. How is service quality defined by both types of carriers? Is there a difference in
what both consider service quality to be?
As a general research question to the entire thesis, we will ask and ponder which of the two business models is proving to be more sustainable over time and why. We believe that the answers and discussions to the above questions will serve our problem and purpose through the analysis and conclusions.
3 Method
__________________________________________________________________________________________________________ This chapter illustrates and explains the method chosen for this thesis. It will describe the type of data used, how the data was collected and the way the study was performed. It is concluded with a brief discussion on the reliability and validity of the study.
__________________________________________________________________________________________________________
3.1 Method Choice
The European civil aviation industry and the relation between competition, price and ser-vice quality in the industry is a complex situation containing many interacting elements. From a management perspective the interest is not any single element on its own, but the interaction and relation between the elements in the current situation’s full complexity. Therefore an integrated research approach as defined by Johns and Lee-Ross (1998) will be used. The authors will use a less structured method to this study, but will still try to take all variables affecting the study into consideration.
In any research, it is imperative to consider what kind of information to gather and how to gather it. There are two main methods of investigating and collecting data, namely qualitative and quantitative. There are several aspects that set these method styles apart and it is there-fore important that the chosen method fits the purpose of the study (Curwin & Slater, 2002). The term quantitative implies an indirect or abstract approach that treats experiences as simi-lar by adding or multiplying them together, or “quantifying” them (Sherman & Webb, 1998). In quantitative research the majority of the data is collected or coded into numbers and not individual comments, reflections, or interpretations (Punch, 1998). A quantitative study relies on sample data representing the population and is usually perceived as a gather-ing of facts (Blaxter, Hughes & Tight, 2001).
Qualitative research on the other hand puts an emphasis on understanding of meanings
rather than measures. Phenomena are not measured in terms of quantity, intensity, or frequency, but understood in terms of their meaning in the world they are observed in. In other words, the qualitative method is applied on non-statistical data that focuses on in-depth understanding with a fairly small number of samples investigated (Befring, 1994). Using an integrative approach allows the authors to combine qualitative and quantitative research techniques to obtain multiple data about the investigated phenomenon. Hence competition is treated using a quantitative approach in both data collection and analysis while price and service quality are investigated using qualitative techniques.
3.2 Data Types
Data used for scientific studies can be classified as either primary or secondary (Hardy, 2004). The term primary is associated with data that is collected first hand by the researchers con-ducting a specific study, or in other words, data collected for a specific purpose. This is usually done through the use of surveys, interviews, experiments and observations that are specifically designed to suit the objectives of a particular research project (Hardy, 2004). Secondary data refers to data that has already been collected for another task. Examples of secondary data include publications like annual reports, journals, academic papers,
disserta-Secondary data is considered more reliable in this study compared to primary data collected by the authors due to the complexity and scope of the research objective. A vain initial at-tempt by the authors is a case-in-point. Additional advantages of using secondary data are saved time, money and effort spent in acquiring it (Hardy, 2004).
Problems associated with secondary data include the difficulty of making sure that the data is accurate, relevant and fits appropriately into the study (Churchill, 1996). Multiple definitions of the same expression are also a potential problem when using different sec-ondary data sources (Saunder, Lewis & Thornhill, 2003). These problems can result in numerous errors in the collection and analysis process as well as influence the results. On way to minimize the risk of the problems mentioned above, was to only collect data from sources considered trustworthy, that published neutral data with no specific observa-tional intent other than illustrating actual events. The main sources include the Swedish Civil Aviation Authority (Luftfartsverket and Luftfartsstyrelsen), the International Air Transport Association (IATA) and the European Organization for the Safety of Air Navi-gation, Eurocontrol. The “multiple definition problem” was addressed by not combining data from separate sources before the analysis.
3.3 Data Collection
The collected data can be separated into theoretical and empirical data. The former will be used as a base for understanding the industry while the latter to empirically investigate the questions spelled out in the purpose.
The theoretical data came from books, journals, newspapers, publications and the Internet. The main goal when researching the theoretical data was to find theories on price, service quality and competition while simultaneously, finding information about the two business models used in the industry in order to acquire an understanding of the industry. Informa-tion soon proved to be in abundance but still presented challenges. The first challenge was to decipher what was relevant to this study and avoid using useless information. After ex-tensive reading and researching it became easier to make appropriate judgments on what was relevant. The second challenge was to place the material in the right context and un-derstand relations between theories, business models and industry events. This required further reading and numerous discussions between the authors.
The empirical data was on price, competition and service quality. The competition data was not hard to obtain, but it was challenging to organize due to the amounts. The data came from the websites of the Swedish Civil Aviation Authority, (Luftfartsverket and Luft-fartsstyrelsen) or through email contacts with employees at the said authorities. The data represented the number of seats per route per week supplied and demanded from all Swed-ish airports between years 2000 and 2004. This time frame incorporates both downward and upward trends in the industry making it less likely for the data to be biased. Data on seats from Arlanda and Skavsta airports was extracted. From these figures quarterly data was derived and the moving average was calculated to clean the data from seasonal pat-terns.
Data on service quality was obtained from the Central Office for Delay Analysis (CODA), a department within the European Organization for Safety of Air Navigation (Eurocontrol). Eurocontrol regularly publishes reports analyzing the air traffic delays in the European Civil Aviation Conference Area. The area includes all countries that are within the geographical boundaries of Europe, with the exception of Turkey that is also
included (Eurocontrol, 2005). Airline websites were also a source for service quality data. Furthermore, articles from The Financial Times and The Economist were extremely helpful in gaining understanding of what was currently occurring within the industry. Obtaining pricing data represented the first major obstacle in this study. Data that was needed was clear from the beginning, however the data was not readily available. Pricing data as well as revenue and expense data was considered confidential in the eyes of the air-line who would therefore, not release such information. Repeated attempts to get data from Lufthansa, KLM, SAS and Air France gave no result. If confidentiality was not the prob-lem, then funding was. After extensive searching, data was found from the International Air Transport Association (IATA) whose website gave a synopsis of a report containing pricing data. The full report could be obtained, however for a hefty fee of $400us.
Repeated phone and email contacts with the association did not make them more willing to give the report away for free despite the character of the research project. After additional research, the report was found in the flight school library of Embry Riddle Aeronautical University in Arizona, United States. With the tremendous help of Ms. Christine Scott along with the trust and assistance of the university, the pricing data needed eventually found its way to JIBS.
Taking into consideration the size and complexity of the European civil aviation industry, the authors will look at price through revenues and expenses for flag carriers in Europe. The pricing data has been collected from the years 2001 and 2002 on an aggregated level for flag carriers operating the hub-and-spoke business models. The flag carrier’s data collected con-cerns only the region of northern Europe. The International Air Transport Association (IATA), includes the following countries in that region: Austria, Belarus, Belgium, Bulgaria, Czech Republic, Denmark (incl. Greenland and Faroe Islands,), Estonia, Finland, France, Germany, Hungary, Iceland, Ireland, Latvia, Liechtenstein, Lithuania, Luxembourg, Moldova, Netherlands, Norway, Poland, Romania, Russia Federation (west of Urals) Slova-kia, Sweden, Switzerland, Ukraine and the United Kingdom.
Ryanair, along with the other low-cost carriers operate in a different business model then that of the flag carriers. Their operations are based on the point-to-point business model, de-scribed in chapter two. Even though there are many low-cost carriers within northern Europe, this study will look at the financial performance of Ryanair due to the fact that it is the largest and most influential low-cost carrier in Europe. We will use the financials of Ry-anair as a proxy to show how low-cost carriers operate in Europe.
3.4 Method Credibility
Alongside of fulfilling the purpose of the study, the authors’ main concern must be to pro-duce credible results. Credibility can be achieved by attempting to maximize the reliability and validity of the study.
3.4.1 Reliability
Reliability refers to how reliable the chosen measuring instrument is. It gives a measure-ment of how resistible the instrumeasure-ment is towards random influences and biased judgmeasure-ments from external factors. In order to achieve the highest level of reliability, a method or ap-proach should be completely independent from the researcher (Eriksson & Widersheim-Paul, 1999). Another researcher employing the same method should, independently from
the authors, be able to replicate the finds. If this is the case the method can be deemed reli-able, just as a scale is considered reliable if it shows the same weight in repeated attempts to measure your weight.
To increase the reliability of the study the authors have used models and definitions de-signed for and used in previous and similar investigations. For instance, the five forces model has been used for the analysis of industry competition and microeconomic theory for the analysis of pricing. The authors have also attempted to increase the reliability of the study by using data from trustworthy sources. Competition data was collected from the government agency Swedish Civil Aviation Authority (Luftfartsverket and Luft-fartsstyrelsen). Price data was collected from the International Air Transport Association (IATA) while service quality data was collected from the European Organization for Safety of Air Navigation (Eurocontrol).
3.4.2 Validity
Eriksson and Widersheim-Paul (1999) define validity as the ability of the measuring in-strument; or theories and models in this case; to measure what they are intended to. Va-lidity is an extremely important service quality of a measuring instrument since it does not matter how well an investigation is performed if the instruments used are unable to measure what they are intended for.
The authors have attempted to increase the conceptual validity (Wallén, 1993) of this study by defining and explaining the most important concepts, namely competition, price and service quality. Other authors have used similar concepts when investigating the airline in-dustry and therefore the authors are confident that these are important concepts increasing the validity of the study.
Svenning (1996) suggests that the validity of a study can be increased if there is a clear con-nection between the theoretical concepts and the empirical research. The authors have used well known and accepted theories to describe and understand competition, price and ser-vice quality. The empirical results have been interpreted in the light of those theories and thus, the authors believe higher validity has been achieved.
3.5 Method Limitations
The integration of the different research techniques raises questions about academic rigor (Johns & Lee-Ross, 1998). The qualitative phenomenological approach is very different from the hypothetico-deductive quantitative approach. But management studies often require a broader problem definition compared to pure scientific studies where a hypothesis can be tested on a narrowly defined problem. Therefore a decrease in the academic rigor can be jus-tified for an increase in scope (Johns & Lee-Ross, 1998).
Generalizations of the findings to other industries will not be attempted. This would re-quire a pure scientific study using one method, one world view and a completely different research focus.
Flag carriers and low-cost carriers will, in this study, be treated as companies offering the same basic product, namely similar flights between the same city areas. For example, a flight on Air France from Stockholm Arlanda to Paris Charles de Gaulle and a flight on Ryanair from Stockholm Skavsta to Paris Beauvais is, for simplification, considered to be the same basic product. Specific aspects such as ticketing regulations and rules will be
omit-ted. Business and first class offerings by flag carriers will also be omitted, wherever possi-ble. Low-cost carriers typically operate a one class (economy) configuration in all aircraft. The inclusion of business and first class offerings would unfairly influence the study, not only in terms of fares paid, but also in terms of the services and service quality offered. The very simplified assumption will be made, that people who traveled on flag carriers before the emergence of low-cost carriers were mostly concerned with getting from point A to B. The use of Ryanair as the proxy for other low-cost carriers is done under the risk that the performance of Ryanair is not representative of that of other low-cost carriers. Ryanair might in theory be a “random error” not reflecting the true nature of low-cost carriers. However, the financial success of Southwest Airlines, considered the first low-cost carrier in the world and the stark growth in the number of low-cost carrier operating in Europe suggests otherwise. Economic theory (Parkin et al., 2000) proposes that a successful in-dustry will attract new companies and therefore this thesis works under the assumption that Ryanair and its success is not a random error.
4 Empirical Findings and Analysis
__________________________________________________________________________________________________________ This chapter presents the empirical findings and relates them to the theories presented in previous chapters. The findings are presented together with an analysis of the relation between competition and price as well as competition and service quality.
__________________________________________________________________________________________________________
4.1 Competition
Investigating the airline industry through the five-force model reveals dramatic changes in the last decade. Prior to the 1997 deregulation, there where very few or no potential en-trants as governments controlled who could operate an airline, from where and under what conditions. Buyer power (customer’s power) was weak as travel agents controlled all flight information and only national flag carrier offered the service. As the industry concentration ratio was very high, there was no rivalry to talk about.
The deregulation completed in 1997 and the public advent of the Internet around 1995, completely changed the competitive landscape of the airline industry. Slowly but surely, the barriers to entry in the form of government regulation vanished and a flood of new entrants began to set up business. Switching cost disappeared as several carriers started to offer flights to the same destination. The previous protective regulations that de facto made it impossible to buy a one-way ticket with one airline and another one-way ticket with another airline disappeared, creating even more rivalry both among the old and be-tween the old and the new players in the industry (Figure 4-1).
Figure 4-1. “Goodbye Lufthansa” Anecdotal evidence of the increased rivalry.
Many of the new airlines are operating using a new business model effectively challenging the old way of doing business. This has profound effects on the industry as the new play-ers can offer lower fare prices which drives down the profitability of airlines using the hub-and-spoke business model. High fixed cost and task specific assets such as airplanes creates large exit barriers, forcing the old airlines to compete in an industry with profit level below what is sustainable given the hub-and-spoke business model.
The amount of information customers can get through the internet increased their negoti-ating power. Customers can instantly compare ticket prices between airlines and choose the service that fits their needs. The attempt by the airlines to increase switching costs for con-sumers by introducing frequent-flyer miles has until now been quite successful at retaining customers. It has actually been so successful that the value of all unredeemed frequent flyer miles is greater that the value of all dollar bills in circulation, effectively making frequent flyer miles the worlds largest currency (Economist, 2005-01-06). However, the low prices
offered by low-cost carriers are making it increasingly more difficult for the flag carriers to compete with even the best frequent-flyer program.
Looking at cabin crew and pilots as the suppliers for the airline business, the low-cost car-riers have managed to decrease the supplier power by managing to keep cabin crew and pi-lots away from trade unions. This has made it possible for the low-cost carriers to pay them less compared to their flag carrier colleagues while at the same time, working more. How-ever pilots, cabin crew and baggage handlers at flag carrier airlines have, through their trade unions, resisted the necessary structural change leading to an even more difficult competi-tive position. The new way of thinking about government bail-outs has put additional pres-sure on the established airlines, as the bankruptcy of Swiss Air in 2001 proved.
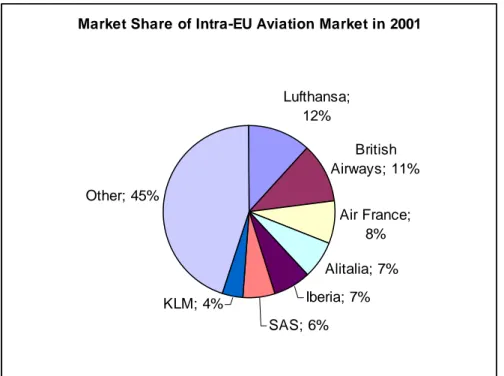
Market Share of Intra-EU Aviation Market in 2001
Lufthansa; 12% British Airways; 11% Air France; 8% Alitalia; 7% Iberia; 7% SAS; 6% KLM; 4% Other; 45%
Figure 4-2. Market shares of intra-EU air travel (Jacob & Jakešová, 2003).
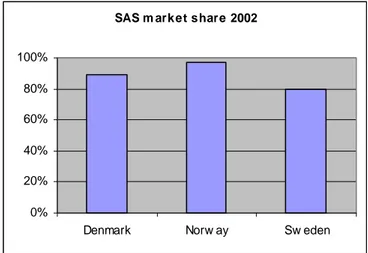
Data from 2001 shows that the four largest airlines in Europe only control 38% of the in-tra-EU market share suggesting low industry concentration and thus high rivalry. What is not reflected in Figure 4-2 is the fact that most airlines are regionally very dominant. Figure 4-3 shows that SAS for instance in 2002 reached a domestic market share of 80% in Sweden, 89% in Denmark and 97% in Norway (Jacob & Jakešová, 2003).
SAS m ark et share 2002 0% 20% 40% 60% 80% 100%
Denmark Norw ay Sw eden
Figure 4-3. SAS market share 2002 (Jacob & Jakešová, 2003).
But this domination is now under attack. Swedish Civil Aviation Authority showed in re-cent news that 10% of passengers departing from Arlanda airport choose low-cost carriers. What we are witnessing is only the beginning of a massive industry transformation. In 1998 flag carriers accounted for 75% of all European air travel while low-cost carriers accounted for 2%. In 2001 the flag carriers accounted for 72% while low-cost carriers managed to achieve a 7% market share (Figure 4-4). This occurred during a time when total passenger travel in Europe increased by 19% between 1998 and 2001 (Riley, 2003). Clearly, competi-tion in the airline industry has increased dramatically in the last decade.
Market share in European air travel
0% 10% 20% 30% 40% 50% 60% 70% 80% FC LCC 1998 2001
Figure 4-4. Market share in European air travel (Riley, 2003).
4.1.1 Supply and demand of seats
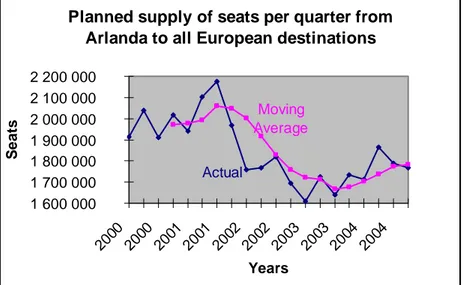
Based on data presented by the Swedish Civil Aviation Authority (Luftfartsverket and Luft-fartsstyrelsen) the authors have derived the projected supply of seats, actual demand and spread between the two considering all European destinations from Arlanda airport and
Skavsta airport (see Appendix). Arlanda is the preferred airport for all flag carriers flying to and from Sweden while Skavsta airport is the primary location for low-cost carriers operat-ing in the Stockholm area, especially Ryanair.
Due to the fact that travel data contains strong seasonal variation with a peak in the second quarter and a low in the first, the authors have taken the weighted average of sixteen quar-ters of data to identify the trend line. Looking on the trend line for the supply of seats from Arlanda airport and considering the possible impact of September 11th on the industry, it is
not surprising to see a slow growth until the 3rd quarter in 2001 followed by a strong drop
until the 3rd quarter 2003. The cumulative fall of seat supply was more then 25% in that
two year period. Since the 3rd quarter 2003 there has been a small growth of around 2% per
year on the supply side. If one compares the 4th quarter 2000 with the 4th quarter 2004 there
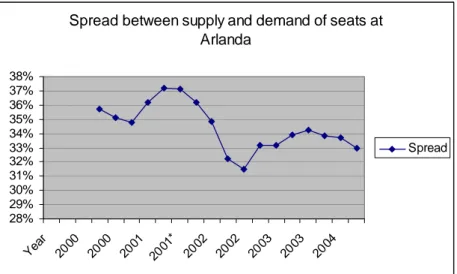
has been a 10% drop in the supply (Figure 4-5). This drop can actually be considered bene-ficial for the flag carriers as the spread between the demand and supply of seats is decreas-ing, effectively increasing the load factor for the airlines and in theory the profitability (Figure 4-7).
Planned supply of seats per quarter from Arlanda to all European destinations
Actual Moving Average 1 600 000 1 700 000 1 800 000 1 900 000 2 000 000 2 100 000 2 200 000 200 0 2000 2001 2001 200 2 200 2 2003 2003 2004 200 4 Years S eats
Figure 4-5. Arlanda seat supply (Luftfartsstyrelsen, 2005).
Looking at the demand side the picture is less volatile, but follows the same pattern. There is a slight growth until the 3rd quarter 2001 followed by a decrease in demand until the 4th quarter 2003 where the trend goes back to the slow growth. Between 4th quarter 2000 and 4th quarter 2004 the total drop in demand is 5.7% (Figure 4-6). The total number of pas-sengers traveling by air in Europe grew by 1.4% between 2000 and 2003 (Datamonitor, November 2004). Hence the demand at Arlanda is dropping at a slowly growing market. Part of the drop might be explained by the exceptional growth at Skavsta airport.