This is the published version of a paper published in The Lancet.
Citation for the original published paper (version of record):
Griswald, M G., Fullman, N., Hawley, C., Arian, N., Zimsen, S R. et al. (2018)
Alcohol use and burden for 195 countries and territories, 1990-2016: a systematic
analysis for the Global Burden of Disease Study 2016
The Lancet, 392(10152): 1015-1035
https://doi.org/10.1016/S0140-6736(18)31310-2
Access to the published version may require subscription.
N.B. When citing this work, cite the original published paper.
Permanent link to this version:
Alcohol use and burden for 195 countries and territories,
1990–2016: a systematic analysis for the Global Burden of
Disease Study 2016
GBD 2016 Alcohol Collaborators*
Summary
Background
Alcohol use is a leading risk factor for death and disability, but its overall association with health remains
complex given the possible protective effects of moderate alcohol consumption on some conditions. With our
comprehensive approach to health accounting within the Global Burden of Diseases, Injuries, and Risk Factors Study
2016, we generated improved estimates of alcohol use and alcohol-attributable deaths and disability-adjusted
life-years (DALYs) for 195 locations from 1990 to 2016, for both sexes and for 5-year age groups between the ages of
15 years and 95 years and older.
Methods
Using 694 data sources of individual and population-level alcohol consumption, along with 592 prospective
and retrospective studies on the risk of alcohol use, we produced estimates of the prevalence of current drinking,
abstention, the distribution of alcohol consumption among current drinkers in standard drinks daily (defined as 10 g
of pure ethyl alcohol), and alcohol-attributable deaths and DALYs. We made several methodological improvements
compared with previous estimates: first, we adjusted alcohol sales estimates to take into account tourist and
unrecorded consumption; second, we did a new meta-analysis of relative risks for 23 health outcomes associated with
alcohol use; and third, we developed a new method to quantify the level of alcohol consumption that minimises the
overall risk to individual health.
Findings
Globally, alcohol use was the seventh leading risk factor for both deaths and DALYs in 2016, accounting for
2·2% (95% uncertainty interval [UI] 1·5–3·0) of standardised female deaths and 6·8% (5·8–8·0) of
age-standardised male deaths. Among the population aged 15–49 years, alcohol use was the leading risk factor globally in
2016, with 3·8% (95% UI 3·2–4·3) of female deaths and 12·2% (10·8–13·6) of male deaths attributable to alcohol
use. For the population aged 15–49 years, female attributable DALYs were 2·3% (95% UI 2·0–2·6) and male
attributable DALYs were 8·9% (7·8–9·9). The three leading causes of attributable deaths in this age group were
tuberculosis (1·4% [95% UI 1·0–1·7] of total deaths), road injuries (1·2% [0·7–1·9]), and self-harm (1·1% [0·6–1·5]).
For populations aged 50 years and older, cancers accounted for a large proportion of total alcohol-attributable deaths
in 2016, constituting 27·1% (95% UI 21·2–33·3) of total alcohol-attributable female deaths and 18·9% (15·3–22·6) of
male deaths. The level of alcohol consumption that minimised harm across health outcomes was zero (95% UI 0·0–0·8)
standard drinks per week.
Interpretation
Alcohol use is a leading risk factor for global disease burden and causes substantial health loss. We
found that the risk of all-cause mortality, and of cancers specifically, rises with increasing levels of consumption, and
the level of consumption that minimises health loss is zero. These results suggest that alcohol control policies might
need to be revised worldwide, refocusing on efforts to lower overall population-level consumption.
Funding
Bill & Melinda Gates Foundation.
Copyright
© 2018 The Author(s). Published by Elsevier Ltd. This is an Open Access article under the CC BY 4.0
license.
Introduction
Alcohol use has a complex association with health.
Researchers have recognised alcohol use as a leading risk
factor for disease burden, and studies link its consumption
to 60 acute and chronic diseases.
1–3Additionally, some
research suggests that low levels of alcohol consumption
can have a protective effect on ischaemic heart disease,
diabetes, and several other outcomes.
4–6This finding
remains an open question, and recent studies have
challenged this view by use of mendelian randomisation
and meta-analyses.
7–10Determination of harm due to alcohol use is
com-plicated further by the multiple mechanisms through
which alcohol use affects health: through cumulative
consumption leading to adverse effects on organs and
tissues; by acute intoxication leading to injuries or
poisoning; and by dependent drinking leading to
impairments and potentially self-harm or violence. These
effects are also influenced by an individual’s consumption
volume and pattern of drinking.
2Measuring the health
effects of alcohol use requires careful consideration of all
these factors.
Lancet 2018; 392: 1015–35 Published Online August 23, 2018 http://dx.doi.org/10.1016/ S0140-6736(18)31310-2This online publication has been corrected. The corrected version first appeared at thelancet.com on September 27, 2018
See Comment page 987 *Collaborators listed at the end of the Article
Correspondence to: Prof Emmanuela Gakidou, Institute for Health Metrics and Evaluation, University of Washington, Seattle, WA 98121, USA
Several studies have attempted to address these factors
to provide global estimates of alcohol consumption and
its associated health effects. The most comprehensive
among these studies have been WHO’s Global Status
Report on Alcohol and Health, as well as previous
iterations of the Global Burden of Diseases, Injuries, and
Risk Factors Study (GBD).
11–13The present study aims to
build upon pre-existing work and to address several
limitations found in earlier research.
First, the available studies have assessed the risk of
alcohol use by relying on external meta-analyses, which
do not control for confounding in the selection of
the reference category within constituent studies. This
approach is problematic because of the so-called sick
quitter hypothesis, which emphasises the importance of
reference category selection in correctly assessing risk
among drinkers, along with other confounding study
characteristics such as survival bias.
8,14–17Until recently,
most meta-analyses of alcohol consumption have not
controlled for the composition of the reference category.
Subsequently, assessments of harm relying on these
studies have been biased. We sought to resolve this issue
within our meta-analyses by including controls for
different reference categories and the average age of
participants.
Second, previous studies have used sales data to estimate
population-level alcohol stock. Researchers have noted the
benefit of using sales data instead of survey data for
quantifying alcohol stock available within a location.
18,19However, sales data still have bias because of consumption
by tourists and unrecorded consumption from illicit sales,
home brewing, and local beverages. Without correction for
these factors, estimates relying on sales data can be biased
and lead to inaccurate cross-national comparisons. In the
current study, we adjusted the estimates of
population-level alcohol stock to account for the effects of tourism and
unrecorded consumption.
Third, previous studies have assumed zero as the
counterfactual exposure level that minimises harm. Within
a comparative risk assessment approach, a counterfactual
level of consumption that minimises harm is required
to estimate population attributable fractions (PAFs).
1However, this counterfactual level needs to be estimated,
rather than assumed, given the complexities involved in
estimating the risk of alcohol use across outcomes. Relying
on this assumption can fail to capture any potential
non-linear effects between alcohol use and health. Our study
proposes a new method for the use of available evidence to
establish a counterfactual level of exposure across varied
relative risks, which provides tangible evidence for low-risk
drinking recommendations.
In the present study, we aimed to address these
limita-tions and provide the best available estimates of alcohol
use and the associated health burden. We estimated the
Research in context
Evidence before this study
Although researchers recognise alcohol use as a leading risk
factor for premature death and disability, some evidence
suggests that low intake might have a protective effect on
specific conditions such as ischaemic heart disease and diabetes.
Monitoring of consumption behaviour is required to analyse the
health effects of alcohol use. Historically, researchers have relied
on self-reported survey data to estimate consumption levels
and trends. However, these data have systematic biases that
make cross-country comparisons unreliable. The Global Status
Report on Alcohol and Health, as well as previous iterations of
the Global Burden of Diseases, Injuries, and Risk Factors Study,
have sought to produce harmonised, cross-country comparisons
of alcohol consumption and its harms, by leveraging data on
alcohol sales, the prevalence of current drinking and abstention,
and self-reports of consumption amounts.
Added value of this study
In this analysis we improved available estimates of alcohol use and
its associated health burden in five ways. First, we consolidated
694 individual and population-level data sources to estimate
alcohol consumption levels among current drinkers. Second, we
developed a method to adjust population-level consumption for
alcohol consumed by tourists. Third, we improved pre-existing
methods that account for unrecorded population-level
consumption. Fourth, we did a new systematic review and
meta-analysis of alcohol use and 23 associated health outcomes,
which we used to estimate new dose–response curves of relative
risk. Fifth, using the new relative risk curves and a new analytical
method, we estimated the exposure of alcohol consumption
that minimises an individual’s total attributable risk.
Implications of all the available evidence
The total attributable burden of alcohol use was larger than
previous evidence has indicated and increases monotonically
with consumption. Based on weighted relative risk curves for
each health outcome associated with alcohol use, the level of
consumption that minimises health loss due to alcohol use is
zero. These findings strongly suggest that alcohol control
policies should aim to reduce total population-level
consumption. To potentially reduce the effects of alcohol use
on future health loss, there is a need for countries to revisit
their alcohol control policies and assess how they can be
modified to further lower population-level consumption.
Figure 1: Age-standardised prevalence of current drinking for females (A) and males (B) in 2016, in 195 locations Current drinkers are defined as individuals who reported having consumed alcohol within the past 12 months. ATG=Antigua and Barbuda. VCT=Saint Vincent and the Grenadines. Isl=Islands. FSM=Federated States of Micronesia. LCA=Saint Lucia. TTO=Trinidad and Tobago. TLS=Timor-Leste.
A
Persian Gulf
The Caribbean LCA
Dominica ATG TTO Grenada VCT TLS Maldives Barbados Seychelles Mauritius Comoros
West Africa Eastern Mediterranean
Malta
Singapore Balkan Peninsula Tonga
Samoa FSM Fiji Solomon Isl Marshall Isl Vanuatu Kiribati Persian Gulf
The Caribbean LCA
Dominica ATG TTO Grenada VCT TLS Maldives Barbados Seychelles Mauritius Comoros
West Africa Eastern Mediterranean
Malta
Singapore Balkan Peninsula Tonga
Samoa FSM Fiji Solomon Isl Marshall Isl Vanuatu Kiribati 0–19·9 20·0–39·9 40·0–59·9 60·0–79·9 80·0–100·0
Current drinker prevalence (%) Females
B
Males 0–19·9 20·0–39·9 40·0–59·9 60·0–79·9 80·0–100·0A
B
Persian Gulf
The Caribbean LCA
Dominica ATG TTO Grenada VCT TLS Maldives Barbados Seychelles Mauritius Comoros
West Africa Eastern Mediterranean
Malta
Singapore Balkan Peninsula Tonga
Samoa FSM Fiji Solomon Isl Marshall Isl Vanuatu Kiribati Persian Gulf
The Caribbean LCA
Dominica ATG TTO Grenada VCT TLS Maldives Barbados Seychelles Mauritius Comoros
West Africa Eastern Mediterranean
Malta
Singapore Balkan Peninsula Tonga
Samoa FSM Fiji Solomon Isl Marshall Isl Vanuatu Kiribati Females Males <1·00 1·01–2·00 2·01–3·00
Population average of standard drinks daily
3·01–4·00 4·01–5·00 >5·00 <1·00 1·01–2·00 2·01–3·00
Population average of standard drinks daily
3·01–4·00 4·01–5·00 >5·00
prevalence of current drinking (having one or more
drinks in the past year); abstention from alcohol (having
no alcohol in the past year); the distribution of alcohol
consumption among current drinkers in standard drinks
daily; and the disease burden attributable to alcohol use,
in terms of deaths and disability-adjusted life-years
(DALYs). We produced these estimates for 195 locations
from 1990 to 2016, for both sexes and for 5-year age
groups between the ages of 15 years and 95 years and
older. We also did a new meta-analysis to assess the dose–
response risk of alcohol consumption for 23 outcomes.
Lastly, we estimated the level of alcohol consumption that
minimises an individual’s total attributable risk of any
health loss.
Methods
Study design
This study follows the comparative risk assessment
framework developed in previous iterations of GBD.
20In
the following sections, we summarise our methods and
briefly present innovations. A full explanation is available
in appendix 1. This study fully adheres to the Guidelines
for Accurate and Transparent Health Estimates Reporting
(GATHER) statement.
21We estimated alcohol use exposure as grams of pure
ethanol consumed daily by current drinkers (which we
present here in terms of standard drinks daily, defined as
10 g of pure ethyl alcohol). We estimated relative risks by
dose in grams of pure ethyl alcohol, for each included
risk–outcome pair. We ascertained which cause and
injury outcomes to include by reviewing prospective and
observational studies of alcohol use, and then assessing
the causal association using Bradford-Hill’s criteria for
causation.
22We included 23 outcomes, and the full list of
risk–outcome pairs, as well as the corresponding data
sources, are provided in appendix 1 (pp 52–140).
Data sources
We found sources that included indicators of current
drinking prevalence and alcohol consumed in grams per
day using the Global Health Data Exchange
(GHDx) and
PubMed.
23For the meta-analysis, we searched PubMed,
the GHDx, and references of previously published
meta-analyses. For our exposure estimates, we extracted
121 029 data points from 694 sources across all exposure
indicators. For our relative risk estimates, we extracted
3992 relative risk estimates across 592 studies. These
relative risk estimates corresponded to a combined study
population of 28 million individuals and 649 000 registered
cases of respective outcomes. We list all the included data
sources in appendix 1 (pp 52–140).
To estimate standard drinks consumed daily by current
drinkers, we followed the general approach used by Rehm
and colleagues.
18We briefly explain this method here,
along with two methodological innovations to account
for bias in the sales model: an adjustment to account for
tourist consumption and an updated adjustment for
unrecorded consumption. A full explanation of this
approach is available in appendix 1 (pp 18–49).
To estimate exposure, we combined estimates of
population-level alcohol stock and individual-level alcohol
consumption to produce standard drinks consumed daily
among current drinkers and current drinker prevalence,
within a specific location, year, age group, and sex. We
started by estimating population-level alcohol stock in litres
per capita from sales data, individual-level estimates of the
prevalence of current drinkers and abstainers from survey
data, and individual-level estimates of the amount of
alcohol consumed in grams per day from survey data.
Then, for a given location and year, we rescaled age-specific
and sex-specific estimates of individual-level consumption
so that they aggregated to the estimates of population-level
consumption. When surveys reported amount consumed
in terms of beverage types, we converted these data into
grams of pure ethanol using density equations and
assumptions of the average alcohol content by drink type
(appendix 1, p 50). Finally, we rescaled estimates of current
drinking and abstention so that, within a given location,
year, age group, and sex, the two estimates summed to one.
After we derived our model of population-level alcohol
stock from sales data, we controlled for sources of bias
that could arise from tourism and unrecorded
con-sumption not recorded in formal sales. To account for
tourist consumption, we computed an additive measure
for alcohol consumed abroad by domestic citizens and
subtractive measures for alcohol consumed domestically
by tourists. We extracted data on the number of tourists
by country of origin and destination from the World
Tourism Organization and used these data to obtain
estimates of total tourists, percentage of tourists by
location, and average duration of stay using a
spatio-temporal Gaussian process regression.
24We combined
these estimates with measures of alcohol in litres per
capita by location, to calculate net amounts of total
population-level alcohol stock consumed by tourists or
domestic citizens travelling abroad.
To account for alcohol stock not captured within formal
alcohol sales data (ie, unrecorded consumption from
illicit production, home brewing, local beverages, or
alcohol sold as a non-alcohol product), we collated
estimates across published studies of the percentage of
total alcohol stock due to unrecorded consumption. We
sampled 1000 times from a uniform distribution with a
range between zero and the average of these collated
studies by location (sampling from the uncertainty
interval from each study, then averaging the draws) to
Figure 2: Average standard drinks (10 g of pure ethanol per serving) consumed per day, age-standardised, for females (A) and males (B) in 2016, in 195 locations
ATG=Antigua and Barbuda. VCT=Saint Vincent and the Grenadines. Isl=Islands. FSM=Federated States of Micronesia. LCA=Saint Lucia. TTO=Trinidad and Tobago. TLS=Timor-Leste.
See Online for appendix 1
For more on the Global Health
Data Exchange see http://ghdx.
generate a conservative estimate of the total stock likely
to be unrecorded. We used a conservative approach
because of the wide heterogeneity in both the methods
and estimates within included data sources. We provide
estimates of these percentages in appendix 1 (pp 46–49).
Systematic review and meta-analysis
We did a new systematic review for each associated
outcome to incorporate new findings on risk and to
improve upon existing approaches. This strategy allowed
us to systematically control for reference category
con-founding in constituent studies across associated
out-comes. We provide the search strategy, search diagrams,
dose–response curves for each included outcome, and
references for each outcome in appendix 1 (pp 57–146).
Drawing from our systematic review, we did a
meta-analysis of risk outcomes for alcohol use. For each
outcome, we estimated the dose–response relative risk
curve using mixed-effects logistic regression with
non-linear splines for doses between 0 and 12·5 standard
drinks daily. We selected 12·5 standard drinks daily as a
cutoff point given the absence of available data beyond
this range. We present additional details of the model in
appendix 1 (pp 51–138). We tested the significance of
including a study-level confounding variable on the
composition of the reference category (eg, whether former
drinkers were included in the abstainer category or not).
When found to be significant, this variable was included
as a predictor within the model, which was the case for
ischaemic heart disease, ischaemic stroke, and diabetes.
Using our dose–response curves, we estimated the
consumption level that minimises harm, which is
defined in the comparative risk assessment approach as
the theoretical minimum risk exposure level (TMREL).
We chose a theoretical minimum on the basis of a
weighted average relative risk curve across all attributable
outcomes. We constructed weights for each risk outcome
based on the respective global, age-standardised DALY
rate per 100 000 in 2016 for both sexes. Our TMREL was
the minimum of this weighted all-attributable outcome
dose–response curve.
Attributable burden due to alcohol use
We calculated PAFs using our estimates of exposure,
relative risks, and TMREL, following the same approach
taken within the GBD studies.
20For alcohol-use disorders,
which are by definition fully attributable, we assumed a
PAF of 1.
24Following this calculation, we multiplied PAFs
by outcome-specific estimates of deaths and DALYs and
summed these across outcomes to calculate the total
attributable burden in specific locations. We aggregated
both exposure and burden results at the global level and
have presented them by quintile of the Socio-demographic
Index (SDI). SDI is a summary measure of overall
development, based on educational attainment, fertility,
and income per capita within a location. Locations
categorised by SDI quintile are found in appendix 1
(pp 8–12).
25We also constructed age-standardised values
of all estimates, using the same age weights as those used
in the GBD standard population.
We made one adjustment to road injury PAFs to estimate
how much burden occurred to others because of alcohol
use by another individual. We based this adjustment on
data from the US Fatality Analysis Reporting System
(FARS), which includes the average number of deaths in
automobile accidents involving alcohol and the percentage
of those deaths distributed by age and sex. We multiplied
age-specific and sex-specific alcohol-attributable and
road-injury-attributable DALYs by the average number of
fatalities, given the driver’s age and sex. We then
re-distributed these attributable DALYs according to the
FARS-derived probabilities that a population by age and
sex would be involved in a road injury, given the exposed
driver’s age and sex. Because of data availability, we
assumed that locations outside the USA would follow a
similar pattern to what we estimated with FARS. After
redistributing the attributable DALYs, we derived PAFs
again by dividing the redistributed attributable DALYs by
total DALYs within specific demographics.
Uncertainty analysis
For all steps, we calculated uncertainty for estimation
of exposure, attributable deaths, and DALYs by taking
1000 draws from the data’s uncertainty due to sampling
error and modelling uncertainty arising from
hyper-parameter selection and hyper-parameter estimation. We
then used these draws throughout the entire modelling
process. When reporting uncertainty intervals, we
present the 2·5th and 97·5th percentiles of the draws.
Role of the funding source
The funders of the study had no role in study design,
data collection, data analysis, data interpretation, or
writing of the report. The corresponding author had full
access to all the data in the study and had final
responsibility for the decision to submit for publication.
Results
Global, regional, and national trends in alcohol
consumption
In 2016, 32·5% (95% uncertainty interval [UI] 30·0–35·2)
of people globally were current drinkers. 25% (95% UI
23–27) of females were current drinkers, as were
39% (36–43) of males (appendix 2). These percentages
corresponded to 2·4 billion (95% UI 2·2–2·6) people
globally who were current drinkers, with 1·5 billion
(1·4–1·6) male current drinkers and 0·9 billion (0·8–1·0)
female current drinkers (appendix 2, pp 2–1994). Globally,
the mean amount of alcohol consumed was 0·73 (95% UI
0·68–0·78) standard drinks daily for females and
1·7 (1·5–1·9) standard drinks daily for males.
The prevalence of current drinking varied considerably
by location (figure 1). Prevalence was highest for high
SDI locations, where 72% (95% UI 69–75) of females and
For more on the US Fatality
Analysis Reporting System see
https://www.nhtsa.gov/research- data/fatality-analysis-reporting-system-fars
–2000 15–1920–2425–2930–3435–3940–4445–4950–5455–5960–6465–6970–7475–7980–8485–8990–94≥95 15–1920–2425–2930–3435–3940–4445–4950–5455–5960–6465–6970–7475–7980–8485–8990–94≥95 15–1920–2425–2930–3435–3940–4445–4950–5455–5960–6465–6970–7475–7980–8485–8990–94≥95 15–1920–2425–2930–3435–3940–4445–4950–5455–5960–6465–6970–7475–7980–8485–8990–94≥95 15–1920–2425–2930–3435–3940–4445–4950–5455–5960–6465–6970–7475–7980–8485–8990–94≥95 15–1920–2425–2930–3435–3940–4445–4950–5455–5960–6465–6970–7475–7980–8485–8990–94≥95 Attributable D AL Y rate (per 100 000) 0 2000
Global High SDI High-to-middle SDI
–2000 Attributable D AL Y rate (per 100 000) 0 2000
Age group (years) Age group (years) Age group (years) Middle SDI Low-to-middle SDI Low SDI
A
FemalesBreast cancer Colon and rectum cancer Lip and oral cavity cancer Pharynx and nasopharynx cancer Ischaemic heart disease
Ischaemic stroke Haemorrhagic stroke Hypertensive heart disease Atrial fibrillation and flutter Cirrhosis and other chronic liver diseases
Pancreatitis Epilepsy Alcohol use disorders Diabetes Transport injuries Unintentional injuries Self harm Interpersonal violence Cause Tuberculosis
Lower respiratory infections Oesophageal cancer Liver cancer Larynx cancer
2500 15–1920–2425–2930–3435–3940–4445–4950–5455–5960–6465–6970–7475–7980–8485–8990–94≥95 15–1920–2425–2930–3435–3940–4445–4950–5455–5960–6465–6970–7475–7980–8485–8990–94≥95 15–1920–2425–2930–3435–3940–4445–4950–5455–5960–6465–6970–7475–7980–8485–8990–94≥95 15–1920–2425–2930–3435–3940–4445–4950–5455–5960–6465–6970–7475–7980–8485–8990–94≥95 15–1920–2425–2930–3435–3940–4445–4950–5455–5960–6465–6970–7475–7980–8485–8990–94≥95 15–1920–2425–2930–3435–3940–4445–4950–5455–5960–6465–6970–7475–7980–8485–8990–94≥95 Attributable D AL Y rate (per 100 000) 0 5000 7500 7500
Global High SDI High-to-middle SDI
Attributable D AL Y rate (per 100 000) 0 5000
Age group (years) 2500
Age group (years) Age group (years) Middle SDI Low-to-middle SDI Low SDI
B
MalesBreast cancer Colon and rectum cancer Lip and oral cavity cancer Pharynx and nasopharynx cancer Ischaemic heart disease
Ischaemic stroke Haemorrhagic stroke Hypertensive heart disease Atrial fibrillation and flutter Cirrhosis and other chronic liver diseases
Pancreatitis Epilepsy Alcohol use disorders Diabetes Transport injuries Unintentional injuries Self harm Interpersonal violence Cause Tuberculosis
Lower respiratory infections Oesophageal cancer Liver cancer Larynx cancer
83% (80–85) of males were current drinkers (locations
com prising each SDI quintile are provided in appendix 2,
pp 8–12). Drinking prevalence was lowest in
low-to-middle SDI locations, where 8·9% (95% UI 6·6–9·7) of
females and 20% (17–22) of males were current drinkers.
Across SDI quintiles, females consumed less alcohol
than males, with the size of this disparity decreasing with
higher levels of SDI. For example, we found large
differences between females and males in Nepal, with
only 1·5% (95% UI 1·2–1·9) of females being current
drinkers in 2016, compared with 21% (17–25) of males.
Conversely, many high SDI locations had similar
prevalence between sexes. For example, we found
minimal differences in Sweden, where 86% (95% UI
84–88) of females and 87% (85–89) of males were current
drinkers.
The population average of standard drinks consumed
daily among current drinkers in 2016 also differed widely
by location and sex (figure 2). High SDI locations had
the highest average of standard drinks consumed daily,
with 1·9 (95% UI 1·3–2·7) standard drinks consumed
daily among females and 2·9 (2·0–4·1) among males.
Low SDI locations had the smallest average for males,
with 1·4 (0·6–2·4) standard drinks consumed daily,
while low-to-middle SDI locations had the lowest average
for females, with 0·3 (0·1–0·6) standard drinks
consumed daily.
Global patterns in alcohol-attributable deaths and
disease burden
In 2016, 2·8 million deaths (95% UI 2·4–3·3) were
attributed to alcohol use. This corresponds to 2·2%
(95% UI 1·5–3·0) of total age-standardised deaths among
females and 6·8% (5·8–8·0) among males. In terms of
overall disease burden, alcohol use led to 1·6% (95% UI
1·4–2·0) of total DALYs globally in 2016 among females
and 6·0% (5·4–6·7) among males. Globally, alcohol use
was ranked as the seventh leading risk factor for
premature death and disability in 2016, compared with
other risk factors in the GBD studies. Among the
population aged 15–49 years, alcohol use was the leading
global risk factor for risk-attributable disease burden,
causing 8·9% (95% UI 7·8–9·9) of attributable DALYs for
men and 2·3% (2·0–2·6) for women. Among the
population aged 15–49 years, 3·8% (95% UI 3·2–4·3) of
female deaths and 12·2% (10·8–13·6) of male deaths
were attributable to alcohol use.
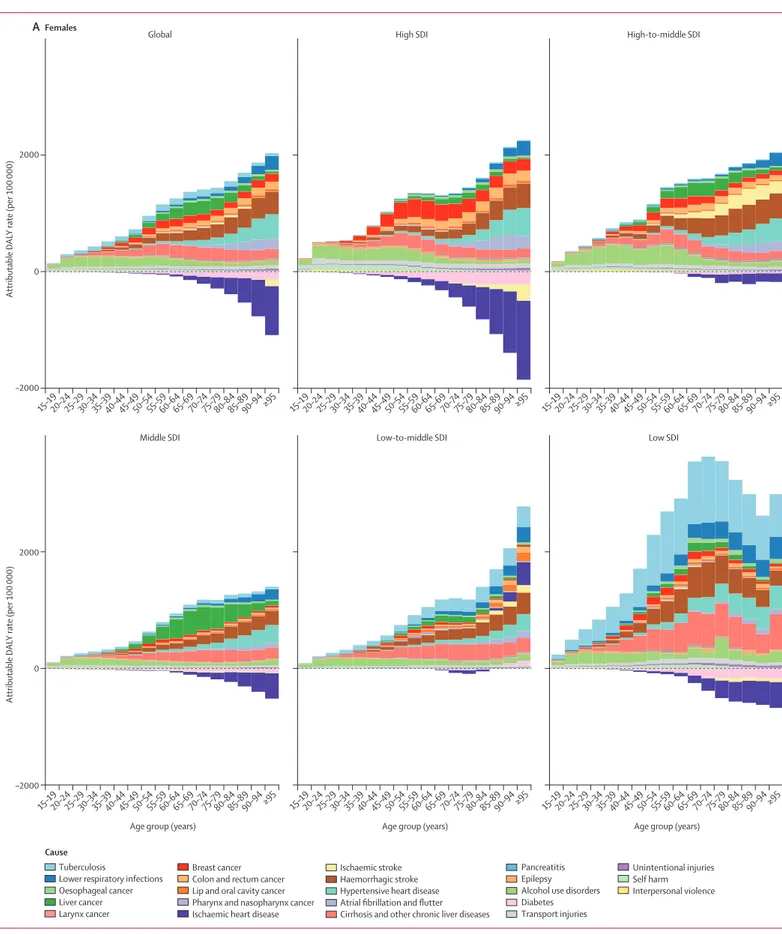
Both total burden attributable to alcohol use and the
proportion of causes associated with alcohol use varied
by sex, age, and SDI quintile (figure 3; appendix 2,
pp 1997–2186). In absolute terms, the alcohol-attributable
burden by age was smaller for females than for males
(figure 3). For females, the alcohol-attributable burden
increased with age, while for males the burden increased
until between 55–65 years of age, after which attributable
burden decreased. Females, particularly in high SDI
locations, experienced some protective effects for
ischaemic heart disease and diabetes beyond 60 years of
age. For males, only high SDI and low SDI locations had
noticeable protective effects for ischaemic heart disease,
but the effect was small compared with the total
attributable burden in those locations.
For both males and females, health outcomes
com-prising the attributable burden changed across the
life-span (figure 3). The three leading causes of attributable
deaths in this age group were tuberculosis (1·4% [95% UI
1·0–1·7] of total deaths), road injuries (1·2% [0·7–1·9]),
and self-harm (1·1% [0·6–1·5]). For females aged
15–49 years, alcohol use disorders con stituted the largest
proportion of the attributable burden across SDI
quintiles; the primary exception was tuber culosis, which
accounted for the largest proportion of attributable
burden in low SDI settings. In this age range, transport
injuries and alcohol use disorders were the predominant
causes of attributable burden for males in high-to-middle
SDI quintiles; for low-to-middle SDI and low SDI
quintiles, tuberculosis was the primary cause of the
attributable burden for both sexes.
Beyond 50 years of age, the causes of total attributable
burden became more complex by SDI quintile. For
populations aged 50 years and older, cancers accounted
for a large proportion of total alcohol-attributable deaths
in 2016, constituting 27·1% (95% UI 21·2–33·3) of
total alcohol-attributable female deaths and 18·9%
(15·3–22·6) of alcohol-attributable male deaths. In high
SDI countries, cancers were the predominant source of
attributable burden among both sexes. In low SDI
countries, tuberculosis was the primary cause of burden
for both sexes, followed by cirrhosis and other chronic
liver diseases. The profile of attributable burden in
high-to-middle SDI and middle SDI countries for females
and males was largely composed of ischaemic stroke
and haemorrhagic stroke, followed by liver cancer for
females. In all SDI quintiles, haemorrhagic stroke and
hypertensive heart disease were the largest sources of
burden for females aged 80 years and older. For men in
this age group, the composition of the burden was
similar to that of males aged 50 years or older.
Health risks associated with alcohol consumption
Figure 4 shows the relative risk curves for selected health
outcomes, separately for females and males. Estimated
relative risk curves for each health outcome are presented
in appendix 2 (pp 52–140). With this analysis, we only
found statistically significant evidence for the J-shaped
curve for ischaemic heart disease; non-significant
J-shaped curves were observed for diabetes and
isch-aemic stroke. For ischisch-aemic heart disease, we found a
Figure 3: Attributable DALY rate disaggregated by outcome, shown globally and for each region, by age and sex, in 2016
(A) Females. (B) Males. DALY=disability-adjusted life-year. SDI=Socio-demographic Index.
0 1 2 3 4 5 6 7 8 9 10 11 12 13 14 15 0
Relative risk
Standard drinks daily 0·3 0·6 0·9 1·2 1·5 1·8 2·4 2·1
A
FemalesB
Males*
Breast cancer 0 1 2 3 4 5 6 7 8 9 10 11 12 13 14 15 0Standard drinks daily 0·4 0·8 1·2 1·6 2·0 2·4 3·2 2·8
Ischaemic heart disease
0 Relative risk 0·4 0·8 1·2 1·6 2·0 2·4 3·2 3·6 2·8 Diabetes 0 0·9 1·8 2·7 3·6 4·5 5·4 6·3 8·1 9·0 7·2 Tuberculosis 0 Relative risk 2 4 6 8 10 14 12
Lip and oral cavity cancer
0 0·3 0·6 0·9 1·2 1·5 2·1 1·8
Ischaemic heart disease
0 Relative risk 0·3 0·6 0·9 1·2 1·5 1·8 2·1 Diabetes 0 0·9 1·8 2·7 3·6 4·5 5·4 9·0 6·3 8·1 7·2 Tuberculosis
minimum relative risk of 0·86 (0·80–0·96) for men and
0·82 (0·72–0·95) for women, occurring at 0·83 standard
drinks daily for men and 0·92 standard drinks daily for
women. We found no significant difference in relative
risk curves for ischaemic heart disease or diabetes
when estimating the curves by age. For all other
out-comes, including all cancers, we found that relative risk
monotonically increased with alcohol consumption
(appendix 2, pp 57–146).
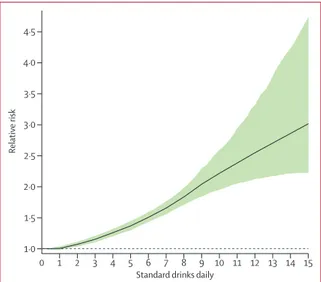
In estimating the weighted relative risk curve, we
found that consuming zero (95% UI 0·0–0·8)
standard
drinks daily minimised the overall risk of all health
loss (figure 5). The risk rose monotonically with
increasing amounts of daily drinking. This weighted
relative risk curve took into account the protective effects
of alcohol use associated with ischaemic heart disease
and diabetes in females. However, these protective
effects were offset by the risks associated with cancers,
which in creased monotonically with consumption. In a
sensitivity analysis, where we explored how the weighted
relative risk curve changed on the basis of the choice of
weights for various health outcomes, the curve changed
signifi
cantly only in settings where diabetes and
ischaemic heart disease comprised more than 60% of
total deaths in a population.
Discussion
In 2016, alcohol use led to 2·8 million deaths and was the
leading risk factor for premature death and disability
among people aged 15–49 years, with nearly 9% of all
attributable DALYs for men and more than 2% for
women. Our findings indicate that alcohol use was
associated with far more health loss for males than for
females, with the attributable burden for men around
three times higher than that for women in 2016. By
evaluating all associated relative risks for alcohol use, we
found that consuming zero standard drinks daily
minimises the overall risk to health.
Previous research has analysed all-cause risk due to
alcohol use by either investigating all-cause risk in
particular cohorts and survey series, or through
meta-analyses of those studies.
26,27Past findings subsequently
suggested a persistent protective effect for some low or
moderate levels of alcohol consumption on all-cause
mortality. However, these studies were limited by
small sample sizes, inadequate
control for confounders,
and non-optimal choices of a reference category for
calculating relative risks. More recent research, which
has used methodologies such as mendelian
randomis-ation, pooling cohort studies, and multivariable adjusted
meta-analyses, increasingly shows either a
non-signifi-cant or no protective effect of drinking on all-cause
mortality or cardiovascular outcomes.
7,14,28Our results on
the weighted attributable risk are consistent with this
body of work. Taken together, these findings emphasise
that alcohol use, regardless of amount, leads to health
loss across populations. Although we found some
protective effects for ischaemic heart disease and
diabetes among women, these effects were offset when
overall health risks were considered—especially because
of the strong association between alcohol
consump-tion and the risk of cancer, injuries, and
communic-able disease. These findings stress the importance of
assessing how alcohol use affects population health
across the lifespan.
Evaluating attributable burden across SDI quintiles
revealed the magnitude by which outcomes of alcohol
use differ and how total attributable burden relates to
increasing SDI. Our results indicate that alcohol use and
its harmful effects on health could become an increasing
challenge amid gains in SDI. Given that most low and
low-to-middle SDI settings currently have lower average
alcohol consumption than high-to-middle SDI settings,
it is crucial for decision makers and government agencies
to enact or maintain strong alcohol control policies today
to prevent the potential for rising alcohol use in the
future. Effective policies now could yield substantial
population health benefits for years to come.
Figure 4: Relative risk curves for selected conditions by number of standard drinks consumed daily
(A) Relative risk curves for breast cancer, ischaemic heart disease, diabetes, and tuberculosis for females. (B) Relative risk curves for lip and oral cavity cancer, ischaemic heart disease, diabetes, and tuberculosis for males. Points are relative risk estimates from studies. The vertical and horizontal bars capture the uncertainty in each study, related to the sample size and number of drinks consumed by individuals in the study. The black line represents the estimated relative risk for each condition at each level of consumption. The shaded green areas represent the 95% uncertainty interval associated with the estimated relative risk. The dotted line is a reference line for a relative risk of 1. The relative risk curves for all other health outcomes associated with alcohol use are presented in appendix 2 (pp 57–146).
0 1 2 3 4 5 6 7 8 9 10 11 12 13 14 15 1·0
Relative risk
Standard drinks daily 1·5 2·0 2·5 3·0 3·5 4·0 4·5
Figure 5: Weighted relative risk of alcohol for all attributable causes, by standard drinks consumed per day
Age-standardised weights determined by the DALY rate in 2016, for both sexes. The dotted line is a reference line for a relative risk of 1. DALY=disability-adjusted life-year.
Our results point to a need to revisit alcohol control
policies and health programmes, and to consider
recommendations for abstention. In terms of reducing
population-level alcohol use, WHO provides a set of best
buys—policies that provide an individual year of healthy
life at less than the cost of the average individual
income.
29Governments should consider how these
recommendations can be implemented within their local
contexts and broader policy platforms, including excise
taxes on alcohol, controlling the physical availability of
alcohol and the hours of sale, and controlling alcohol
advertising. Any of these policy actions would contribute
to reductions in population-level consumption—an
important step toward decreasing the health loss
associated with alcohol use.
Failing to address harms from alcohol use, particularly
at high levels of consumption, can have dire effects on
population health. The mortality crisis in Russia is a
striking example, where alcohol use was the primary
culprit of increases in mortality starting in the 1980s and
led to 75% of deaths among men aged 15–55 years.
30Current global trends—namely, population ageing—
portend a growing toll of the alcohol-attributable burden
in the absence of policies, particularly since many cancers
disproportionately affect older individuals. Consequently,
low-to-middle SDI countries could benefit from policy
action today to keep alcohol consump
tion low and
prevent greater health loss in the future. High and
high-to-middle SDI locations need to consider stronger
alcohol reduction policies, such as those
recommend-ed by WHO, in an effort to rrecommend-educe population-level
consumption.
Our results should be interpreted within the context of
the study’s limitations. First, our consumption estimates
might not fully capture illicit production or unrecorded
consumption given our use of sales data in estimation.
We have sought to adjust for consumption beyond sales
data, but given the heterogeneity of these estimates it is
likely that additional methodological refinements are
necessary to improve the quantification of unrecorded
consumption. Second, drinking patterns within a year
are assumed to be consistent; however, past work shows
that drinking patterns, rather than average levels of
consumption such as standard daily drinks, might be
related to different levels of risk and harm. Unfortunately,
the data requirements for assessment of such drinking
patterns by age, sex, and location far exceed what is
currently available. For instance, few prospective studies
quantify the effects of drinking patterns and average
levels of consumption in tandem, a requirement for
correctly assessing the risk of alcohol-attributable
outcomes. Third, the data used to estimate motor vehicle
harm caused to others from alcohol use were only
available for the USA (ie, FARS data). Although it is
unlikely that the patterns observed in FARS are drastically
different from those of other locations (appendix 1,
pp 141–144), this assumption needs to be tested with
more location-specific estimates. Fourth, we were unable
to find robust data about the harm caused to others
from alcohol-attributable interpersonal violence, a major
potential source of health loss. More retrospective studies
are needed to assess the harm to others caused through
an individual’s alcohol use.
30Fifth, consumption for
populations younger than 15 years was not assessed
because of data sparseness on alcohol use for these age
groups. In the absence of such data, potential approaches
to address this limitation, such as assuming consumption
patterns of older age groups or trying to extrapolate past
levels of alcohol consumption, are likely to introduce
additional bias or error. More research on youth drinking
and the associated risk is required to estimate
alcohol-attributable burden for this age group. Last, we sought to
quantify the risk of alcohol use only for outcomes with
evidence meeting the criteria for the comparative risk
assessment approach of GBD studies. However, there are
additional outcomes, such as dementia and psoriasis,
for which accumulating evidence suggests that alcohol
use might be a risk factor.
31–33In combination, these
limitations suggest that our results are likely to
under-estimate both the health risks and overall attributable
burden of alcohol use.
Conclusion
Alcohol use is a leading risk factor for disease burden
worldwide, accounting for nearly 10% of global deaths
among populations aged 15–49 years, and poses dire
ramifications for future population health in the absence
of policy action today. The widely held view of the health
benefits of alcohol needs revising, particularly as
improved methods and analyses continue to show how
much alcohol use contributes to global death and
disability. Our results show that the safest level of
drinking is none. This level is in conflict with most
health guidelines, which espouse health benefits
associated with consuming up to two drinks per day.
Alcohol use contributes to health loss from many causes
and exacts its toll across the lifespan, particularly among
men. Policies that focus on reducing population-level
consumption will be most effective in reducing the
health loss from alcohol use.
GBD 2016 Alcohol Collaborators
Max G Griswold, Nancy Fullman, Caitlin Hawley, Nicholas Arian, Stephanie R M Zimsen, Hayley D Tymeson, Vidhya Venkateswaran, Austin Douglas Tapp, Mohammad H Forouzanfar, Joseph S Salama, Kalkidan Hassen Abate, Degu Abate, Solomon M Abay,
Cristiana Abbafati, Rizwan Suliankatchi Abdulkader, Zegeye Abebe, Victor Aboyans, Mohammed Mehdi Abrar, Pawan Acharya, Olatunji O Adetokunboh, Tara Ballav Adhikari, Jose C Adsuar, Mohsen Afarideh, Emilie Elisabet Agardh, Gina Agarwal, Sargis Aghasi Aghayan, Sutapa Agrawal, Muktar Beshir Ahmed, Mohammed Akibu, Tomi Akinyemiju, Nadia Akseer, Deena H Al Asfoor, Ziyad Al-Aly, Fares Alahdab, Khurshid Alam, Ammar Albujeer, Kefyalew Addis Alene, Raghib Ali, Syed Danish Ali, Mehran Alijanzadeh, Syed Mohamed Aljunid, Ala’a Alkerwi, Peter Allebeck,
Nelson Alvis-Guzman, Azmeraw T Amare, Leopold N Aminde, Walid Ammar, Yaw Ampem Amoako, Gianna Gayle Herrera Amul, Catalina Liliana Andrei, Colin Angus, Mustafa Geleto Ansha,
Carl Abelardo T Antonio, Olatunde Aremu, Johan Ärnlöv, Al Artaman, Krishna K Aryal, Reza Assadi, Marcel Ausloos, Leticia Avila-Burgos, Euripide F G A Avokpaho, Ashish Awasthi, Henok Tadesse Ayele, Rakesh Ayer, Tambe B Ayuk, Peter S Azzopardi, Hamid Badali, Alaa Badawi, Maciej Banach, Suzanne Lyn Barker-Collo, Lope H Barrero, Huda Basaleem, Estifanos Baye, Shahrzad Bazargan-Hejazi,
Neeraj Bedi, Yannick Béjot, Abate Bekele Belachew, Saba Abraham Belay, Derrick A Bennett, Isabela M Bensenor, Eduardo Bernabe,
Robert S Bernstein, Addisu Shunu Beyene, Tina Beyranvand, Soumyadeeep Bhaumik, Zulfiqar A Bhutta, Belete Biadgo, Ali Bijani, Nigus Bililign, Sait Mentes Birlik, Charles Birungi,
Hailemichael Bizuneh, Peter Bjerregaard, Tone Bjørge, Guilherme Borges, Cristina Bosetti, Soufiane Boufous, Nicola Luigi Bragazzi, Hermann Brenner, Zahid A Butt,
Lucero Cahuana-Hurtado, Bianca Calabria, Ismael R Campos-Nonato, Julio Cesar Campuzano Rincon, Giulia Carreras, Juan J Carrero, Félix Carvalho, Carlos A Castañeda-Orjuela, Jacqueline Castillo Rivas, Ferrán Catalá-López, Jung-Chen Chang, Fiona J Charlson, Aparajita Chattopadhyay, Pankaj Chaturvedi, Rajiv Chowdhury, Devasahayam J Christopher, Sheng-Chia Chung, Liliana G Ciobanu, Rafael M Claro, Sara Conti, Ewerton Cousin, Michael H Criqui, Berihun Assefa Dachew, Paul I Dargan, Ahmad Daryani,
José Das Neves, Kairat Davletov, Filipa De Castro, Barbora De Courten, Jan-Walter De Neve, Louisa Degenhardt, Gebre Teklemariam Demoz, Don C Des Jarlais, Subhojit Dey, Rupinder Singh Dhaliwal, Samath Dhamminda Dharmaratne, Meghnath Dhimal,
David Teye Doku, Kerrie E Doyle, Manisha Dubey, Eleonora Dubljanin, Bruce B Duncan, Hedyeh Ebrahimi, Dumessa Edessa,
Maysaa El Sayed Zaki, Sergei Petrovich Ermakov, Holly E Erskine, Alireza Esteghamati, Mahbobeh Faramarzi, Andrea Farioli, Andre Faro, Maryam S Farvid, Farshad Farzadfar, Valery L Feigin,
Mariana Santos Felisbino-Mendes, Eduarda Fernandes, Alize J Ferrari, Cleusa P Ferri, Daniel Obadare Fijabi, Irina Filip, Jonas David Finger, Florian Fischer, Abraham D Flaxman, Richard Charles Franklin, Neal D Futran, Silvano Gallus, Morsaleh Ganji,
Fortune Gbetoho Gankpe, Gebremedhin Berhe Gebregergs, Tsegaye Tewelde Gebrehiwot, Johanna M Geleijnse, Reza Ghadimi, Lilian A Ghandour, Mamata Ghimire, Paramjit Singh Gill,
Ibrahim Abdelmageed Ginawi, Ababi Zergaw Z Giref, Philimon N Gona, Sameer Vali Gopalani, Carolyn C Gotay, Alessandra C Goulart, Felix Greaves, Giuseppe Grosso, Yuming Guo, Rahul Gupta, Rajeev Gupta, Vipin Gupta, Reyna Alma Gutiérrez, Murthy Gvs, Nima Hafezi-Nejad, Tekleberhan Beyene Hagos,
Gessessew Bugssa Hailu, Randah R Hamadeh, Samer Hamidi, Graeme J Hankey, Hilda L Harb, Sivadasanpillai Harikrishnan, Josep Maria Haro, Hamid Yimam Hassen, Rasmus Havmoeller, Simon I Hay, Behzad Heibati, Andualem Henok, Ileana Heredia-Pi, Norberto Francisco Hernández-Llanes, Claudiu Herteliu, Desalegn Ts Tsegaw Hibstu, Praveen Hoogar, Nobuyuki Horita, H Dean Hosgood, Mostafa Hosseini, Mihaela Hostiuc, Guoqing Hu, Hsiang Huang, Abdullatif Husseini, Bulat Idrisov, Bogdan Vasile Ileanu, Olayinka Stephen Ilesanmi, Seyed Sina Naghibi Irvani,
Sheikh Mohammed Shariful Islam, Maria D Jackson, Mihajlo Jakovljevic, Moti Tolera Jalu, Achala Upendra Jayatilleke, Ravi Prakash Jha, Jost B Jonas, Jacek Jerzy Jozwiak, Zubair Kabir, Rajendra Kadel, Amaha Kahsay, Umesh Kapil, Amir Kasaeian, Tesfaye D Dessale Kassa, Srinivasa Vittal Katikireddi, Norito Kawakami, Seifu Kebede, Adane Teshome Kefale, Peter Njenga Keiyoro,
Andre Pascal Kengne, Yousef Khader, Morteza Abdullatif Khafaie, Ibrahim A Khalil, Md Nuruzzaman Khan, Young-Ho Khang, Mona M Khater, Jagdish Khubchandani, Cho-Il Kim, Daniel Kim, Yun Jin Kim, Ruth W Kimokoti, Adnan Kisa, Mika Kivimäki, Sonali Kochhar, Soewarta Kosen, Parvaiz A Koul, Ai Koyanagi, Kewal Krishan, Barthelemy Kuate Defo, Burcu Kucuk Bicer, Veena S Kulkarni, Pushpendra Kumar, Alessandra Lafranconi, Arjun Lakshmana Balaji, Ratilal Lalloo, Tea Lallukka, Hilton Lam, Faris Hasan Lami, Qing Lan, Justin J Lang, Sonia Lansky, Anders O Larsson, Arman Latifi, Janet L Leasher, Paul H Lee, James Leigh, Mall Leinsalu, Janni Leung, Miriam Levi, Yichong Li, Lee-Ling Lim, Shai Linn, Shiwei Liu, Andrea Lobato-Cordero, Alan D Lopez, Paulo A Lotufo, Erlyn Rachelle King Macarayan,
Isis Eloah Machado, Fabiana Madotto, Hassan Magdy Abd El Razek, Muhammed Magdy Abd El Razek, Marek Majdan, Reza Majdzadeh, Azeem Majeed, Reza Malekzadeh, Deborah Carvalho Malta, Chabila Christopher Mapoma, Jose Martinez-Raga, Pallab K Maulik, Mohsen Mazidi, Martin Mckee, Varshil Mehta, Toni Meier, Tesfa Mekonen, Kidanu Gebremariam Meles, Addisu Melese, Peter T N Memiah, Walter Mendoza, Desalegn Tadese Mengistu, George A Mensah, Tuomo J Meretoja, Haftay Berhane Mezgebe, Tomasz Miazgowski, Ted R Miller, Gk Mini, Andreea Mirica, Erkin M Mirrakhimov, Babak Moazen,
Karzan Abdulmuhsin Mohammad, Noushin Mohammadifard, Shafiu Mohammed, Lorenzo Monasta, Paula Moraga, Lidia Morawska, Seyyed Meysam Mousavi, Satinath Mukhopadhyay,
Kamarul Imran Musa, Aliya Naheed, Gurudatta Naik, Farid Najafi, Vinay Nangia, Jobert Richie Nansseu,
Mudavath Siva durga prasad Nayak, Chakib Nejjari, Subas Neupane, Sudan Prasad Neupane, Josephine W Ngunjiri, Cuong Tat Nguyen, Long Hoang Nguyen, Trang Huyen Nguyen,
Dina Nur Anggraini Ningrum, Yirga Legesse Nirayo,
Jean Jacques Noubiap, Richard Ofori-Asenso, Felix Akpojene Ogbo, In-Hwan Oh, Olanrewaju Oladimeji, Andrew T Olagunju, Pedro R Olivares, Bolajoko Olubukunola Olusanya, Jacob Olusegun Olusanya, Anu Mary Oommen, Eyal Oren, Heather M Orpana, Doris D V Ortega-Altamirano, Justin R Ortiz, Erika Ota, Mayowa Ojo Owolabi, Abayomi Samuel Oyekale, Mahesh P A, Adrian Pana, Eun-Kee Park, Charles D H Parry, Hadi Parsian, Ajay Patle, George C Patton, Deepak Paudel, Max Petzold, Michael R Phillips, Julian David Pillay, Maarten J Postma, Farshad Pourmalek, Dorairaj Prabhakaran, Mostafa Qorbani, Amir Radfar, Anwar Rafay, Alireza Rafiei, Fakher Rahim, Afarin Rahimi-Movaghar,
Mahfuzar Rahman, Muhammad Aziz Rahman, Rajesh Kumar Rai, Sasa Rajsic, Sree Bhushan Raju, Usha Ram, Saleem M Rana, Chhabi Lal Ranabhat, David Laith Rawaf, Salman Rawaf, Robert C Reiner, Cesar Reis, Andre M N Renzaho, Mohammad Sadegh Rezai, Leonardo Roever, Luca Ronfani, Robin Room, Gholamreza Roshandel, Ali Rostami, Gregory A Roth, Ambuj Roy, Yogesh Damodar Sabde, Basema Saddik, Saeid Safiri, Amirhossein Sahebkar, Joseph S Salama, Zikria Saleem, Joshua A Salomon, Sundeep Santosh Salvi, Juan Sanabria, Maria Dolores Sanchez-Niño, Damian Francesco Santomauro, Itamar S Santos, Milena M M Santric Milicevic, Abdur Razzaque Sarker, Rodrigo Sarmiento-Suárez, Nizal Sarrafzadegan, Benn Sartorius, Maheswar Satpathy, Monika Sawhney, Sonia Saxena, Mete Saylan, Michael P Schaub, Maria Inês Schmidt, Ione J C Schneider, Ben Schöttker, Aletta Elisabeth Schutte, Falk Schwendicke, Sadaf G Sepanlou, Masood Ali Shaikh, Mehdi Sharif, Jun She, Aziz Sheikh, Jiabin Shen, Mekonnen Sisay Shiferaw, Mika Shigematsu, Rahman Shiri, Kawkab Shishani, Ivy Shiue, Sharvari Rahul Shukla, Inga Dora Sigfusdottir, Diego Augusto Santos Silva,
Natacha Torres Da Silva, Dayane Gabriele Alves Silveira,
Dhirendra Narain Sinha, Freddy Sitas, Adauto Martins Soares Filho, Moslem Soofi, Reed J D Sorensen, Joan B Soriano,
Chandrashekhar T Sreeramareddy, Nadine Steckling, Dan J Stein, Mu’awiyyah Babale Sufiyan, Patrick J Sur, Bryan L Sykes, Rafael Tabarés-Seisdedos, Takahiro Tabuchi, Mohammad Tavakkoli, Arash Tehrani-Banihashemi, Merhawi Gebremedhin Tekle, Subash Thapa, Nihal Thomas, Roman Topor-Madry, Fotis Topouzis, Bach Xuan Tran, Christopher E Troeger, Thomas Clement Truelsen, Nikolaos Tsilimparis, Stefanos Tyrovolas, Kingsley Nnanna Ukwaja, Irfan Ullah,
Olalekan A Uthman, Pascual R Valdez, Job F M Van Boven, Tommi Juhani Vasankari, Narayanaswamy Venketasubramanian, Francesco S Violante, Sergey Konstantinovitch Vladimirov, Vasily Vlassov, Stein Emil Vollset, Theo Vos, Fasil Wagnew Shiferaw Wagnew, Yasir Waheed, Yuan-Pang Wang, Elisabete Weiderpass,
Fitsum Weldegebreal, Kidu Gidey Weldegwergs, Andrea Werdecker, Ronny Westerman, Harvey A Whiteford, Justyna Widecka, Tissa Wijeratne, Grant M A Wyper, Gelin Xu, Tomohide Yamada, Yuichiro Yano, Pengpeng Ye, Ebrahim M Yimer, Paul Yip, Biruck Desalegn Yirsaw, Engida Yisma, Naohiro Yonemoto, Seok-Jun Yoon, Marcel Yotebieng, Mustafa Z Younis, Geevar Zachariah, Zoubida Zaidi, Mohammad Zamani, Xueying Zhang, Sanjay Zodpey, Ali H Mokdad, Mohsen Naghavi,
Christopher J L Murray, Emmanuela Gakidou. Affiliations
Institute for Health Metrics and Evaluation (M G Griswold MA, N Fullman MPH, C Hawley MSPH, N Arian BS, S R M Zimsen MA, H D Tymeson BA, A D Tapp BS, J S Salama MS,
Prof L Degenhardt PhD, S D Dharmaratne MD, Prof V L Feigin PhD, Prof A D Flaxman PhD, Prof S I Hay DSc, Prof M Jakovljevic PhD, I A Khalil MD, R C Reiner PhD, G A Roth MD, P J Sur BA, C E Troeger MPH, Prof S Vollset DrPH, Prof T Vos PhD,
Prof H A Whiteford PhD, Prof A H Mokdad PhD, Prof M Naghavi PhD, Prof C J L Murray DPhil, Prof E Gakidou PhD), Department of Global Health (F J Charlson PhD, S Kochhar MD, Prof J R Ortiz MD, R J D Sorensen MPH), School of Medicine Department of
Otolaryngology-Head and Neck Surgery (N D Futran MD), University of Washington, Seattle, WA, USA (Prof E Oren PhD); Department of Epidemiology (V Venkateswaran BDS), Department of Nutrition (M S Farvid PhD), Ariadne Labs (E K Macarayan PhD), BWH Division of General Internal Medicine and Primary Care (Prof A Sheikh MSc), Harvard University, Boston, MA, USA; Seattle Genetics, Seattle, WA, USA (M H Forouzanfar PhD); Department of Population and Family Health (Prof K H Abate PhD), Department of Epidemiology (M B Ahmed MPH, Prof T T Gebrehiwot MPH), Jimma University, Jimma, Ethiopia; School of Public Health (A S Beyene MPH, M G Tekle MPH), School of Pharmacy (D Edessa MSc,
Prof M S Shiferaw MSc), Department of Medical Laboratory Science (Prof F Weldegebreal MSc), Haramaya University, Harar, Ethiopia (D Abate MSc, M T Jalu MPH); Department of Pharmacology and Clinical Pharmacy (S M Abay PhD), Department of Reproductive Health and Health Service Management (A Z Z Giref PhD), School of Alaide Health Sciences (Prof E Yisma MPH), Addis Ababa University, Addis Ababa, Ethiopia (M M Abrar MS, G T Demoz MSc); Department of Law Philosophy and Economic Studies, La Sapienza University, Rome, Italy (Prof C Abbafati PhD); Department of Public Health
(R S Abdulkader MD), Office of the Undersecretary of Health Affairs (D H Al Asfoor MSc), Ministry of Health, Riyadh, Saudi Arabia; Human Nutrition (Z Abebe MSc), Institute of Public Health
(Prof K A Alene MPH, Prof B A Dachew MPH), Department of Clinical Chemistry (B Biadgo BSc), University of Gondar, Gondar, Ethiopia; Department of Cardiology, Dupuytren University Hospital, Limoges, France (Prof V Aboyans MD); Institute of Epidemiology, University of Limoges, Limoges, France (Prof V Aboyans MD); Nepal Development Society, Nepal (P Acharya MPH); Department of Global Health (O O Adetokunboh MSc), Department of Psychiatry
(Prof C D H Parry PhD), Stellenbosch University, Cape Town, South Africa; Cochrane South Africa (O O Adetokunboh MSc), Unit for Hypertension and Cardiovascular Disease (Prof A E Schutte PhD), South African Medical Research Council, Cape Town, South Africa (Prof D J Stein MD); Nepal Health Research Environment, Center for Social Science and Public Health Research Nepal, Nepal
(T B Adhikari MPH); Unit for Health Promotion Research (T B Adhikari MPH), National Institute of Public Health
(Prof P Bjerregaard DrPH), Department of Public Health (S Thapa PhD), University of Southern Denmark, Odense, Denmark; Faculty of Sport Science, University of Extremadura, Spain (J C Adsuar PhD); Endocrinology and Metabolism Research Center (M Afarideh MD, H Ebrahimi MD, Prof A Esteghamati MD, M Ganji MD), Digestive Disease Research Institute (H Ebrahimi MD), Non-Communicable Diseases Research Center (F Farzadfar MD, S N Irvani MD), School of Medicine (N Hafezi-Nejad MD), Hematologic Malignancies Research Center (A Kasaeian PhD), Hematology-Oncology and Stem Cell Transplantation Research Center (A Kasaeian PhD), Knowledge Utilization Research Center (KURC) (Prof R Majdzadeh PhD), Digestive Diseases Research Institute (Prof R Malekzadeh MD, G Roshandel PhD, S G Sepanlou MD), Department of Health Management and Economics, School of Public Health (S Mousavi PhD), Iranian National Center for Addiction Studies (INCAS) (Prof A Rahimi-Movaghar MD), Community-Based Participatory-Research Center (CBPR) (Prof R Majdzadeh PhD), Tehran University of Medical Sciences, Tehran, Iran (Prof M Hosseini PhD, Prof F Rahim PhD); Department of Public Health Sciences (Prof E E Agardh PhD, Prof P Allebeck MD), Department of Neurobiology (Prof J Ärnlöv PhD), Department of
Medical Epidemiology and Biostatistics (Prof J J Carrero PhD, Prof E Weiderpass PhD), Karolinska Institute, Stockholm, Sweden; Department of Family Medicine, McMaster University, Hamilton, ON, Canada (G Agarwal MD); Chair of Zoology, Yerevan State University, Yerevan, Armenia (S A Aghayan PhD); Research Group of Molecular Parasitology, Scientific Center of Zoology and Hydroecology, Yerevan, Armenia (S A Aghayan PhD); Indian Institute of Public Health (Prof S Zodpey PhD), Public Health Foundation of India (PHFI), Gurugram, India (S Agrawal PhD, A Awasthi PhD,
Prof D Prabhakaran DM); Vital Strategies, Gurugram, India
(S Agrawal PhD); Department of Midwifery (M Akibu MSc), Department of Public Health, Lexington, KY, USA (M G Ansha MPH); Debre Berhan University, Debre Berhan, Ethiopia; Department of Epidemiology, University of Kentucky, USA (T Akinyemiju PhD); Nutritional Sciences, Faculty of Medicine (A Badawi PhD), Centre for Global Child Health, The Hospital for Sick Children, University of Toronto, Toronto, ON, Canada (N Akseer PhD, Prof Z A Bhutta PhD); Nuffield Department of Population Health, University of Oxford, Oxford, UK
(D H Al Asfoor MSc, R Ali MPH, D A Bennett PhD); Department of Internal Medicine, Washington University in St. Louis, Saint Louis, MO, USA (Z Al-Aly MD); VA Saint Louis Health Care System, Clinical Epidemiology Center, Department of Veterans Affairs, Saint Louis, MO, USA (Z Al-Aly MD); Evidence Based Practice Center, Mayo Clinic Foundation for Medical Education and Research, Rochester, MN, USA (Prof F Alahdab MD); Research Committee, Education Committee, and Avicenna Journal of Medicine Editor, Syrian American Medical Society, Washington, Washington DC, USA (Prof F Alahdab MD); School of Population and Global Health (K Alam PhD), Medical School (Prof G J Hankey MD), University of Western Australia, Perth, WA, Australia; Nab’a Al-Hayat Foundation for Medical Sciences and Health Care, Iraq (A Albujeer DDS); Research School of Population Health (Prof K A Alene MPH), National Centre for Epidemiology and Population Health (B Calabria PhD), Australian National University, Canberra, ACT, Australia; Public Health Research Center, New York University Abu Dhabi, Abu Dhabi, United Arab Emirates (R Ali MPH); University of London, Pakistan (S Ali BA); Social Determinants of Health Research Center, Qazvin University of Medical Sciences, Qazvin, Iran (M Alijanzadeh PhD); Department of Health Policy and
Management, Kuwait University, Safat, Kuwait (Prof S M Aljunid PhD); International Centre for Casemix and Clinical Coding, National University of Malaysia, Bandar Tun Razak, Malaysia
(Prof S M Aljunid PhD); Department of Population Health, Luxembourg Institute of Health, Strassen, Luxembourg (A Alkerwi PhD); Swedish Research Council for Health, Working Life, and Welfare, Stockholm, Sweden (Prof P Allebeck MD); Research Group in Health Economics, University of Cartagena, Cartagena, Colombia
(Prof N Alvis-Guzman PhD); Research Group in Hospital Management and Health Policies, University of the Coast, Barranquilla, Colombia (Prof N Alvis-Guzman PhD); Sansom Institute, University of South Australia (A Amare PhD); Wardliparingga Aboriginal Research Unit (P S Azzopardi PhD), South Australian Health and Medical Research Institute, Adelaide, SA, Australia; Psychiatry (Prof T Mekonen MSc), Bahir Dar University, Bahir Dar, Ethiopia (A Amare PhD); School of Public Health (L N Aminde MD, F J Charlson PhD,
Prof B A Dachew MPH, H E Erskine PhD, A J Ferrari PhD, D F Santomauro PhD), School of Dentistry (Prof R Lalloo PhD), University of Queensland, Brisbane, QLD, Australia (J Leung PhD, Prof H A Whiteford PhD); Department of the Health Industrial Complex and Innovation in Health (Prof D A Silveira MSc), Department of Diseases and Non-Communicable Diseases and Health Promotion (A M Soares Filho DSc), Federal Ministry of Health, Brasilia, Brazil; Federal Ministry of Health, Beirut, Lebanon (Prof W Ammar PhD); Faculty of Health Sciences (Prof W Ammar PhD), Department of Epidemiology and Population Health (Prof L A Ghandour PhD), American University of Beirut, Beirut, Lebanon; Department of Internal Medicine, Komfo Anokye Teaching Hospital, Kumasi, Ghana (Y A Amoako MD); Lee Kuan Yew School of Public Policy (G G H Amul MSc), Yong Loo Lin School of Medicine
(Prof N Venketasubramanian FRCP), National University of Singapore, Singapore, Singapore; Department of Legal Medicine and Bioethics (Prof M Hostiuc PhD), Carol Davila University of Medicine and