Division for Sustainable Development
Prototype edition
Global Sustainable Development Report
“Eliminating poverty and hunger; enabling livelihoods; feeding,
nurturing, housing, and educating 9 billion people; securing peace,
security and freedom; and preserving the Earth’s life support systems in
the next two generations”
Draft for comments
April 2014
United Nations Department
of Economic and Social Affairs
2
-5. Measuring progress
“Nothing exists until it is measured.” (Niels Bohr)
This chapter discusses broader and aggregate measures of sustainable development progress. There are three fundamentally different approaches to measuring overall progress toward sustainable development.
The first approach uses indicators and official data to measure progress against a number of internationally agreed commitments (section 5.1). Hence, whether a trend is being considered good progress depends primarily on the level of ambition in the original goal/target setting which is not necessarily rooted in scientific or objective criteria at all.
The second approach is based on aggregate indicators of sustainable development progress that have been suggested by analysts and scientists (section 5.2). This approach is also primarily based on official data. The aggregate indicators differ greatly in terms of their focus, reflecting the different perspectives and values of the individual analysts that created them. This report also illustrates and quantifies a progress index that is a simple and minimal adjustment to GDP.
The third approach is a variation on the first and the second approaches. It uses data intelligence and complements official data from surveys with highly spatially disaggregated non-official data from a variety of sources such as remote sensing, mobile phones, road traffic, and user-based crowdsourcing. The third approach is much cheaper and can easier fill data gaps in the poorest regions, but it is technically most demanding (section 5.3).
The three approaches are described in the following.
5.1. Measuring progress towards internationally agreed commitments
The first approach uses indicators and official data to measure progress against internationally agreed commitments. There are hundreds of such commitments, some quantifiable others not.
It should be noted that following Agenda 21’s call for sustainable development indicators, the UN Commission on Sustainable Development (CSD) recommended a list of 140 indicators and a subset of 58 indicators, which aimed to cover the social, economic, environmental and institutional aspects of sustainable development, as captured in Agenda
21.1In order to measure progress, however, corresponding sustainable development goals and targets must also be defined.2“…A given indicator does not say anything about sustainability, unless a reference value such as thresholds is given to it”. 3 Many such threshold targets have been agreed in Agenda 21, the MDGs, the Johannesburg Programme of Implementation and in other UN fora. Some of these thresholds originated from scientific studies, others were decided on a purely political basis. Hence, this approach measures whether progress was made against the agreed political commitments, but does not necessarily measure progress against what the scientific consensus considers essential for achieving sustainable development. Most attention and resources have been dedicated to the Millennium Development Goals (MDGs) and measurement toward their achievement. In September 2000, world leaders adopted the UN Millennium Declaration which committed their nations to a global partnership to reduce extreme poverty and setting out a series of time-bound targets – to be achieved by 2015 – that have become known as the MDGs. Most of the goals had already been included in Agenda 21. The goals target at poverty and hunger eradication, universal primary education, gender equality, child and maternal health, HIV/AIDS combat, environmental sustainability and global partnership. Progress toward the 8 MDGs and their 20 targets are monitored by more than 60 indicators. The indicators for MDG 1-7 measure outcomes in developing countries and are thus indirect measures of the success/failure of the world community in achieving the goals. Ten out of the twelve indicators used to monitor MDG 8 “Develop a global partnership for development”, can – with opposite signs – also be measured in the donor country in order to follow the development of their contribution to a more equitable world. These indicators show progress in official development assistance, market access and debt.
Section Error! Reference source not found. above already presented the results of the most comprehensive review to-date of implementation of Agenda 21 and of the Rio Principles. It also provided an overview of progress towards achievement of agreed goals and targets for the 19 areas that are currently on the agenda of the General Assembly’s Open-Working Group for the Sustainable Development Goals (OWG-SDG). The areas identified by Member States include poverty eradication, food security and sustainable agriculture, water and sanitation, energy, education,
health, employment, biodiversity, oceans, forest, sustainable consumption and production, and means of implementation. Table 1 shows that for each of the 19 areas there are existing goals and targets, as well international assessments and reports that provide information on trends that can be used to assess progress against the goals. We distinguish three categories:
On-track: the commitment is being implemented or expected to meet the target as planned, but further steps should be taken.
Off-track: slow progress – expected to meet the target beyond the agreed time-frame, or slipping backwards or stagnating.
Mix-progress: due to reasons such as heterogeneity, difficult to evaluate the progress as a whole.
The trend information and projections from the global scenario literature (chapter Error! Reference source not found.) were then used to illustrate the consequences of dynamics-as-usual scenario. Based on suggestions in the scientific literature and results of sustainable development scenarios (chapter Error! Reference source not found.), potential future sustainable development goals were then suggested for 2030 or 2050 (Table 1).
Significant development gains have been achieved, even though some challenges are still daunting. For example, the MDG poverty reduction target was reached five years ahead of schedule, as the proportion of people living on $1.25 a day or less fell from 47% in 1990 to 24% by 2008, a reduction from over 2 billion to less than 1.4 billion people. The progress in developing East Asia has been especially rapid, with extreme poverty falling from over half the population in 1990 to 14% in 2008. 4,5Africa has enjoyed growth in the past decade unprecedented by historical standards, and the average poverty rate has declined from 58% in 1999 to 48% in 2008.4
Several global environmental problems have become more acute, including in the areas of food, energy, land, biodiversity, and climate. Scientists have pointed to thresholds (or “tipping points”) in the Earth System beyond irreversible changes might have enormous impacts on humanity’s livelihood. In particular, it was suggested that at least three planetary boundaries had already been breached.
Box 1. SDGs criteria agreed by member States in the Rio+20 outcome document
In paragraph 246 of the Rio+20 outcome document, member States agreed that a set of SDGs must:
i. Be based on Agenda 21 and the Johannesburg Plan of Implementation
ii. Fully respect all the Rio Principles iii. Respect national policies and priorities iv. Be consistent with international law
v. Build upon commitments already made
vi. Contribute to the full implementation of the outcomes of all major summits in the economic, social and environmental fields, including the [present] outcome document
vii. Focus on priority areas for the achievement of sustainable development, being guided by the outcome document viii. Address and incorporate in a balanced way all three
dimensions of sustainable development and their interlinkages
ix. Be coherent with and integrated into the United Nations development agenda beyond 2015
x. Not divert focus or effort from the achievement of the Millennium Development Goals
xi. Include active involvement of all relevant stakeholders, as appropriate.
It was further agreed that SDGs must also be: i. Action-oriented
ii. Concise
iii. Easy to communicate iv. Limited in number
v. Aspirational vi. Global in nature
vii. Universally applicable to all countries, while taking into account different national realities, capacity and levels of development, and respecting national policies and priorities.
Source: Rio+20 outcome document.6
Currently, there is no single, universally agreed set of sustainable development goals or targets. It should also be noted that – while there are several proposals - there is no agreed metric of overall sustainable development progress (section 5.2). The Rio+20 outcome document called for Sustainable Development Goals (SDGs) that would be “global in nature and universally applicable to all countries” (The Future We Want, para 247), address in a balanced way all three dimensions of sustainable development (social, the economic and the environmental) and satisfy 18 criteria (see Box 1). An intergovernmental Open-Working Group on Sustainable Development Goals (OWG-SDG) was established by the UN General Assembly on 22 January 2013, in order to prepare a proposal for SDGs.
4
-Table 1. Progress towards internationally agreed commitments and potential future goals in the areas on the agenda of the Open-Working Group on Sustainable Development Goals1
Thematic areas identified by Member States
Selected international
reports and assessments Past trends and current status Existing goalsor commitments
Existing targets Current
status Dynamics-as-usual (trend) pathwayfrom 2010 to 2050 Potential future goals/targets suggested by scientists
1. Poverty eradication (MDGs)
UN Millennium
Develop-ment Goals Reports;
World Bank-IMF Global
Monitoring Reports
The world’s poverty reduction target was reached 5 years ahead of schedule. The proportion of people living on less than $1.25 a day in developing countries fell from 47% to 22% between 1990 and 2010. In 2012, more than 1 billion people still lived in extreme poverty which was, however, 700 million fewer people than in 1990. Progress has been uneven among regions and within countries.
Eradicate
poverty Reduce extreme povertyby half by 2015 MDG goalachieved, but still 1 billion people in extreme poverty
Progress in poverty reduction is fast enough to compensate for the growing world population, but the absolute number of poor people will stay roughly at the 2010 level of almost 3 billion people living on <US$2 per day.
Eliminate poverty worldwide by 2030 2. Food security and sustainable agriculture (MDGs and beyond) UN Millennium
Develop-ment Goals Reports; World
Bank-IMF Global
Monito-ring Reports; FAO State of World Reports; the State of Food Insecurity Reports;
UNCCD Reports
The relative hunger reduction target (halving the proportion of people suffering from hunger by 2015) is within reach. The proportion of undernourished people in developing countries decreased from 23.2% in 1990-92 to 14.9% in 2010-2012. But one in eight people in the world remain chronically undernourished today.
World free of
hunger Reduce hunger by half by2015 On-trackin the MDGs context
The number of people going hungry will be reduced by 550 million people, still leaving 250 million with insufficient food intake (down from 800 million in 2010).
Halve the proportion of people who suffer from hunger by 2015, further halve it by 2030, and eradicate hunger by 2050 3. Water and sanitation (MDGs) UN Millennium Development Goals Reports; World Bank-IMF Global Monitoring Reports; UN World Water Development Report
The MDG drinking water target was met five years ahead of schedule despite significant population growth. The proportion of the global population using such sources reached 89% in 2010, up from 76% in 1990.
Progress towards the sanitation target has been good, but not good enough to meet the MDG target.
Ensure access to safe drinking water and stop unsustainable exploitation of water resources Reduce proportion of people without sustainable access to safe drinking water and basic sanitation by half by 2015. On-track in the MDGs context
> 240 million people (mostly in rural areas) will be without access to improved water sources, and 1.4 billion people without access to basic sanitation. Child mortality from diarrhoea (caused by unsafe water supply/sanitation) will decrease, but Sub-Saharan Africa will lag behind.
Universal access to improved water source and basic sanitation by 2050.
4. Health
(MDGs) UN MillenniumDevelopment Goals Reports; World Bank-IMF Global Monitoring Reports
WHO World Health Report
Good progress has been made on child mortality, less on maternal mortality. Access to reproductive health services shows slow progress. Despite the progress made in MDG-related health, the coverage of health services and financial risk protection falls far short of universal coverage.
Reduce child mortality; im-prove maternal health; combat HIV/AIDs etc.
Reduce by two thirds, between 1990 and 2015, the under-five mortality rate.
On-track in the MDGs context
Global premature mortality from malaria halved to 0.4 million from 2010 to 2050.
Universal access to health care. 5. Education
(MDGs) UN MillenniumDevelopment Goals Reports; World Bank-IMF Global Monitoring Reports
The number of children out of school declined by almost half between 2000 and 2011, but progress in reducing the number of children out of school has slowed. The world is unlikely to reach universal primary education by 2015.
Universal primary schooling
By 2015, children everywhere (boys and girls alike) will be able to complete a full course of primary schooling
Off-track Universal primary education by 2020, universal secondary education by 2050. Women will account for the majority of higher-level degrees worldwide. Universal primary education by 2020. Universal secondary education by 2030. 6. Employment
(MDGs, JPOI) ILO Global EmploymentTrends; World Bank World Development Reports
Global unemployment increased by another 4 million over the course of 2012. A quarter of this increase was in the high-income economies, three quarters in developing countries.
Full and productive employment and decent work for all.
By 2015, achieve full and
productive employment and decent work for all.
By 2020, increase decent
employment for the urban poor.
Off-track 1 billion new “livelihoods” to be created from 2010 to 2030 (BAU estimate).
Create 63 million decent new jobs per year until 2050, achieving full, productive and decent employment for all. 7. Oceans (Ch. 17 of Agenda 21; JPOI; Aichi Targets 6, 10 and 11; Target 7.B of MDG)
UNGA Regular Process for
Global Reporting and Assessment of the State of the Marine Environment, including Socio-economic Aspects; UNEP Keeping Track Reports
Oceans have become more acidic, which has impacted corals and marine life. Oceans have warmed and sea-levels risen. Today, 80% of global fisheries are either fully exploited or overexploited. Other challenges include marine pollution, invasive aquatic species, coastal area
development, safety of navigation, maritime security, working conditions and impacts from resource extraction.
Protection of the oceans and all kinds of seas
By 2015, the multiple anthropogenic pressures on coral reefs are minimized, so as to maintain their integrity and functioning.
Off-track Global collapse of ocean fisheries
before 2050. Eliminate overfishing by2025 and restore fish stocks.
1
Thematic areas identified by Member States
Selected international
reports and assessments Past trends and current status Existing goalsor commitments
Existing targets Current
status Dynamics-as-usual (trend) pathwayfrom 2010 to 2050 Potential future goals/targets suggested by scientists 8. Biodiversity (Aichi Targets; Target 7.B of MDGs) CBD Global Biodiversity
Outlooks The target agreed by Governments in 2002, “to achieve by2010 a significant reduction of the current rate of biodiversity loss at the global, regional and national levels …”, has not been met. Biodiversity continues to decline in all three of its main components – genes, species and ecosystems. 20 Aichi Goals of halting global biodiversity loss Achieving, by 2010, a significant reduction in the rate of biodiversity loss.
Off-track Biodiversity (measured as terrestrial mean species abundance) will decline by 10% (highest losses in Asia, Europe, and Southern Africa). The area of natural land converted to agriculture will decrease after 2030 (“peak farmland”), but biodiversity impacts will continue thereafter.
Stabilize biodiversity at the 2020/2030 level (depending on region) by 2050. 9. Forest (Aichi Targets on forest; Four shared global objectives on forests at UNFF in 2006.)
UN Forest Forum Reports CBD Global Biodiversity
Outlooks; FAO Global Forest Resources Assessments
Today, forests cover 31 percent of the global land area and are a safety net for the poor. The rate of deforestation has decreased and large-scale planting of trees is significantly reducing the global net loss of forest area. Several countries in South America and Africa continue to have the large net losses of forest. Forest component of Aichi targets: reducing deforestation 25% reduction in annual global deforestation and degradation rates by
2015, compared with the
2000-05 average
Off-track Primary forests will continue to disappear. The overall rate of global deforestation will decrease, leading to no net forest loss after 2020. Continued lack of understanding of the complex non-linear dynamics of ecosystems.
No net forest loss and no more destruction of primary forests by 2020. 10. Sustainable consumption and production (SCP) (Ch.4 Agenda 21; and Ch. 3 of JPOI) UN Trends Reports: Towards Sustainable Consumption Production;
World Business Council for SD: Vision 2050 Report; UNEP: The Marrakech
Process Progress Report
The 10YFP on sustainable consumption and production patterns was adopted at Rio+20 (§226). Progress has been made in greening production chains and in procurement policy. Global eco-efficiency has continuously improved while the absolute scale of material consumption has increased unabated. Changing unsustainable patterns of consumption and production International plan of action is in place, but no time-bound target.
Off-track Doubling or tripling of total material consumption. Primary energy use will increase by 80%, water demand by 55% (mainly from manufacturing (+400%), electricity (+140%) and domestic use (+130%)).In the face of competing demands, there will be little scope for increasing irrigation. Global eco-efficiency will increase by a factor 1.5 to 2.
Stabilize global material consumption by 2015 levels. Increase global eco-efficiency by a factor of 3.2 (or 4) by 2050. 11. Means of implementation (MDGs, Rio+20; Copenhagen Accord)
UNCTAD Trade and
Investment Reports; MDG Gap Task Force Reports; World Bank World Development Reports; IPCC Reports;
WIPO Annual Reports
Progress has been made, but gaps remain in the
implementation of global commitments in the areas of aid, trade, debt relief, and access to new technologies and affordable essential medicines. The financial, food and energy crises have reversed some of the earlier progress. The proportion of net ODA in donor’s GNI increased from 2000 to 2010, but decreased thereafter to 0.29% in 2012, with the poorest countries being most adversely affected.
Develop a global partnership for development.
Meet the 0.7% ODA/GNI target now; $100 billion per year for climate change by 2020
Off-track Net ODA will remain at around 0.3% GNI of donors. Technology
performance will continue to increase too slowly to compensate for increasing demand. Gaps in access to technology will hardly narrow, implying technology diffusion rates well below what would be needed to achieve even existing goals.
Achieve 0.7% ODA/GNI, focusing on the poorest and most vulnerable. Mobilize resources for a SDG fund commen-surate with needs by 2018. Universal access to sustainable technolo-gy by 2030. Global tech-nology performance im-provement by a factor 4 by 2050. 12. Sustained and inclusive economic growth (Rio+20)
UN DESA World Economic
and Social Survey;
UNIDO Industrial
Development Report
Partly due to the recent financial crises, financing has fallen short in areas that are critical for sustainable growth: long-term investment, research and development, and investment in riskier sectors, such as SMEs.
Achieve SD promoting sus-tainable, inclu-sive and equi-table economic growth.
Sustained real economic
growth in all countries. Mixedprogress. Gross world product will quadruple toUS$300 trillion, with BRICS accounting for 40%. Within country inequality will increase as will the gap between the poorest and richest countries. GDP per capita > US$10,000 PPP in all countries by 2050. Sustained increase in Genuine Progress Indicator per capita. 13. Needs of countries in special situations, and middle-income SG’s Report on Implementation of the Programme of Action for the LDCs;
UN-OHRLLS Reports on
The economic growth performance of LDCs has improved considerably over the last decade, as did enrolment in primary education. The LLDCs and SIDS have made progress, but they are not on track to achieve many of the MDGs by 2015. The middle-income countries continue to face a range
Address the special needs of Africa, LDCs, LLDCs and SIDSs.
Range of targets Mixed progress among and between
Continued challenges faced by the poorest and most vulnerable countries.
Achieve graduation of all LDCs by 2050. Reduce the vulnerability of SIDS to the average of developing countries
6
-Thematic areas identified by Member States
Selected international
reports and assessments Past trends and current status Existing goalsor commitments
Existing targets Current
status Dynamics-as-usual (trend) pathwayfrom 2010 to 2050 Potential future goals/targets suggested by scientists countries (Istanbul Programme of Action; Rio+20) LDCs, LLDCs and SIDS.
ADB: African Development
Reports
of development challenges, including an expectation to
increase their role as development donors. thesegroups. by 2030. 14. Human
rights, the right to development and global governance (Rio+20) UNDP Human Development Reports;
World Bank World
Development Reports
Differences in rights and basic opportunities across
nationality, race, gender, and social groups have persisted. Respect, pro-tect and pro-mote human rights and fun-damental freedom for all
Range of targets Mixed
progress. Human rights regime may faceadditional pressure due to conflicts arising from global competition for natural resources.
Implement existing human rights commitments 15. Equality
(MDGs) Human DevelopmentReports; UN-Women Progress of the World’s Women; UN Millennium Development Goals Reports;
There has been progress on some of the MDGs with rapid gains in education, and poverty reductions and child mortality. However, world inequality, by some measures, is high and rising within and among countries. Gains from growth are unequally distributed.
Promote gender equality and empower women
Equal girl’s enrolment in primary school; women’s share of paid
employment etc. by 2015 Mixed
progress. Rising world middle-income class.GDP per capita increases from US$33,000 to 69,000 in OECD, from US$7500 to 37,000 in BRICS, US$11,100 to 33,000 globally. GDP per capita > US$10,000 PPP in all regions by 2050. Sustained increase in intergenerational earnings, wage and educational mobility. 16. Energy (Rio+20 Outcome Document) Global Tracking Framework Report
IIASA Global Energy
Assessment; IEA World Energy Outlooks; IPCC
Working Group III Reports
Today, 2.4 billion people have no access to modern energy services. It continues to be difficult to reconcile this necessity and demand for energy with its impact on the natural resource base in order to ensure that sustainable development goals are realized.
Make sustainable energy for all a reality
(Informal) sustainable
energy for all targets Off-track Primary energy use increases by 80%.Mix remains fairly stable: fossil fuels (85%), modern renewable sources (10%), nuclear (5%). Energy intensity improvements outstripped by energy demand.
Universal access to modern energy services by 2030. Double the global rate of improve-ment in energy efficien-cy. Double the share of renewable energy in the global energy mix. 17. Sustainable cities, transport. (MDGs and beyond) UN-HABITAT: Global Reports on Human Settlement
IEA: World Energy Outlook – BLUE Shift
In the past 12 years alone, cities for 770 million people (equivalent to 93 New York cities) have been built, more than in any decade before. Urbanization increased from 29% in 1950 to surpass 50% in 2007. Demand for freight and passenger transport has grown 1.5 to 2 times faster than GDP since the early 1990s. In Asia and he Pacific region alone, transport investment requirements are $292 billion per year, up from $137 billion in the early 1990s.
Improve the lives of slum-dwellers
Achieve, by 2020, a significant improvement in the lives of at least 100 million slum dwellers
Off-track Urbanization reaches 70% (+2.8 billion people in urban areas, -0.6 billion in rural areas). Transport will continue to grow considerably faster than GDP and reach levels 5-10.
Reduce the number of slum dwellers to close to 0 by 2050. 18. Climate Change and Disaster Risk Reduction (Copenhagen Accord)
IPCC Assessment Reports;
UNFCCC Independent Reports; UNEP: Emission
Gap Reports; World Bank: Turn Down the Heat Reports; UNISDR Global Assessment Reports
Since 1850, global use of fossil fuels has increased to domestic energy supply, leading to a rapid growth in greenhouse gas emissions. Greenhouse gas emissions have increased at an accelerated rate in the 2010s. By 2012, CO2 concentration had surpassed 400 ppm (39% above pre-industrial levels). Lower-income countries are disproportionally affected by disaster risk.
Hold global mean temperature increase below 2oC . By 2050 or longer term based on scientific evidence
Off-track Atmospheric GHG concentrations reach 685 ppmv (CO2-equ.), (eventually leading to 3-6 degree Celsius warming). Keep atmospheric GHG concentration below 450 ppm CO2-eq. from 2010 to 2100. 19. Conflict prevention, post-conflict peace-building
Human Security Report The global level of fragility declined worldwide by some 20 percent between 1995 and 2010 according to the State Fragility Index. The deadliness of warfare has declined over the last 50 to 60 years, and there are now significantly fewer armed conflicts around the world than during the peak of the early 1990s. The average number of high-intensity conflicts per year dropped by half from the 1980s to the new millennium.
Maintain international peace and security – UN Charter Maintain international
peace and security Significantprogress, but different views on progress
Continued, significant number of State-based armed conflicts. Continued reduction in the number of deaths from non-State armed conflicts. Possibly more frequent and ever more intense conflicts in the long-run.
Ensure international peace and security
The “Expert Group Meeting for the UN Global Sustainable Development Report - Engaging National Assessments” which was hosted by the Government of China in Beijing from 12 to 13 December 2013 referred in its Chair’s Summary to a list of potential future goals and targets for the next two generations that have been suggested by scientists based on existing assessments that analyzed past trends and future options (see Box 2). It also suggested that these goals and targets might be considered by the OWG-SDG and which might “draw upon the scientific community of sustainable development scenario analysts to inform them on trade-offs and synergies between suggested goals and targets.” (Annex 4).7It should be noted that the list of goals and targets suggested is rather similar to that provided in Table 1.
Box 2. Potential sustainable development goals/targets that have been suggested by scientists
1. Eliminate extreme poverty worldwide by 2050
2. Halve the proportion of people who suffer from hunger by 2015, further halve it by 2030, and eradicate hunger by 2050
3. Universal access to improved water source and basic sanitation by 2050
4. Universal health coverage
5. Universal primary education by 2020. Universal secondary education by 2030.
6. Create 63 million decent new jobs per year until 2050, achieving full, productive and decent employment for all.
7. Eliminate overfishing and restore fish stocks.
8. Stabilize biodiversity at the 2020/2030 level (depending on region) by 2050.
9. No net forest loss and no more destruction of primary forests by 2020.
10. Stabilize global materials (e.g. non-renewable resource) consumption at 2015 levels.
11. Achieve 0.7% ODA/GNI (OECD countries), focusing on the poorest and most vulnerable countries. Mobilize resources for a global SDG fund commensurate with estimated needs by 2018.
12. GDP per capita > US$10,000 PPP in all countries by 2050.
13. Reduce the wide disparity of per capita GDP between developed countries and developing countries.
14. Sustained increase in intergenerational earnings and educational mobility.
15. By 2030, ensure universal access to modern energy services; double the global rate of improvement in energy efficiency; and double the share of renewable energy in the global energy mix. 16. Reduce the number of slum dwellers to close to 0 by 2050. 17. Hold global mean temperature increase below 2 degrees Celsius. 18. Increase science and technology innovation capacity through
knowledge sharing and technology transferring.
Source: Chair’s Summary of the “Expert Group Meeting for the UN
Global Sustainable Development Report - Engaging National Assessments”, Beijing, China, 12-13 Dec. 2013.
5.2. Global initiatives on measuring overall progress
The second approach to measure progress is based on aggregate indicators of sustainable development progress that have been suggested by analysts and scientists. This approach is primarily based on official data. The aggregate indicators differ greatly in terms of their focus, reflecting the different perspectives and values of the individual analysts that created them. Next we provide an overview of a number of global initiatives for progress measurement driven by the need to complement GDP since 1990s. Thereafter, we’ll also illustrate and quantify a progress index that is a simple and minimal adjustment to GDP – measuring the “good” GDP and wealth. We conclude with a novel, technology-based approach that allows assessment of sustainable development progress at multiple scales (section 5.3).
5.2.1. Overview of metrics
Since the 1970s, analysts and scientists have proposed many pilot metrics of sustainable economic progress, development progress, environmental progress, well-being, and of life satisfaction which have been adopted or been subject of various global initiatives (Table 2). These metrics are described in more detail in this section, based on a 2011 report of the European Statistical System Committee.8 UNDP has developed a Human Development Index (HDI) to benchmark countries based on combined measurement of GDP, health and education. The World Bank with its calculation of genuine savings has pioneered the inclusion of social and environmental aspects when assessing the wealth of nations. In 1995, in response to the call of Commission for Sustainable Development, the United Nations developed a set of 134 national Indicators of Sustainable Development (CSD Indicators). The United Nations Statistical Commission has initiated a multi-year process of revision to the System of Environmental-Economic Accounting (SEEA). The OECD is running the Global Project on Measuring the Progress of Societies fostering the use of novel indicators in a participatory way. Several NGOs measure the "ecological footprint" – a measurement that has been formally recognised as a target for environmental progress by some public authorities (Commission of the European Communities, 2009).9
8
-Table 2. Broad overview of perspectives, scope, dimensions and purpose of selected global initiatives to measure overall progress
International initiatives SDGs and
post-2015 Commission forSustainable Development: indicators of SD UNSC: System of Environmental Economic Accounting WB: Wealth accounting and adjusted net saving Stiglitz-Sen-Fitoussi Commission report EU GDP and Beyond (e.g. GPI) OECD Better
Life Initiative UNECE/ OECD/Eurostat TFSD UN MDGs DevelopmentHuman Index (HDI)
Sc
op
e
Perspective Sustainability Sustainable development
informed by Agenda 21
Environment
sustainability condition forA necessary sustainability Economic performance and social progress Progress Well-being and progress of societies Sustainable
development Ending globalpoverty developmentHuman Intra-generational equity X X (equity, health, education, housing, security, stabilized population) n.a. X X X (economic performance, families, and security) X X X X (income, health and education) Inter-generational sustainability X X (climate, clean air, land productivity, ocean productivity, fresh water, and
biodiversity) X X X X (clean air, land, and water) X X X (environ. sustainab.) Indirectly Di m en sio ns a da pt ed fr om th e St ig lit z r ep or t
Main concern Sustainable
development developmentHuman and economicEnvironment accounting Economic development / macroeconomic performance Well-being /
quality of life relevancePolicy Material well-being and quality of life
Current and
future well-being Ending poverty education andWealth, health Economic performance XXX X XXX XX X X X X X X Societal well-being (human & social aspects) XXX XXX -- XX X X X X XXX X Environment XXX XXX XXX XXX X XX X XX X -N ot e Purpose Monitoring global common set of goals Monitoring
progress Improvingstatistics relevance Monitoring Improving statistics relevance Improving statistics relevance Fostering
better policies Uniformity inmeasures for comparability
Monitoring
goals Evaluating dev.incl. human well-being Limitation Limited number goals to cover a broad range of issues. Time frame: sporadic references to 2015 e.g. human capital = edu. expenditure Weak in environmental sustainability
e.g. did not count depreciation
of ‘human-health capital’
n.a. n.a. Weak in environmental
sustainability
Environment factors are
missing
5.2.2. European Union’s Beyond GDP initiative
Work to complement GDP has been going on for many years, both at national and international levels. In view of the dominance of GDP as the most prominent measure of progress today, these metrics aim to implicitly or explicitly complement or replace GDP as a measure of progress. It should also be noted that GDP is a measure of economic activity and was not designed as a measure of progress in economic welfare. GDP is a powerful and widely accepted indicator for monitoring short to medium term fluctuations in economic activity. While it is still the best single measure of how the market economy is performing, it has not performed well as a good measure of long-term economic, social and environmental progress.
The EU Beyond GDP initiative is about developing indicators that are more inclusive of environmental and social aspects of progress. It highlighted the need to improve, adjust and complement GDP with indicators that concisely incorporate social and environmental achievements (e.g., improved social cohesion, accessibility and affordability of basic goods and services, education, public health and air quality) and setbacks (e.g., increasing poverty, more crime, depleting natural resources). It focused on a number of short- to medium term actions to incorporate social and environmental dimensions in measuring progress:
Complementing GDP with environmental and social indicators;
Gathering near real-time information for decision-making;
Providing more accurate reporting on distribution and inequalities;
Developing a European Sustainable Development Scoreboard;
Extending national accounts to environmental and social issues.
The newly developed “Europe 2020” strategy defines measurable targets for several indicators that go beyond GDP. As with approaches to green growth, these measurement actions aim to improve the relation between economic activities and their impact on the environment and social inclusion. A well-known example that was considered by the EU’s Beyond GDP initiative is the Genuine Progress Indicator (GPI) which is presented next.
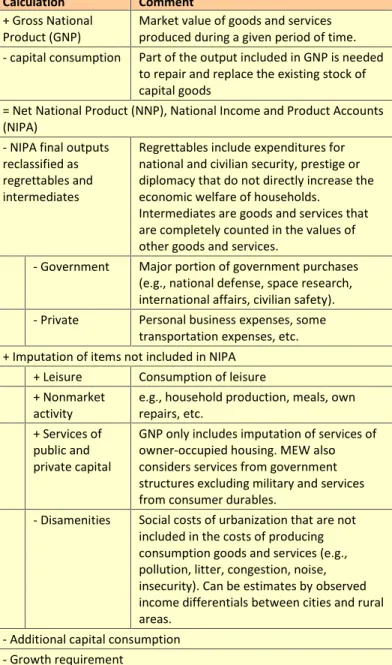
5.2.3. Measure of Economic Welfare (MEW), Index of Sustainable Economic Welfare (ISEW), Genuine Progress Indicator (GPI)
The Measure of Economic Welfare (MEW), the Genuine Progress Indicator (GPI) and the Index of Sustainable Economic Welfare (ISEW) are three variations of the same idea to adjust GDP to measure consumption and ultimately economic welfare, rather than production and the overall level of commercial activities.
Table 3. Calculation of the Measure of Economic Welfare
Calculation Comment
+ Gross National
Product (GNP) Market value of goods and servicesproduced during a given period of time. - capital consumption Part of the output included in GNP is needed
to repair and replace the existing stock of capital goods
= Net National Product (NNP), National Income and Product Accounts (NIPA)
- NIPA final outputs reclassified as regrettables and intermediates
Regrettables include expenditures for national and civilian security, prestige or diplomacy that do not directly increase the economic welfare of households.
Intermediates are goods and services that are completely counted in the values of other goods and services.
- Government Major portion of government purchases (e.g., national defense, space research, international affairs, civilian safety). - Private Personal business expenses, some
transportation expenses, etc. + Imputation of items not included in NIPA
+ Leisure Consumption of leisure + Nonmarket
activity e.g., household production, meals, ownrepairs, etc. + Services of
public and private capital
GNP only includes imputation of services of owner-occupied housing. MEW also considers services from government structures excluding military and services from consumer durables.
- Disamenities Social costs of urbanization that are not included in the costs of producing consumption goods and services (e.g., pollution, litter, congestion, noise, insecurity). Can be estimates by observed income differentials between cities and rural areas.
- Additional capital consumption - Growth requirement
= Sustainable Measure of Economic Welfare (MEW)
Source: Nordhaus and Tobin (1972)11; Stewart (1974)12.
The Nordhaus-Tobin concept of sustainable Measure of Economic Welfare (MEW) “provides a measure of the amount of consumption in any year that is consistent with sustained steady growth in per capita consumption at the trend rate of technological progress” (Stewart, 1974, p. 21).12
10
-Table 3 provides an overview of how MEW is calculated starting from Gross national product (GNP).13While GNP is a measure of production, some have pointed out that MEW is primarily a measure of consumption.14 “Welfare would depend on the amount of total satisfaction one receives from total consumption, and, among other things would depend also on the distribution of income” (Stewart, 1974, p. 22).12However, income distribution was not considered in the MEW, as its authors recognized that they “cannot… estimate how well individual and collective happiness are correlated with consumption.”11Today, this continues to be a challenge and points to the need to track GDP, measures of consumption and economic welfare, and people’s subjective levels of happiness and life satisfaction.
Daly and Cobb built on the previous work of Nordhaus and Tobin and suggested the Index of Sustainable Economic Welfare (ISEW) in 1989.15In contrast to the MEW, the ISEW took account of the changing income distribution by weighting personal consumption. In contrast to MEW, ISEW and GPI are consistent with Fisher’s concept of income and capital and hence are based on a firm theoretical foundation.16 There are only minor differences between the ISEW and the so-called Genuine Progress Indicator (GPI). In fact, differences in the most recent applications of the GPI are as wide as those between ISEW and GPI. Hence, we will use them interchangeably.
Table 4. Calculation of GPI (as used for Baltimore city)
Dimension Components and calculation Explanations
Economic + Personal consumption expenditure weighted by income distribution index
+ Value of household work and parenting Services provided by volunteer (e.g., non-remunerated community work) and non-paid household work (e.g., parenting, elder-care, cleaning, house repair) + Value of volunteer work
+ Value of higher education
+ Services of household capital Services yielded by existing consumer durables (e.g., value added by previously purchased consumer durables);
+ Services of highways and streets Services yielded by publicly provided human-made capital (e.g., libraries, museums, roads and highways)
+ Net capital investment Net capital investment (a contentious component, but constrained to the increase in the stock of producer goods above the amount required to keep the quantity of producer goods per worker intact)
- Net foreign borrowing
Social - Cost of crime Disservices generated by economic activity (e.g., cost of noise pollution,
commuting, crime, underemployment and unemployment, lost leisure time); - Loss of leisure time
- Cost of underemployment - Cost of commuting
- Cost of consumer durables The cost of consumer durables (e.g., expenditures paid in the current year on cars, refrigerators, household furniture);
- Cost of household pollution abatement Defensive and rehabilitative expenditures (e.g., cost of household pollution abatement, vehicle accidents; family breakdown; in some cases a certain percentage of private health expenditure assumed to constitute a form of defensive expenditure);
- Cost of automobile accidents - Cost of family breakdown
Environmental - Cost of air pollution Disservices generated by economic activity (e.g., cost of noise pollution, commuting, crime, underemployment and unemployment, lost leisure time); - Cost of water pollution
- Cost of noise pollution
- Loss of wetlands Cost of sacrificed natural capital services
- Loss of forest cover - Loss of farmland
- Cost of non-renewable resource depletion - Cost of long-term environmental damage
- Carbon dioxide emissions damage Cost of pollution - Cost of ozone depletion
Total = GPI
Source: Posner and Constanza (2011)17
Table 4 provides an overview of the economic, social and environmental components of GPI, using the example of Baltimore city.18GPI is derived from personal consumption expenditure weighted by an income distribution index (typically an indexed Gini). A number of items are added: services yielded by existing consumer durables; services yielded by publicly provided human-made capital; services provided by volunteer and non-paid household work; net capital investment. Others items are subtracted: the cost of consumer durables; disservices generated by economic activity; defensive and rehabilitative expenditures; net foreign borrowing; cost of sacrificed natural capital services.
Figure 1 provides an overview of global trends in a number of aggregated metrics of progress from 1961 to 2007. The metrics are described in more detail later. While the world’s average GDP per capita increase threefold since 1961, the world’s genuine progress indicator which aims to measure “genuine” economic welfare almost doubled until 1978, but has actually decreased since. It should be noted that the GPI estimates were extrapolated based on national estimates for 17 countries representing all continents and 53% of the world population.19 Interestingly, the second half of the 1970s is also when the global ecological footprint increased beyond bio-capacity. The number of state-based armed conflicts peaked at the beginning of the 1990s and has decreased since.
Figure 1. Global trends in GPI and other aggregate metrics of progress since, 1961-2007
Source: GPI/capita and GDP/capita are from Kubiszewski et al. (2013); Number of State-based Armed Conflict is from Human Security Report
(2012); global ecological footprint and bio-capacity hectares per person is from www.footprintnetwork.org/atlas; World Gini is calculated by Branko Milanovic of the World Bank.
Note: among the six time series data above, five of them are rescaled to the unit on the left Y axis; while only World Gini point uses Y axis on the
right. For GDP/capita and GPI/capita, the unit is US$1,000, for Number of State-based Armed Conflict, the unit is 10 cases, for global ecological footprint and bio-capacity hectares per person, the unit is 1 hectare. GPI/capita was estimated by aggregating data from the 17 countries (see end note about the 17 countries) for which GPI had been estimated, and adjusting for discrepancies caused by incomplete coverage by comparison with global GDP/capita data for all countries. All estimates are in 2005 US$.
A number of weaknesses of GPI and ISEW have been pointed out. Valuation methodologies of the various components are not standardized and are subject to large uncertainties. The variable application of GPI/ISEW highlights different views on which components to include. For example, it was suggested that measures of investment and depreciation of “human-health capital” are not
factored in systematically.20 There are particularly strong views on whether and how income inequality should be included. Yet, there is no reason why it would not be possible to standardize GPI/ISEW, e.g., through the UN Statistical Commission similar to the historical experience with GDP. A minimal approach to adjusting GDP might be a useful way forward. Furthermore, it is, of course, possible
12
-to measure GPI globally without having established national GPI processes.
5.2.4. World Bank’s wealth estimates and adjusted net savings
In addressing the questions “Where is the wealth of nations?” and “How does wealth change with development?”, the World Bank estimated total national wealth as composed of:
Produced capital: the sum of machinery, equipment, structures and infrastructure, and urban land;
Natural capital: e.g., land resources, forests and sub-soil assets;
Intangible capital: e.g., human capital, quality of institutions, and governance.
According to the World Bank, in all countries, intangible capital is, by far, the largest share of wealth. However, for the poorest countries, natural capital is more important than produced capital, indicating a need for natural resource management in development strategies.
The World Bank also calculated adjusted net savings (ANS) -also known as “genuine savings” - which is a sustainability indicator building on the concepts of green national accounts.21 Adjusted net savings measure the rate of savings in an economy after taking into account investments in human capital, depletion of natural resources and damage caused by pollution.
Table
5
provides details of the definition of adjusted netsavings, together with the estimated size of its components in 2008.22The world’s public expenditures in education was similar to the value of resource depletion and environmental damage, leading to an adjusted net savings rate of 7.2% of GNI, not very different from net national savings of 7.9% of GNI. It is positive, hence, adjusted wealth continued to increase, according to this metric. A Comparison of GPI with Adjusted Net Savings shows that GPI includes a lot more elements, especially in the social areas. Adjusted net savings makes the trade-off between growth and environment explicit. Figure 2 shows the world’s trends on gross saving and adjust net saving since 1970.
Table 5. Calculation of adjusted net savings.
Dimension Components and calculation World adjusted net savings in 2008 [% of GNI]
Explanation
Economic + Gross national savings(GNS) 20.9% Difference between GNI and public and private consumption plus net current transfers. - Depreciation 13.0% Replacement value of capital used up in the process of production.
= Net national saving (NNS) 7.9% Difference between gross national saving and the consumption of fixed capital. Social + Education expenditure 4.2% Public current operating expenditures in education, including wages and salaries and
excluding capital investments in buildings and equipment.
Environ-mental - CO2damages 0.4% A conservative figure of $20 marginal global damages per ton of carbon emitted wastaken from Fankhauser (1994). - PM damages 0.2% Willingness to pay (WTP) to avoid mortality and morbidity attributable to particulate
emissions
- Energy depletion 3.9% Ratio of present value (PV) of rents, discounted at 4%, to exhaustion time of the resource. Rent is calculated as the product of unit resource rents and the physical quantities of energy resources extracted. It covers coal, crude oil, and natural gas. - Mineral depletion 0.5% Ratio of present value of rents, discounted at 4%, to exhaustion time of the
resource. Rent is calculated as the product of unit resource rents and the physical quantities of mineral extracted. It covers tin, gold, lead, zinc, iron, copper, nickel, silver, bauxite, and phosphate.
- Net forest depletion 0.03% Product of unit resource rents and the excess of roundwood harvest over natural growth.
Total = Adjusted Net Savings (ANS) 7.2% Net national saving plus education expenditure and minus energy depletion, mineral depletion, net forest depletion, carbon dioxide damage, and particulate emissions damage.
Figure 2. The world’s gross savings vs. adjusted net savings, 1970 – 2008.
Data Source: the World Bank.23
Criticisms of the World Bank’s adjusted wealth and adjusted net savings have been similar to those of GPI. It should be noted that adjusted wealth estimates estimate “stocks” and thus complement the “flow” estimates of GPI.
5.2.5. UN Commission for Sustainable Development (CSD) - Indicators of sustainable development
In 1995, in response to the call of CSD, the Division for Sustainable Development and the Statistics Division, both of the United Nations Department of Economic and Social Affairs, in close collaboration with experts from international organisations and UN member states, developed a set of 134 national Indicators of Sustainable
Development (CSD Indicators). From 1996 to 1999, 22 countries from across the world pilot-tested the indicator set. In order to facilitate this process, the DSD developed guidelines for the implementation of the CSD indicators, initiated a series of regional training workshops, and encouraged the organization of national workshops and twinning arrangements between testing countries.
The CSD Indicators and their methodology24 have since been revised twice, in 2001 and in 2006. The current CSD indicators contain a core set of 50 indicators, and these core indicators are part of a larger set of 96 indicators of sustainable development. The indicators reflect the chapters of Agenda 21 and were originally developed on the basis of the pressure-state-response-model. Pressure-State-Response-model was developed by OECD. It was first used in the organisation’s preliminary set of environmental indicators in 1991. It is based on the fact that humans exert pressures on the ecosystem and the society, which alter their state and call for certain responses.
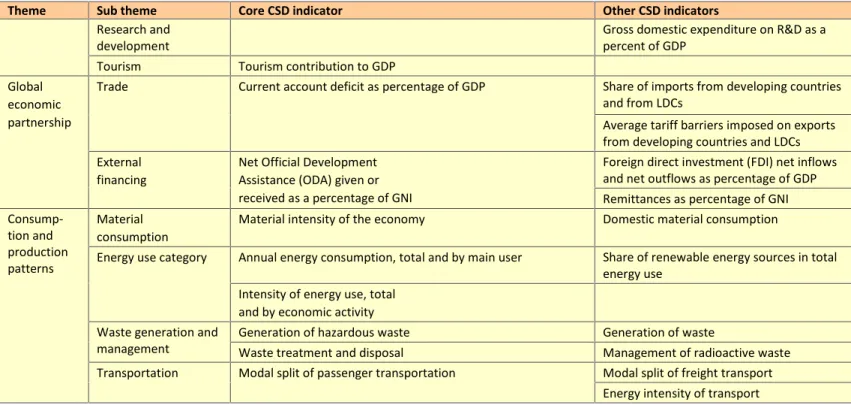
In 2006, the indicators were modified to reflect 14 themes and sub-themes: poverty; natural hazards; economic development; governance; atmosphere; global economic partnership; health; land; consumption and production patterns; education; oceans, seas and coasts; demographics; freshwater; biodiversity (
Table 6. UN
CSD sustainable development indicators.
Table 6).Table 6. UN CSD sustainable development indicators.
Theme Sub theme Core CSD indicator Other CSD indicators
Poverty Income poverty Proportion of population living below national poverty line Proportion of population below $1 a day Income inequality Ratio of share in national income of highest to lowest quintile
Sanitation Proportion of population using an improved sanitation facility Drinking water Proportion of population using an improved water source Access to energy Share of households without electricity or other modern
energy services Percentage of population using solid fuelsfor cooking
Living conditions Proportion of urban population living in slums Governance Corruption Percentage of population having paid bribes
Crime Number of intentional homicides per 100,000 population
Health Mortality Under-five mortality rate Healthy life expectancy at birth
Life expectancy at birth
Health care delivery Percent of population with access to primary health care
facilities Contraceptive prevalence rate
Immunization against infectious childhood diseases Nutritional status Nutritional status of children
Health status and risks Morbidity of major diseases such as HIV/AIDS, malaria,
14
-Theme Sub theme Core CSD indicator Other CSD indicators
Education Education level Gross intake ratio to last grade of primary education Life-long learning Net enrolment rate in primary education
Adult secondary (tertiary) schooling attainment level
Literacy Adult literacy rate
Demo-graphics Population Population growth rateDependency ratio Total fertility rate
Tourism Ratio of local residents to tourists in major
tourist regions and destinations Natural
hazards Vulnerability tonatural hazards Percentage of population living in hazard prone areas Disaster preparedness
and response Human and economic loss due to naturaldisasters
Atmosphere Climate change Carbon dioxide emissions Emissions of greenhouse gases
Ozone layer depletion Consumption of ozone depleting substances
Air quality Ambient concentration of air pollutants in urban areas
Land Land use and status Land use change
Land degradation
Desertification Land affected by desertification
Agriculture Arable and permanent cropland area Fertilizer use efficiency
Use of agricultural pesticides Area under organic farming
Forests Proportion of land area covered by forests Percent of forest trees damaged by
defoliation
Area of forest under sustainable forest management
Oceans, seas
and coasts Coastal zoneFisheries Percentage of total population living in coastal areasProportion of fish stocks within safe biological limits Bathing water quality
Marine environment Proportion of marine area protected Marine trophic index
Area of coral reef ecosystems and percentage live cover
Freshwater Water quantity Proportion of total water resources used Water use intensity by economic activity
Water quality Presence of faecal coliforms in freshwater Biochemical oxygen demand in water
bodies
Wastewater treatment Biodiversity Ecosystem Proportion of terrestrial area protected, total and by ecological
region Management effectiveness of protectedareas
Area of selected key ecosystems Fragmentation of habitats
Species Change in threat status of species Abundance of selected key species
Abundance of invasive alien species Economic
Develop-ment
Macroeconomic
performance Gross domestic product (GDP) per capitaInvestment share in GDP Gross savingAdjusted net savings as percentage of gross national income (GNI)
Sustainable public
finance Debt to GNI ratio
Employment Employment-population ratio Vulnerable employment
Labor productivity and unit labor costs
Share of women in wage employment in the non-agricultural sector
Information and communication technologies
Internet users per 100 population Fixed telephone lines per 100 population
Mobile cellular telephone subscribers per 100 population
Theme Sub theme Core CSD indicator Other CSD indicators
Research and
development Gross domestic expenditure on R&D as apercent of GDP
Tourism Tourism contribution to GDP
Global economic partnership
Trade Current account deficit as percentage of GDP Share of imports from developing countries
and from LDCs
Average tariff barriers imposed on exports from developing countries and LDCs External
financing
Net Official Development Assistance (ODA) given or received as a percentage of GNI
Foreign direct investment (FDI) net inflows and net outflows as percentage of GDP Remittances as percentage of GNI
Consump-tion and production patterns
Material
consumption Material intensity of the economy Domestic material consumption
Energy use category Annual energy consumption, total and by main user Share of renewable energy sources in total energy use
Intensity of energy use, total and by economic activity Waste generation and
management Generation of hazardous wasteWaste treatment and disposal Generation of wasteManagement of radioactive waste
Transportation Modal split of passenger transportation Modal split of freight transport
Energy intensity of transport
Source: UN (2006)25. Note: 2006 revision.
The CSD Indicators have assisted member States in their work of reviewing their existing indicators or developing new indicators to measure progress towards nationally defined goals for sustainable development. They continue to be a source of reference for future work in this area. In fact, many of the CSD indicators are needed to calculate the aggregate progress indicators presented in this chapter.
5.2.6. United Nations Statistical Commission - the System of Environmental-Economic Accounting project (SEEA)
A multi-year process of revision to the System of Environmental-Economic Accounting (SEEA) was initiated by the UN Statistical Commission in 2003. The revised SEEA consists of three parts: the Central Framework, which was adopted by the UN Statistical Commission as the first international standard for environmental-economic accounting; Experimental Ecosystem Accounting and Applications and Extensions of the SEEA. Subsystems of the SEEA framework elaborate on specific resources or sectors, including: energy, water, fisheries, land and ecosystems, and agriculture. These sub-systems are fully consistent with the over-arching SEEA, but provide further details on specific topics and try to build bridges between the accounting community and the community of experts in each specific subject area.26
Global consultation on the SEEA Central Framework completed in 2011 and it was adopted by the United Nations Statistical Commission, at its 43rdSession in 2012,
as the first international standard for environmental-economic accounting. The white cover version of the SEEA Central Framework was published in May 2012. Work on the additional portions of the SEEA, namely Experimental Ecosystem Accounts and Applications and Extensions, was presented in the 44thSession of the Statistical Commission in February 2013.
Table 7. SEEA classification of environmental activities.
Group Classes
Environ-mental protection
Protection of ambient air and climate Wastewater management
Waste management
Protection and remediation of soil, groundwater and surface water
Noise and vibration abatement (excl. workplace protection)
Protection of biodiversity and landscapes
Protection against radiation (excluding external safety) Research and development for environmental protection
Other environmental protection activities Resource
manage-ment
Management of mineral and energy resources Management of timber resources
Management of aquatic resources
Management of other biological resources (excl. timber and aquatic resources)
Management of water resources
Research and development activities for resource management
16
-Source: UN et al. (2012)27
By its very design the SEEA focus on the economy and environment and does not aim to capture the social dimension of sustainable development. Table 7 provides an overview of which environmental issues are covered in the SEEA. The advantage of the SEEA is that it is fully consistent with the national accounts and that it is has been standardized and agreed at the UN level.
5.2.7. Joint UNECE/OECD/Eurostat Working Group on statistics for sustainable development – Task Force on measuring sustainable development
In 2009, the Joint UNECE/Eurostat/OECD Working Group published its work on measuring sustainable development. The report proposed a broad conceptual framework for sustainable development measurement based on capital. The capital approach to measure sustainability aims at accounting for a broader set of capital assets than those assets already recognized in the current System of National Accounts (SNAs). In particular, a set of environmental assets, human capital and social capital are added. The group proposed a set of sustainable development indicators as a basis for international comparisons. The set is consistent with both the capital approach and common elements of existing policy-based indicator sets. The set
takes into account monetary indicators of economic wealth and physical indicators of climate, air quality, water quantity/quality, ecological integrity, biological diversity, educational attainment and health status. It should be noted, however, that no indicators related to social capital were included.
Table 8 presents a “small set of sustainable development indicators that might be consistent with the capital approach, relevant from the policy perspective and suitable for comparing performance among countries”28 that was proposed by the group in 2009.
A Task Force for Measuring Sustainable Development was set up in 2009 to further develop the capital approach with a broader perspective to include the distributional and quality-of-life aspects of sustainable development. Work has advanced on the measurement of human and social capital and in refining the set of sustainable development indicators proposed by the Working Group. At present, the analysed set of sustainable development indicators cover the "needs of the present generation", the "needs of the future generations" and the "international dimension". In 2013, the working group published three recommended indicator sets – one small set of 24 indicators (Table 9) and another two with 60/90 indicators arranged by either themes or concepts.29
Table 8. “Small set” of indicators proposed by UNECE, Eurostat and OECD in 2009
Indicator domain Stock indicators Flow indicators
Foundational
well-being Health-adjusted life expectancyPercentage of population with post-secondary education Index of changes in age-specific mortality and morbidity (placeholder)Enrolment in post-secondary education
Temperature deviations from normal Greenhouse gas emissions
Ground-level ozone and fine particulate concentrations Smog-forming pollutant emissions Quality-adjusted water availability Nutrient loadings to water bodies
Fragmentation of natural habitats Conversion of natural habitats to other uses Economic
well-being Real per capita net foreign financial asset holdingsReal per capita produced capital Real per capita investment in foreign financial assetsReal per capita net investment in produced capital Real per capita human capital Real per capita net investment in human capital Real per capita natural capital Real per capita net depletion of natural capital
Reserves of energy resources Depletion of energy resources
Reserves of mineral resources Depletion of mineral resources
Timber resource stocks Depletion of timber resources
Marine resource stocks resources Depletion of marine resources
Source: UNECE et al. (2009)28
Table 9. “Small set” of indicators proposed by UNECE/Eurostat/OECD task force on measuring SD in 2013
Theme Indicator No. of countries for
which data available Data source
Subjective well-being Life satisfaction 135 World Happiness Database
Consumption and
income Final consumption expenditure Official Development Assistance (ODA) paid 210143 UNWorld Bank
Theme Indicator No. of countries for
which data available Data source
Income inequality 134 UN MDG database
Gender pay gap 68 UN
Nutrition Obesity prevalence 160 UN
Health Life expectancy at birth 185 UN
Labour Employment rate 145 UN
Education Educational attainment 184 UN
Housing Living without housing deprivation 91 UN MDG database
Leisure Leisure time 20 Multinational Time Use Survey Database
Physical safety Death by assault/homicide rate 186 UN
Land and ecosystems Bird index 214 World Bank WDI
Water Water abstractions 93 UN
Air quality Urban exposure to particulate matter 173 UN
Climate GHG-emissions 229 World Bank
Energy resources Energy consumption 187 UN
Non-energy resources Domestic material consumption 200 Sustainable Europe Research Institute
Trust Generalised trust 82 World Bank WDI
Institutions Voter turnout 194 Int’l Inst. for Democracy and Electoral Assistance
Physical capital Gross capital formation 156 UN
Knowledge capital R&D expenditures 116 UN
Financial capital Consolidated government debt 84 World Bank WDI
Source: UNECE et al. (2013).29
5.2.8. OECD Better Life Initiative: Measuring well-being and progress
Building on almost ten years of work on measuring progress, including the Istanbul Declaration in 2007, the OECD launched The OECD Better Life Initiative. This initiative presented a set of well-being indicators. It combined various work streams, including a compendium of OECD well-being indicators and the “How’s Life?”-report. The indicator set included in the Better Life Initiative will be improved over the years, in line with the outcomes of methodological OECD projects. The conceptual framework of the Better Life Initiative identified three pillars for understanding and measuring the well-being of individuals and households: (i) material living conditions; (ii) quality of life; (iii) and sustainability. The approach drew closely on the framework recommended by the Stiglitz-Sen-Fitoussi Commission on measuring progress and on previous OECD work and is consistent with the approach proposed by the Sponsorship Group of Eurostat. Table 10 provides an overview of the components of OECD’s Better Life Index.
Table 10. Components of OECD’s “Better Life Index”
Component Indicator
Material well-being
Income and
wealth Household net adjusted disposableincome Household net financial wealth
Jobs and Employment rate
Component Indicator
earnings Personal earnings Job security
Long-term unemployment rate
Housing Rooms per person
Dwellings without basic facilities Housing expenditure
Quality
of life Healthstatus Life expectancySelf-reported health Work-life
balance Employees working very long hoursTime devoted to leisure and personal care
Education
and skills Educational attainmentsYears in education Student skills
Social
connections Social network support Civic engagement and governance Consultation on rule-making Voter turn-out Environment
al quality Air pollutionSatisfaction with water quality Personal
security Reported homicidesAssault rate Subjective
well-being Life satisfaction
Sustain-ability of
well-Natural
capital Mineral and energy resources; land; soilresources; timber resources; aquatic resources; other biological resources;