Evaluation of the Technical Basis for
New Proposals of Fatigue Design of
Nuclear Components
2011:04
Authors: Jessica Strömbro
Magnus Dahlberg
SSM perspective
Background
During the recent years fatigue analysis procedures for nuclear compo-nents have been investigated. The most common method so far has been the American code ASME III. The basis for the current design procedu-res in ASME III is quite old and has now been evaluated against modern data leading to the proposal of modified design curves.
Also the effect of the environment has been the subject of intense study in USA, Japan and elsewhere. Several reports indicate a potentially large influence of the environment, leading to the proposal of entirely new calculation procedures.
The background for the new design curves and the environmental effect procedures are evaluated in this report.
Objectives
The principal objective of the project is to use the latest research results regarding the design of fatigue to evaluate the technical basis for new proposal regarding an update of fatigue curves and the correction for environmental effects.
Results
• Argonne national Laboratory (ANL) in USA has performed a uni- que review of fatigue data. On basis of this review, ANL has propo-sed new fatigue design curves for austenitic steels, carbon steels and low-alloy steels. The proposals are based on comprehensive studies of data from several modern databases. The data has been consistently evaluated in this report.
• The ANL design curves are much more consistent with modern data for common austenitic steels, such as SS304/316 than the current ASME III design curves. The current ASME III fatigue de-sign curves for austenitic steels potentially contain smaller mar-gins than previously expected.
• An extensive amount of literature on environmental effects on fatigue has been studied. There is no doubt that LWR environment may significantly decrease the fatigue life in comparison to air environment.
• The environmental effects noticed in recent experiments conduc-ted mainly in Japan and USA were not explicitly included in the current design curves. Hence, there is a concern that the margins in the current ASME fatigue design procedure are smaller than expected.
• Applicable models for incorporating environmental effects in fatigue design calculations have been proposed in USA (ANL) and Japan (JSME). These models seem to incorporate the very complex phenomenon of environmental effects in a reasonable way.
• The controlling parameters in these models are temperature and strain rate, in addition, for carbon and low-alloy steels, the sulp-hur content in the steel as well as the dissolved oxygen content in the water.
• The decrease in fatigue life is caused primarily during growth of micro-structurally short cracks. Environmental effects decreases as the cracks grow larger (> 200 µm).
Need for further research
The results of this project will be used by SSM in safety assessments of fatigue loaded components. More research is needed for the further investigation of influencing parameters of the fatigue design curves and to find out the real margin in the ASME III fatigue design procedure.
Project information
Contact person SSM: Björn Brickstad Reference: SSM 2009/4144, 2037028-02
Project organization: Inspecta Technology AB has managed the project with Dr Magnus Dahlberg as the project manager. Dr Jessica Strömbro at Inspecta Nuclear AB has been the principal investigator.
2011:04
Authors: Jessica Strömbro, Inspecta Nuclear AB, Stockholm, Sweden Magnus Dahlberg, Inspecta Technology AB, Stockholm, Sweden
Evaluation of the Technical Basis for
New Proposals of Fatigue Design of
Nuclear Components
This report concerns a study which has been conducted for the
Swedish Radiation Safety Authority, SSM. The conclusions and view-Table of content
Page
1
INTRODUCTION ... 2
2
FATIGUE CURVES ... 3
2.1
Current fatigue curves and philosophy ... 3
2.2
Review of the fatigue data according to ANL in NUREG/CR-6909 ... 5
2.3
Review of the margins of the ASME fatigue design curves according
to ANL ... 8
2.4
ANL proposed design curves in air ... 10
2.5
Discussion on the Fatigue curves in air ... 12
2.5.1 General Philosophy ... 12
2.5.2 The applied margins (transferability factors) on the mean curves... 13
2.5.3 The discrepancy for austenitic materials ... 14
2.6
Alternative procedure by EN 13445-3 ... 17
2.7
On margins in fatigue design analyses with ASME ... 19
3
ENVIRONMENTAL EFFECTS IN LWR CONDITIONS ... 20
3.1
Background ... 20
3.2
Experimental results ... 20
3.2.1 Strain range ... 22
3.2.2 Strain rate ... 22
3.2.3 Temperature ... 24
3.2.4 Dissolved Oxygen ... 25
3.2.5 Sulphur ... 27
3.2.6 Flow rate ... 27
3.2.7 Strain holding ... 29
3.2.8 Surface roughness ... 30
3.2.9 Heat treatment ... 31
3.2.10 Crack initiation and crack growth ... 32
3.2.11 Mechanism ... 33
3.3
Models ... 35
3.3.1 Model proposed by JSME ... 35
3.3.1.1 Carbon and low-alloy steels ... 35
3.3.1.2 Austenitic stainless steels ... 37
3.3.1.3 Nickel-base alloys ... 38
3.3.2 Model proposed by ANL ... 39
3.3.2.1 Carbon and low-alloy steels ... 40
3.3.2.2 Austenitic stainless steels ... 41
3.3.2.3 Nickel-base alloys ... 42
3.3.3 Calculation of cumulative usage factor ... 43
3.4
Discussion ... 44
3.4.1 Comparisons between models ... 44
4
CONCLUSIONS ... 52
1 INTRODUCTION
Some parts of the common fatigue analysis procedure for nuclear components (ASME III) have been under investigation in recent years. These investigations have focused mostly on the fatigue design curves and environmental effects. The fatigue design curves are today quite old, and have been evaluated against modern data leading to the proposal of modified design curves.
The effect of the environment has been the subject of intense study in USA, Japan and elsewhere. Several reports indicate a potentially large influence of the environment, leading to the proposal of entirely new calculation procedures.
The background for the new design curves and the environmental effect procedures are evaluated in this report. Some other effects are also discussed. The initially stated scope of the project concerned the following:
Design curves and their background for austenitic and ferritic steels.
Environmental effects
The influence of residual stresses
Criteria for multi-axial fatigue
Factors for plastic deformation effects
The scope of the project was somewhat altered during the course of the project. Environmental effects turned out to be of crucial interest. Hence, the study of these effects was increased at the expense of residual stresses, multi-axial effects and plastic deformation. In hindsight this modification seems entirely right, taken the strong interest in the environmental effects from both SSM and the industry. Two interim reports have been previously released in this project, on request by SSM.
2 FATIGUE CURVES
2.1 Current fatigue curves and philosophy
The most widely used design procedure for NPP components is that presented in the ASME Section III Division 1 code [1]. Notably, these curves were established on basis of strain controlled fatigue tests on small specimen in air, the so called Langer experiments. The tests were interrupted by complete failure of the specimen. Mean fatigue curves where derived form the test. Fatigue curves in terms of stresses were obtained by multiplying the total strain with the elastic modulus. The relation between the (fictitious) stress amplitude and number of cycles to failure are formally written as
e f a
S
N
B
S
0.5
. (1)The mean curves can hence be expressed by the different values of B and Se. In (1),
S
a representsstress amplitude and Nf represents the number of cycles to failure.
Table 1 Mean curve Langer data. Parameters B and S
efor Eq. (1).
Material type
B
(GPa)
S
e(MPa)
Carbon steel
59.734
149.2
Low-alloy steel
49.222
265.4
Austenitic steel SS
58.020
299.9
In ASME III [1], the design fatigue curves have been obtained from the laboratory tests by reducing the fatigue life at each point on the curve by a factor of 2 on strain (or stress) or 20 on cycles, whichever is the more conservative. Cooper [2] noted that the intent of introducing these factors was to account for such factors as data scatter (including material variability), differences in surface condition and size differences between the test specimens and the actual components. Cooper further noted that the factors of 2 and 20 were not safety margins but rather uncertainty factors or transferability factors that should be applied to the small–specimen data to obtain reasonable estimates of the lives of actual reactor components. He believed that the factor 20 was made up from the product of the following three uncertainties:
Material variability and scatter on data between the minimum and mean, 2.0
Size effects (difference in scale between laboratory samples and plant), 2.5
Surface finish, atmosphere (moderate environmental effects), metallurgy, etc. 4.0
However, whatever the historical origin of the safety factors in the ASME design codes, the fatigue design curves have been adopted in both the French RCC-M and German KTA codes and so are widely used around Europe.
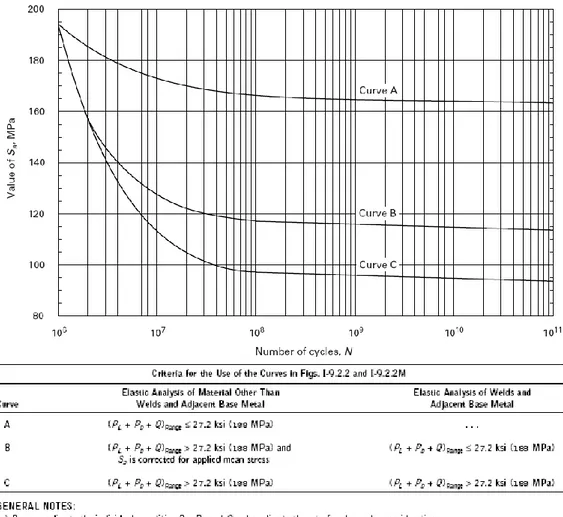
Initially, the design curves where intended for lives with N < 106. The design curve for austenitic steels where later on extended for longer lives. This design curve included no mean stress correction, unlike the other curves. A greater need to correct for mean stress in the high cycle regime even for austenitic steels was identified. The effects of mean stress were possibly taken into account using a correction according to the empirical Goodman correction[1], which involves ultimate strength, yield strength and mean stress.
choosing either curve A, B or C are shown in Figure 3. In fact, curves B and C are adopted to match the Jaske curves[4] depicted in Figure 10. The Curve B then corresponds to Jaske’s data without mean stress correction, whereas curve C corresponds to Jaske’s data corrected for maximum mean tensile stress by a Goodman correction.
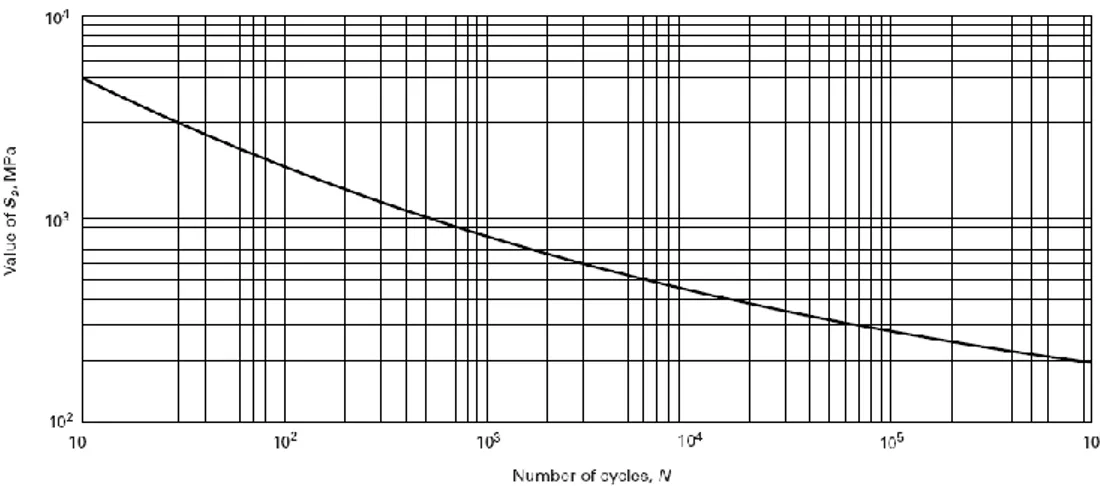
Figure 1. ASME fatigue curves for carbon steels, low-alloy steels etc.
Figure 3. ASME fatigue curve for austenitic steels etc. Valid for N > 106. Choice of curve A, B and C is based on configuration and on the level of mean stress, stress range and presence of weld, as described in the figure.
2.2 Review of the fatigue data according to ANL in
NUREG/CR-6909
Alongside the study of environmental effects, an extensive review of the fatigue curves where carried out by ANL in NUREG/CR-6909 [3]. There had been previous concern about the fatigue curves for austenitic steels already in the 70’s. A major study was preformed by Jaske and O’Donnel [4], where some potential non-conservatism of the original fatigue curves for austenitic steels was identified. The new experiments gave mean curves that deviated from the Langer curves. This deviation has been confirmed in several other studies. ANL studied large sets of data from several different sources. Mean curves where established on the form
Here,
a is the strain amplitude and N is the number of cycles to failure. This equation provides the basis for the ANL model. The parameters A, B and C in (2) are constants to be determined. C represents the fatigue limit, B represents the exponent and A basically represents the low-cycle fatigue behavior. By adopting these parameters to the fatigue data, ANL-models were obtained for the different material types. An extensive analysis on the parameters controlling the fatigue life of components was also made. Such parameters are size effects, surface roughness effects, mean stress effects, loading history effects and material scatter. The interruption criterion in modern tests is somewhat different in modern experiments, than those used by Langer. A drop in tensile stress of 25% (corresponding to a certain drop of stiffness, since the experiment is in strain control) is used as criterion. Most specimens are cylindrical with a size of 5-10 mm. The drop of 25% corresponds approximately to a crack of size 3 mm deep.New design curves are proposed on basis of the ANL-models, see Figures 4 and 5. The investigation showed that the code mean curves for non-austenitic steels all are adequate, in line with the proposed ANL-curves, or even somewhat conservative. The mean curves were derived in room temperature. The fatigue lives are shortened for higher temperatures, but should be well covered within the transferability factors.
Figure 4. Data for carbon steel and low-alloy steel in room temperature. The ASME Code mean curve and the ANL-curve are in agreement.
Figure 5. Data for carbon steel and low-alloy steel in high temperature. The influence of high temperature, up to 300oC, is included in the transferability factors.
The situation for austenitic steels is more problematic. The ANL investigation of experiments in air confirmed that the Langer mean curve is consistently higher than most data collected over the past 30 years. This discrepancy concerns data for N > 104. This is readily shown in Figure 6 below. This discrepancy is not new, and has been demonstrated in earlier studies, see for example Figure 7.
Figure 7. Comparison of data with the ASME design curve for stainless steel.
Fatigue data for Ni-Cr-Fe alloys and corresponding weld materials (for example Alloy 600 and weld material Alloy182) are also discussed in NUREG/CR-6909 [3]. The data are consistent with the ANL proposal for austenitic materials. Hence, the ANL design curve for austenitic materials applies for these materials as well.
2.3 Review of the margins of the ASME fatigue
design curves according to ANL
The NUREG/CR-6909 report also included a thorough review of the transferability factors of 2 on strain (or stress) or 20 on cycles. The analysis is performed by reconsidering the influence of the parameters, Data scatter and material variability, size effects and surface factors. These were the factors that had been previously considered by Cooper for the current ASME fatigue curves. Additionally, ANL considered the effect of loading history. It is well known that the order of higher and lower loads in a spectrum may affect the fatigue life. The comparison was made carefully for lives within the low-cycle regime. The existing database was employed for the study.
Table 2. Factors on life (transferability factors) to account for various effects between specimen and component.
Parameter
ASME (Cooper)
ANL Study
Material variability and Data Scatter
(minimum to mean)
2
2.1-28
Size effects
2.5
1.2-1.4
Surface finish, moderate
environmental effects, metallurgy, etc
4
2.0-3.5
Loading history
-
1.2-2
Total Adjustment
20
6.0-27.4
As shown in the above table the variation in the factors can be relatively large. In order to estimate the most appropriate values, statistical distribution were attempted for each parameter. This allowed for (numerical) statistical calculation of the total adjustment. The calculations were carried out by
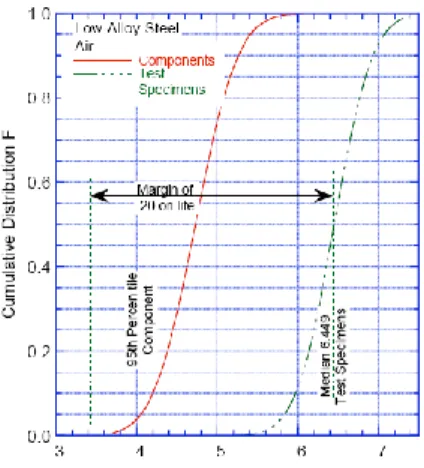
Monte-Carlo simulations, with the statistical distribution of each factor as input. The computations lead to an estimate of the modification of the fatigue life of the specimens to a component that is hypothetically affected the parameters in Table 2. The results are expressed in terms of the parameter A in Eq. (2), i. e. the parameter that primarily controls the low-cycle fatigue life. The condition set up for the factor on life was that the total adjustment should bound the life of 95% of the component population. The calculations were performed for each material type. The results are shown below in Figure 8.
Figure 8. Distribution of the parameter A the ANL-model, for specimens and components in air.
By these calculations, the factor on life (or margin on life) can be estimated for all material types. In fact, the results were quite similar for all material types. The results are comprised in the below Table 3. The results have lead to the suggestions that the new design curves should have a safety factor of 12 instead of 20 on life. Note from that a factor of 20 instead of 12 would lead to a very low probability of failure. See chapter 2.5.2 for a further discussion on margins in design curves.
Table 3. The margin on life in order to bound the fatigue life of 95% of the component population.
Material Computed Margin
on life
Carbon steel 12.6
Low-alloy steel 11.0
2.4 ANL proposed design curves in air
On basis on the investigation of fatigue data and margins of life new design curves were proposed. The strategy for the fatigue curves can be summarized as follows. The mean fatigue curves are determined by adjusting the ANL-model (
ln(
N
)
A
B
ln(
a
C
)
, Eq. (2), to the strain-life data in the database. The parameters A, B and C for the mean curves are shown in the table below.Table 4. Mean curve ANL data. (Applies for strains in per cent)
Material type A B C
Carbon steel 6.583 1.975 0.113
Low-alloy steel 6.449 1.808 0.151
Austenitic steel SS 6.891 1.920 0.112
In order to establish the design curves the mean curves are first divided by the factor 12 on life or the factor 2 on strain/stress whichever is the most conservative. Thereafter the curves are corrected for the potential presence of a tensile mean stress, by a version of the Goodman relation, assuming fully developed tensile mean stress. The adjusted allowable stress amplitude,
a,adj, is obtained by
y b a b
a y a a a ya
a
,adj 1 1 for , ,adj for , with
a denoting the non-adjusted stress amplitude,
y the yield stress, and
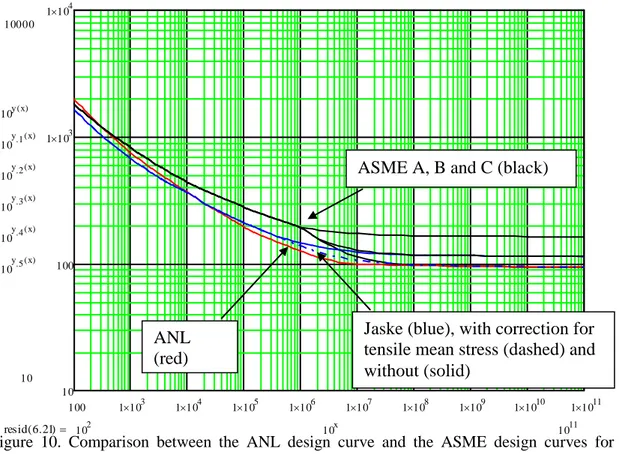
b denoting the ultimate strength.For non-austenitic steels the ANL curves are less conservative than the ASME design curve, see Figure 9.The situation is the opposite for the austenitic materials. Here, the ANL design curve is more conservative. The difference between ASME and ANL is considerable in the high cycle regime, especially in comparison with the ASME design curve A. In Figure 10, the ANL curves are compared with the ASME curves. Additionally, the Jaske [4] proposed design curves are shown as well. Jaske provided curves based on the option of zero or maximum compensation for tensile mean stresses. It is noted that the Jaske curve corrected for mean stress and the ANL curve is in very good agreement, despite the fact that Jaske uses the factor 20 on life and ANL the factor 12. For lives N < 104 the difference between all curves is rather limited.
Figure 9. Comparison between the ANL design curves and the current ASME design curves for the non-austenitic material. The ANL design curves are denoted ANL model & Eq. 17 and 18 (which indicate the method for mean stress affects).
Figure 10. Comparison between the ANL design curve and the ASME design curves for austenitic steels. 100 1 10 3 1 10 4 1 10 5 1 10 6 1 10 7 1 10 8 1 10 9 1 10 10 1 10 11 10 100 1 10 3 1 10 4 10000 10 10y x( ) 10y.1 x ( ) 10y.2 x( ) 10y.3 x( ) 10y.4 x ( ) 10y.5 x ( ) 1011 102 10x resid 6.21( )
ASME A, B and C (black)
Jaske (blue), with correction for
tensile mean stress (dashed) and
without (solid)
ANL
(red)
2.5 Discussion on the Fatigue curves in air
2.5.1 General Philosophy
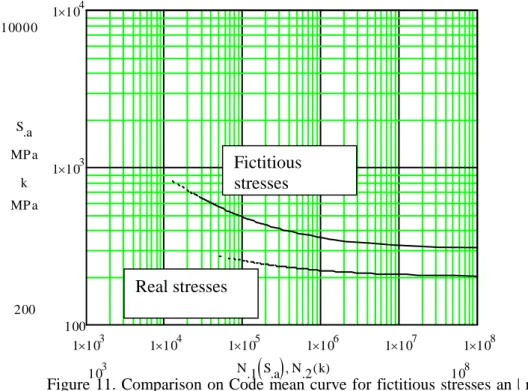
Central in the fatigue design philosophy of ASME[1] is that the design curves are derived from strain controlled experiments on small, non-notched specimen in laboratory environment. Since the fatigue curves where derived by strain control, all comparison between computed strains and fatigue curve should be based on strains. In classical design situations however, stresses are computed by an elastic analysis. The stresses are then corrected for stress raisers and possible plastic effects, for example as guided by ASME III NB3200 for design by analysis or NB 3600 for design of piping. Thus an indirect comparison of strains is performed. This works well for components subjected to a load primarily in deformation control, which is the case for thermal loads which is a prime concern for NPP components. As soon as a portion of the total strains is plastic, the stress amplitudes in Eq. (1) will be fictitious and deviate substantially from the real stress. This is important especially for austenitic steels with considerable plastic deformation even near the fatigue limit. This is exemplified by the below figure were the real stresses are computed by the stress-strain relation for SS316 proposed by van Eeten [5]. The strain amplitudes are converted to the real stress amplitudes instead of the fictitious stresses which are obtained by multiplying with the elastic modulus, E. The real stresses are compared to the fictitious stresses and a significant difference is observed even in the high cycle regime.
Figure 11. Comparison on Code mean curve for fictitious stresses and real stresses for an SS 304/316 type austenitic steel.
The use of machined, smooth small specimen also has implication for the applicability of the fatigue design procedure. The fatigue process may be different than that in real component where the fatigue strength may be governed by inherent defects or other defects that may arise during operation. Fatigue life has conventionally been divided into two stages: initiation and crack propagation. This distinction has no clear definition. For a smooth surface initial crack nucleate and propagate in the maximum shear direction. During this stage, stage I, the cracks interact strongly with the microstructure of the material. The cracks are called micro-structurally short cracks. These cracks may grow rapidly in the beginning but be retarded in the interaction with for example grain boundaries. Thereafter the cracks then propagate as mechanically short cracks, stage II. These cracks are much more insensitive to the
1 10 3 1 10 4 1 10 5 1 10 6 1 10 7 1 10 8 100 1 10 3 1 10 4 10000 200 S.a MP a k MP a 108 103 N.1 S.a
N.2 k( )Fictitious
stresses
Real stresses
microstructure and may continue to grow. Cracks in stage II may for example be analyzed with fracture mechanics (even though there are some limitations).
For many components the presence of cracks will mean that the fatigue process may start well within stage II or even larger cracks. During its fatigue life the component may never encompass nucleation and stage I, which may have been a major part of the fatigue life of the specimen. Materials that are resistant to crack initiation may be much more sensitive to crack propagation. A typical example is high strength steel that in comparison gives high fatigue limits for smooth specimen, but where the fatigue properties may rapidly decrease with the presence of defects and cracks. The ranking of fatigues strength may however be altered once there is a presence of defects and sharp stress raisers. This immediately makes the question of transferability of fatigue data more complicated. Even though NUREG/CR-6909[3] investigates many factors, the influence of welds and other stress raisers are still uncertain.
ASME III provides different levels of analysis. This may lead to different fatigue design lives of a specific component, due to the choice of analysis level. Today, detailed analyses are performed which allows for more detailed resolution of the stresses. The fatigue design process involves many more considerations than just the choice of fatigue curves. Handling of stress raisers, load determination, cyclic plasticity etc, has a large influence on the results. Thus a large part of the real margins in the ASME III procedure are controlled by other factors than those investigated in NUREG/CR-6909 [3].
2.5.2 The applied margins (transferability factors) on the mean curves
The investigation of the applied factors on life in NUREG/CR-6909 [3] is comprehensive. The factor 12 on life in the low cycle regime results from the ANL criterion that the failure probability should be 5% on the component level (see chapter 2.3). However, a failure probability of 5% can seem quite high. The corresponding failure probability in EN 13445-3 [6] is 0.5% (three standard deviations from the mean). No distinct explanation for this choice of probability is given in NUREG/CR-6909. However, the change from factor 20 to 12 on life in itself leads to no significant changes and the difference in the corresponding allowable stresses will be limited. In fact, the differences between the Langer curves and ANL curves for cycles < 104 are quite small, as shown in Figure 9 and Figure 10.
The investigation of the factors in the high-cycle regime is less penetrating in NUREG/CR-6909 [3]. This is a shortcoming for several reasons. In fact the uncertainties regarding material variability, data scatter, size effects, surface finish etc. are generally greater in the high cycle regime. Not the least important is the well documented tendency of spectrum load to lower the fatigue limit [7]. This means that load levels that do not accumulate fatigue damage in constant amplitude loading may do so as part of a load spectrum. Thus the need for margins in the high-cycle regime is still an open question. It’s importance is emphasized since the deviation between the Langer curves and ANL curves are the largest in the high cycle regime. A reasonably valid evaluation is obtained by comparing with the margins in EN 13445-3, where the margins are determined essentially by three standard deviations (3SD) from the mean data. To obtain this, EN 13445-3 establish a constant margin on stress range. This margin is computed for welded material in Figure 12 and is very near a factor of two. Even though the philosophy in EN 13445-3 is different, and the comparison is not strictly valid, this shows that the ASME III margin of a factor of two applied on strains (stresses) in the high cycle regime should be reasonable.
Figure 12. Estimation of margins on stress in EN 13445-3. It is noted that the margin is almost exactly a factor two. Figure from Maddox [8].
2.5.3 The discrepancy for austenitic materials
It has been concluded that the ANL curves, both mean curve and design, have been established by going through a large set of data. Moreover, the potential non-conservatism of the Langer curve had been observer much earlier. Thus there is no reason for questioning the results in NUREG/CR-6909, and the proposed fatigue curves are well supported by the background work.
The conclusion by ANL is that the Langer data are not representative for SS304/SS316 and similar austenitic stainless type steels. It is claimed by ANL that the difference between ANL and the Langer data depends on the higher yield strength for the Langer specimen. It is further claimed that this higher strength is not representative for today’s austenitic steels.
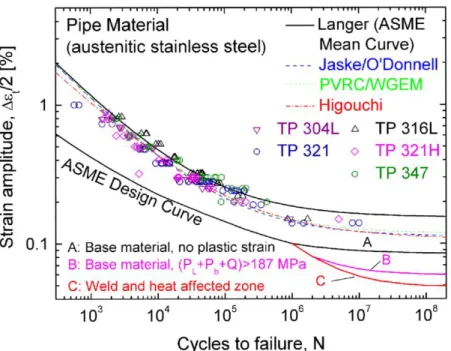
Solin et. al. [9] made fatigue tests on X6CrNiNb1810, which correspond to SS347. The tests were performed at VTT in Finland. This type of material is explicitly not included in the ANL data. However, it is customary believed that there is no significant differences between SS347 and SS304/316 in terms of fatigue properties. Solin et. al. claim that their tests show that the Langer data is still valid, and that their material batches are representative for primary loops in certain PWRs. The VTT results are shown in Figure 13 together with the ANL data.
Mean curve
-3SD
150 MPa 75 MPa
Figure 13. VTT data compared to Langer and ANL. Strain amplitude versus number of cycles to failure. The curve labeled Mean curve and yellow dots refer to the VTT data.
The yield strength of the VTT batch of austenitic material was determined to Rp0.2 = 240 MPa which is representative of this material. This does not much deviate significantly from the other SS materials 304/316. Hence, high static yield stress is hardly a cause for the difference.
The cyclic hardening data is compared from three sources; ANL [3], VTT [9] and Jiang et. Al. [10], and shown in Figure 14. All three data comes from room temperature cyclic data. Significant for the VTT data is the secondary cyclic hardening, which does not appear for the SS304/316 steels, ANL [3] and Jiang et. Al. [10]. This hardening occurs at all load levels for the VTT data, but is however most prominent for low load levels. For strain amplitudes just below the VTT fatigue limit, a 0.195%, the secondary hardening is pronounced from 105 load cycles and onwards, see Figure 14. The stress amplitude increases almost 50%. This hardening will significantly decrease the amplitude of cyclic plastic deformation and will significantly increase the fatigue life.
It is suggested by VTT that the HCF properties of X6CrNiNb1810 are improved both by secondary hardening and by a hardening effect from niobium carbides. This may explain the difference between a stabilized austenitic stainless steel and a low carbon grade austenitic steel, such as 304L/316L. To mitigate sensitization and IGSCC the tendency during recent decades was to shift from stabilized medium carbon austenitic stainless steel to low carbon austenitic grades, which may impair the HCF properties.
(VTT mean data) (ANL mean data)
(VTT data, with design margins) (ANL design curve)
Figure 14. Cyclic strain hardening/softening, ANL [3] and VTT [9] and Jiang [10].
In sum, it is highly likely that the strong secondary cyclic hardening in the VTT experiment is responsible for the higher fatigue strength in the VTT experiments as compared to the ANL data. The presence of cyclic hardening significantly decreases the amount of plastic strains in a prescribed strain load condition, thus decreasing the fatigue damage accumulation. There is no distinct explanation why this effect is prominent for some austenitic steels and not for others. A possible explanation is that the ANL data is supposed to contain mostly low carbon grade austenitic steels, while Langer data is older and, thus, may contain stabilized medium carbon grade austenitic steels, which may be one significant factor to explain the different HCF properties found. Further investigation is recommended. It is argued that component testing, involving realistic parameters, such as welds and variable amplitude loads could be utilized in order investigate the differences between the material types. It should be noted, however, that these differences only occur during constant amplitude loads. It is likely that variable amplitude load conditions will alter the effects of secondary hardening.
Jiang, et al,
ANL
VTT
Secondary hardening
2.6 Alternative procedure by EN 13445-3
It is noteworthy that the relatively new European standard EN 13445-3 [6] for non-nuclear pressure vessels has taken an entirely different approach to fatigue. The approach in EN 13345-3 is essentially based on the IIW recommendations [11]. The fatigue curves are based on stress controlled experiments on component-like specimen. The specimens contain different types of configurations or fatigue curves. The approach is essentially the same as used by the general design code Eurocode 3 [1213] and several other standards. A main difference is that the design curves in EN 13445-3 are converted to the use of three standard deviations below the mean curve (mean – 3SD) instead of two standard deviations (mean -2SD), as in the other codes, i. e. the IIW recommendations [11] and Eurocode 3 [12].
Figure 15. The fatigue design curves in EN 13445. The solid horizontal lines are the constant amplitude fatigue limits. The dotted lines are the curves to use under spectrum loading.
The standard provides a set of fatigue curves, see Figure 15. These curves are based on a statistical treatment of the experiments with different weld configuration, execution and geometry. The fatigue curve is specified by it’s FAT-class, which is defined by the stress range at N=2x10⁶
cycles. The procedure in EN 13445-3 does not explicitly demands for a fatigue reduction factor for the presence of welds. The influence of a particular weld is instead already included in the specific fatigue curve. The effects are included in the choice of FAT-class. The choice of FAT-class is based on the weld configuration, execution and geometry. EN 13445-3 provides charts and figures from which the FAT-class is determined. The exponent for the fatigue curve is m=3, regardless of FAT-FAT-class. Size effects and the influence of temperature are treated by separate correction factors. It is also noted that EN 13445-3 demands an extension of the fatigue curve for spectrum loads. This is done since it has been experimentally demonstrated in several studies that spectrum loads tend to lower the limit for fatigue damage to occur. See for example the study by Marquis [7]. The curve is extended from the constant
amplitude fatigue limit at N=5x10⁶ to a cut-off limit at N=108, with an exponent of m=5. In terms of stresses, the fatigue limit is lowered by factor of
5100
15 0.55.The approach in EN 13445-3 has some clear advantages over ASME III. The experiments on realistic specimens make the transferability to real components more accurate. Moreover, the approach has been subjected to several investigations. Probably this has to do with the approach being applied in several industries, where fatigue is a more prominent problem than in the nuclear industry. Hence the applicability of the approach in real applications is well documented. A thorough study was performed by Maddox [8], a study which included pressure vessel and piping components as well as other components. The studies intent was to evaluate the applicability of the procedures in EN 13445-3. Fatigue analysis for un-welded material in EN 13445-3 was initially covered by a special section, were the design curves are based on smooth specimen data, instead of a FAT-class. The fatigue curve is determined by the ultimate strength, which is supposed to correlate to the fatigue limit for smooth specimens. This concept was evaluated by Maddox. The ultimate strength correlation with the fatigue characteristics was much criticized by Maddox [8]. Firstly, Maddox showed that standard steel plates have fatigue characteristics almost equal to welds. See Figure 16 that contains test results for plates with and without welds. There is a potential risk that the smooth specimen concept tends to overestimate the fatigue strength for un-welded material also. Moreover, he showed that there is no experimental evidence from tests on realistic vessel components failing on un-welded material that any distinction should be drawn of different tensile strength. This is in conflict with the ASME design curves for carbon and low-alloy steels in Figure 1, with clearly higher long life fatigue strength for the higher ultimate strength. Maddox proposed a strategy based on the choice of FAT class, regardless of ultimate strength, which is in line with the IIW recommendations. EN 13445-3 now contains this approach as an option. However, the main drawback of the approach in EN 13445-3, is that it is less suited for deformation controlled fatigue as in thermal fatigue. The reason is the stress control load. For accurate thermal fatigue analysis the strain-life relation is needed.
Figure 16. Fatigue results for non-welded material. From Maddox [8]. Note that un-welded material (red squares) have the same fatigue strength as welded material (black dots).
2.7 On margins in fatigue design analyses with
ASME
A fatigue design analysis of a real component includes several steps and the analysis can be performed on several levels. For piping, ASME III, section NB3600 for piping presents a methodology that is fairly well defined. Plasticity corrections and fatigue reduction factors are given by tables and formulas, even though their values have been much discussed (see for example Grandemange [14]). ASME III, section NB3200 allows for design by analysis in a much more open way. Elastic analyses or elasto-plastic analysis verification may be performed. Little guidance on details is given. Hence, analysis results may vary, especially since estimation of fatigue reduction of welds and plastic deformation are very difficult. The current ASME fatigue curves include some rather arbitrary choice of curve depending on the presence of welds and means stress as shown in Figure 10. This problem has been solved by the introduction of the ANL curve which only has one curve. However, this curve takes into account full influence of compressive residuals stresses which may be a conservative in many cases.
It is commonly believed that the design loads in the analysis of NPP components are conservative. However, estimation of the conservatism in loads should need a separate investigation. The conservatism in the fatigue design analysis with accurately defines loads should be further investigated. It is notes that the ANL estimation of transferability factors (see Figure 8 and Table 3) assumes exact estimation of stress and strains, fatigue reduction factors etc. Estimation of these factors is a crucial part of fatigue design analysis. The influence of these factors should be further studied in order to considerably improve the understanding of the real conservatism (or lack of it). A suitable set of controlled tests of components should provide benchmark examples. In that respect the ASME procedure is poorly investigated in comparison to the EN 13345-3 for which there exists a generous source of tests for evaluating the procedure. Future studies on aspects on ASME fatigue philosophy should focus less on the small strain controlled specimen, and more on the fatigue of real components. The set-up of real component tests is fairly straight forward.
3 ENVIRONMENTAL EFFECTS IN
LWR CONDITIONS
3.1 Background
The effects of environmentally-assisted cracking (EAC) on for example the reactor pressure vessel and pipes are a key concern within the context of both reactor safety and evaluation/extension of plant service life. Based on the external, macroscopic loading conditions, three basic types of EAC can be differentiated; stress corrosion cracking (SCC), strain-induced corrosion cracking (SICC) and corrosion fatigue (CF). In this report we focus on corrosion fatigue, which is caused by cyclic loading (low- or high-cycle). Many failures of reactor components are caused by fatigue, examples are piping, nozzles, valves, control rod driving (CRD) and pumps [15-19]. In feedwater nozzles and piping the mechanism of cracking has been ascribed corrosion fatigue (CF) or strain-induced corrosion cracking (SICC) [15-19].
Subsection NB-3121 of Section III in ASME [1] explicitly notes that the data used to develop the ASME Code fatigue curves did not include tests in the presence of corrosive environments that might accelerate fatigue failure. Article B-2131 states that the owner’s design specifications should provide information about any reduction to fatigue design curves that is necessitated by environmental conditions.
3.2 Experimental results
Existing fatigue strain vs. life (ε-N) data illustrates potentially significant effects of LWR coolant environments on the fatigue resistance of carbon and low-alloy steel [20-35] as well as austenitic stainless steels [22, 23, 25, 26, 33, 36-41], see Figure 17. For all three material types, the fatigue life is reduced significantly only when certain parameters meet certain threshold values.
(a)
(b)
Figure 17. Strain amplitude vs. fatigue life data for (a) low-alloy steel and (b) austenitic stainless steel [3].
The fatigue data in LWR environments indicate that the key parameters that influence fatigue life in LWR environments for carbon and low-alloy steels are temperature, dissolved oxygen (DO) level in water, strain rate, strain (or stress) amplitude and for carbon and low-alloy steels, sulphur (S) content of the steel. It is shown that a significant decrease in fatigue life of carbon and low-alloy steels is
obtained when four key threshold conditions are satisfied simultaneously; applied strain range, service temperature and dissolved oxygen in the water are above a minimum threshold level, and the loading strain rate is below a threshold value. Although the microstructures and cyclic-hardening behaviour of carbon steels and low-alloy steels are significantly different environmental degradation of fatigue life of these steels is identical.
For both steels, environmental effects on fatigue life are moderate (i.e. a factor of two or lower) if any one of the key threshold conditions is not satisfied [3, 20, 31, 42].
For austenitic stainless steels, the fatigue life is decreased significantly when three threshold conditions are satisfied simultaneously; applied strain range and service temperature are above a minimum threshold level, and the loading strain rate is below a threshold value. The dissolved oxygen level in the water and possibly the composition and heat treatment of the steel are also important parameters for environmental effects on fatigue life [3].
For nickel-base alloys (Ni-Cr-Fe) the existing fatigue data in LWR environments are very limited; the effects of the key loading and environmental parameters on fatigue life of these alloys have been evaluated by Higuchi et al. [43], see Figure 18. The results indicate that environmental effects are strongly dependent on key parameters such as strain rate, temperature and dissolved oxygen level in water [3, 43]. The fatigue life reduction was found to be greater in PWR primary water than in BWR water [43].
Figure 18. Fatigue behaviour for alloy 690 and 152 Weld in simulated PWR water [3].
Environmental fatigue tests have also been performed for high strength materials (including carbon steel STS480 and low-alloy steel SQV2B). The test results confirmed that the environmental effects are not significant for these high strength materials [44-46].
There are some differences between BWR water and PWR water regarding actual water chemistry and also the temperature conditions [21, 36]. The BWR water is deionised water with very low electrical conductivity while the PWR water contains B (500 ppm) and Li (2 ppm) and indicates higher electrical conductivity [36]. BWR water also has higher dissolved oxygen level and usually lower temperature than PWR. Environmental effects on fatigue life in BWR water is more moderate compared to that in PWR water for austenitic stainless steel [36].
A great number of tests have been conducted mainly in Japan to identify and quantify the effects of environmental parameters [21-25, 27-34, 36, 38, 39, 43, 44, 47] but also in USA [20, 26, 35, 37, 38,
3.2.1 Strain range
A minimum threshold strain range is required for environmentally assisted decrease in fatigue life for carbon and low-alloy steels as well as austenitic stainless steels [20, 35, 48]. The threshold strain range appears to be almost independent of material type (weld metal or base metal) and temperature in the range of 250-325˚C [48]. Experiments on carbon and low-alloy steel indicate that the fatigue life reduction is independent of strain amplitude once the amplitude exceeds a threshold value [20] which most likely corresponds to rapture of the passive surface oxid film [20, 35, 38]. This need not imply that the observed threshold strain is the actual film rupture strain. Film rupture occurs at the crack tip and is controlled by the crack tip strain. The existing data for Ni-Cr-Fe are inadequate to define the threshold strain amplitude below which environmental effects on fatigue life do not occur, although experiments on carbon and low–alloy steels by Chopra and Shack showed threshold strain range at approximately 0.36%, see Figure 19.
Figure 19. Fatigue life plotted as a function of fraction of strain at high strain rate [48].
3.2.2 Strain rate
The effect of strain rate on fatigue life of carbon, low-alloy and austenitic steels in LWR environments is significant when the strain rate is positive and other key thresholds conditions, i.e. strain amplitude, temperature and dissolved oxygen content, are satisfied, see Figure 20 and Figure 21. When all threshold conditions are satisfied, the logarithm of fatigue life decreases linearly with decreasing logarithmic strain rate at least below 1%/s for carbon and low-alloy steels and below 0.4%/s for austenitic steels [3, 21, 28, 35, 43, 44, 47]. Because of the limited data for Ni-Cr-Fe the threshold strain rate below which environmental effects are significant cannot be determined from the present data, although it can be seen that the fatigue life of these alloys decreases linearly with decreasing strain rate [3, 43, 44, 47]. It was also found that the effects of water on the fatigue of Ni-base alloys were much smaller than for stainless steels [43].
Figure 20. Relation between strain rate and fatigue life for carbon steel [28].
(a)
(b)
Figure 21. Relation between Fen (Nair/Nwater) and strain rate in (a) BWR water and (b) PWR water [36].
The existing fatigue data indicate that a slow strain rate applied during the tensile-loading cycle is primary responsible for environmentally assisted reduction in fatigue life of these steels [3, 20, 35, 38]. Higuchi et al [28] has concluded that the strain rate in the strain decreasing part of the cycle does not affect the environmental fatigue life unless it becomes smaller than that of the increasing straining part of the cycle.
Higuchi et al [28, 33] have performed a series of strain controlled fatigue tests with the strain rate changed stepwise by three different waveforms (fast/slow-convex, slow/fast-concave, sawtooth) or continuously. It is shown that constant strain rate gives the shortest fatigue life if the rise time is the same and that taking the strain rate as average over the minimum to peak of the strain change is a conservative method. They stated that damage evaluation conducted based on the partial slow strain rate in the transient period will allow the cumulative damage to become excessively high. Higuchi et al. [33] have also performed fatigue tests with sine wave straining and the fatigue life of sine wave tests were always much higher than those of stepwise wave tests at the same rise time and strain amplitude.
Strain rate due to a thermal transient under actual plant operation is usually much less than 1 %/s, while strain rate due to an earthquake would considerably exceed 1 %/s [36]. Environmental effects are not considered for seismic loads since seismic load cycles are characterised by high strain rates of short duration [36, 44]. High-cycle fatigue due to high-frequency vibrations also has strain rates that are too high for significant environmental effects [40, 41].
3.2.3 Temperature
Experimental results indicate a threshold temperature of 150-160˚C, above which the fatigue life decreases, see Figure 22. In the temperature range 150-320˚C for carbon and low-alloy steels and 150 (/200)-325˚C for austenitic steels, the logarithm of fatigue life decreases linearly with increasing temperature [3, 20, 29, 30, 38, 43, 44], see Figure 22. A large part of the experiments have been conducted at temperatures between 260 and 325˚C [48]. However, according to JSME [44], a similar behaviour is also seen for temperatures below 50˚C for carbon and low-alloy steels, although the environmental effect is significantly less for those temperatures. For Ni-Cr-Fe alloys the existing data are inadequate to determine accurately the effect of temperature on fatigue life although increasing temperature reduces the fatigue life [43, 44, 47].
(a)
(b)
Figure 22. Change of fatigue life with temperature for (a) carbon steel and (b) austenitic stainless steel [3].
Kanasaki et al. [30] have performed an experimental study to examine the effects of thermal strain cycling synchronously combined with mechanical cycling in the manner of in-phase and out-of-phase, see Figure 23. The wave shape of strain cycling was triangular with three different temperature ranges, 50˚C to 290˚C, 50˚C to 200˚C and 200˚C to 290˚C. Fatigue life tended to decrease for increasing temperature above 200˚C. The results showed that the fatigue lives at temperature range of 50˚C to 290˚C and 200˚C to 290˚C were in the range between fatigue life at the lowest temperature and that at
the highest temperature in each temperature cycling- It was also found that fatigue life of the in-phase test was equal to that of the out-of-phase test.
Figure 23. Pattern of temperature and strain change [30].
3.2.4 Dissolved Oxygen
Experiments have shown a minimum dissolved oxygen level in water of 0.03-0.05 ppm above which environment decreases the fatigue life of carbon and low-alloy steels. The data shows an approximate linear dependence between the logarithm of fatigue life and the logarithm of dissolved oxygen level. The effect of dissolved oxygen content on fatigue life saturates at 0.5-1 ppm, i.e. increases in dissolved oxygen levels above 0.5-1 ppm do not cause further decreases in life [3, 20, 29, 43, 44], see Figure 24. Effect of dissolve oxygen concentration on fatigue crack growth rates in BWR conditions has also been investigated. The fatigue crack growth rates showed almost independence of dissolved oxygen concentration below 1 ppm, while above 1 ppm striking dissolved oxygen dependence was observed and the crack growth rate increased with increasing dissolved oxygen concentration [34].
Figure 24. Dependence on dissolved oxygen of fatigue life for carbon steel [3].
In contrast to the behaviour of carbon and low-alloy steels, the fatigue lives of austenitic stainless steels decrease significantly in low-DO water (i.e. < 0.05 ppm dissolved oxygen). In high-DO water, the fatigue lives of austenitic stainless steels are either comparable to or, in some cases, higher than those in low-DO water [37-39, 48, 47]. There is no clear dependency on the dissolved oxygen concentration [38, 44, 47]. Similar results are shown for Ni-Cr-Fe alloys as for austenitic stainless steels [3, 43, 44, 47]. The effects of loading and environmental parameters on the fatigue life of cast stainless steels differ somewhat from those on wrought stainless steels. Existing data indicate that the
fatigue lives of cast stainless steels are comparable to those observed for wrought in low-DO water [48].
In all environments, cracks in austenitic stainless steels primarily form within persistent slip bands. Once a microcrack is formed, it continues to grow along its slip plane as a Mode II (shear) crack in Stage I growth. The orientation of the crack is usually at an angle 45˚ to the stress axis. The Stage I crack may extend across several grains before the increasing stress intensity of the crack promotes slip on systems other than the primary slip. The crack begins to propagate as a Mode I (tensile) crack, normal to the stress axis in Stage II growth. From the experiments performed by Chopra and Gavenda [31, 37] this behaviour was observed in all of the specimens tested in air and in most occasions for specimens tested in high-DO water, see Figure 25. However, in simulated PWR environment (< 0.01 ppm dissolved oxygen) the surface cracks appeared to grow entirely as Mode I (tensile) cracks normal to the stress axis, see Figure 25. In another study both tests in PWR and BWR environments showed a crack initiation and crack growth normal to the stress axis [39].
(a)
(b)
Figure 25. Photomicrographs of surface cracks of Type 316 NG stainless steel tested in 288 in (a) low- (< 0.01 ppm) and (b) high-DO water (0.7 ppm).
3.2.5 Sulphur
When all the threshold conditions are satisfied, environmental effects on the fatigue life for carbon and low-alloy steels increases with increased sulphur content [3, 43, 44], see Figure 26. However, the available data sets are almost too sparse to establish a functional form for dependence of fatigue life on sulphur content and to define either a threshold for sulphur content below which environmental effects are unimportant or an upper limit above which the effect of sulphur on fatigue life may saturate [3]. The limited data suggest that environmental effects on fatigue life saturate at sulphur contents above 0.012-0.015 wt. % [20]. The logarithm of the environmental fatigue life correction factor appears to increase linearly with sulphur content [44].
Figure 26. Effect of strain rate on fatigue life of low-alloy steels with different sulphur content [3].
Hänninen et al. [51] have done an experimental study on two different materials to investigate the micro mechanisms of environmental cyclic crack growth, hydrogen-induced cracking. In the study the two different material selected (A533B C1.1 pressure vessel steel and Cr-Mo-V pressure vessel steel) have almost the same sulphur content but they have, among other things, marked differences in MnS (manganese sulphide) inclusion morphology and distribution. In the study it seemed that a change in the form, size and distribution of MnS inclusions would have much larger effect on the crack growth rate than sulphur content. Thus, inclusion shape control to minimize the anisotropy of the steel seems to be more important than the cleanliness of the steel.
3.2.6 Flow rate
Nearly all of the fatigue data for LWR environments have been obtained at very low water flow rates [3]. Data indicate that for high sulphur carbon steel (S = 0.016 wt%) in LWR environments with dissolved oxygen > 0.01 ppm and slow strain rates the environmental effects on the fatigue life are at least a factor of 2 lower at high flow rates (7 m/s) than at 0.3 m/s or lower [22-25, 44], see Figure 27. In low sulphur carbon steel (S = 0.008 wt%) and in low-alloy steel (S = 0.008 wt%) the fatigue lives in a water flow rate of 7 m/s were almost the same as those in stagnant water even though there was a tendency for an increase in fatigue life [22, 23, 25]. Flow rate seems to have no effect on fatigue life in PWR [44].
Figure 27.Effect of water flow rate on fatigue life of carbon steel [23].
The mechanism responsible for the mitigation of fatigue life reduction is suggested to be the flushing effect of the water which exchanges the corrosive water in the crack and thereby eliminates the locally corrosive environment. [22-25]. This increase in fatigue life is attributed to increases in the crack initiation life and small-crack propagation life, although differences in crack propagation rate were observed for the whole crack propagation process [24, 25, 28]. The local corrosive environment of low sulphur carbon steel is considered to be less severe than that of high sulphur carbon steel. Therefore water flushing may play a less important role for low sulphur carbon steel [22, 23]. The results suggests that the environmental fatigue life under various flow rate conditions should be determined by the combination between the mitigating effect caused by flushing of the severe local environment and the enhancing effect caused by increase in corrosion potential.
Figure 28. Effect of water flow rate on fatigue life of austenitic stainless steel [22].
Contrary to carbon steel, in austenitic stainless steels the fatigue can even become shorter for high flow rate, see Figure 28, but with large data scatter it is impossible to quantify the dependency on the flow rate [22, 23, 25, 44]. Water flushing may have a moderate effect [22, 23]. For 316NG stainless steel the fatigue life difference was insignificant between the different water flow rates irrespective of
dissolved oxygen level, while for 304 and 304L stainless steels noticeable fatigue life decrease with an increase in water flow rate is noted irrespective of dissolved oxygen concentration. The difference of the behaviour between 316NG and 304 may be from difference of corrosion behaviour. The oxide film was analysed and measured by Raman spectroscopy. It was found that in 304 the ratio inside film thickness/outside film thickness decreased with an increase in flow rate, while the ratio was constant for 316NG. The inside oxide film is the layer which exists adjacent to the metal surface and is considered the main barrier of the corrosive environment [25].
Because of the uncertainties in the flow conditions at or near the locations of crack initiation and the moderate effect of flow rate, flow rate effects on the fatigue life is presently not included in fatigue evaluations [3, 44, 47].
3.2.7 Strain holding
In the BWR environment, the fatigue life of carbon and low-alloy steels is reduced due to strain holding at the peak (local maximum value), see Figure 29. The reduction is significant at higher strain rates while it becomes negligible at the strain rate 0.004 %/s or less. The fatigue life reduction due to strain holding in low-alloy steels is smaller than that in carbon steel. Contrary to the case of carbon steel, the fatigue life reduction due to strain holding at the peak is significant at lower strain rates and disappears at 0.004 %/s or higher strain rates. The extent of fatigue life depends on hold time but tends to saturate as the hold time becomes longer [33, 44]. In BWR the fatigue life reduction of stainless steel is remarkable at a strain rate slower than 0.004%/s [33]. In the PWR environment, the fatigue life of stainless steel is independent from the effect of strain holding [33, 44]. Chopra and Shack [20] have also shown results that indicate that a hold period at peak tensile strain decreases fatigue life in high-DO water. Additional and even contradictory results for hold time effects are given in references [52] and [53]. Continuing examination of hold time effects is recommended.
In actual thermal transients, strain is not usually held at the peak of straining cycle but at a point somewhat reduced from the peak after the stabilization of temperature. In considering this Higuchi et al. [33] performed additional fatigue tests in which the strain was held at a point somewhat reduced from the peak. It was found that under such conditions in BWR environments, the fatigue life reduction caused by strain holding disappeared, see Figure 29. The same tests in simulated PWR water did not either show any fatigue life reduction caused by strain holding. Based on the results of the peak strain hold and sub-peak strain hold fatigue tests, the effect of strain holding on fatigue does not have to be considered for normal thermal transients, but should be considered for transients in which the elastic follow-up stress such as internal pressure is held at peak for long time.
(a)
(b)
(c)
Figure 29. Relation of fatigue life to hold time for (a) carbon steel, (b) low alloy steel and (c) stainless steel in BWR water [33].
3.2.8 Surface roughness
Chopra and Shack [26, 39] have examined the effects of surface roughness on the fatigue life of carbon and low-alloy steels and austenitic stainless steels in air and LWR environments (high- and
low-DO water). For austenitic stainless steels the fatigue life of roughened specimens is a factor of approximately three lower than it is for the smooth specimens in both air and low-DO water. In high-DO water the fatigue life is the same for rough and smooth specimens. The fatigue life of roughened specimens of carbon and low-alloy steels in air and low-DO water is lower than that of smooth specimens, although in low-DO the effect is modest. In high-DO water the fatigue life of roughened and smooth specimens is the same. This could mean that the surface finish transferability factor that is applied on fatigue data in air may be unnecessary in high-DO water (BWR environment). It can be concluded that the effect of surface roughness is small for carbon and low-alloy steels in LWR environments.
3.2.9 Heat treatment
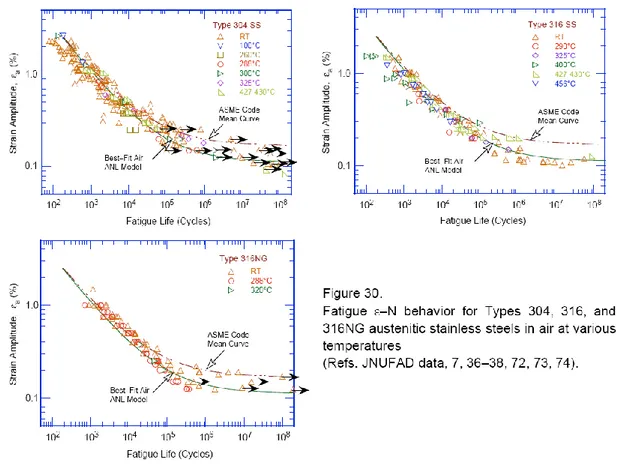
Chopra et al. [39] have performed fatigue tests on austenitic stainless steels (type 304) in LWR coolant environments to examine the effect of heat treatment. The experiments indicate that heat treatment has little or no effect on the fatigue life in air and low-DO PWR environments. In a high-DO BWR environment fatigue life is lower for sensitized stainless steels and the decrease in life appears to increase as degree of sensitization is increased, see Figure 30.
Figure 30. The effect of material heat treatment on fatigue life of Type 304 stainless steel in air, BWR and PWR environments [39]. The EPR (electrochemical potentiodynamic reactivation) value is a measurement of the heat treatment and is dependent on the heat treatment temperature and time.
A detailed metallographic evaluation of the fatigue test specimens was performed. In air, irrespective of the degree of sensitization, the fracture mode for crack initiation and crack propagation is transgranular, most likely along crystallographic planes, leaving behind relatively smooth facets. In the BWR environment the initial crack appeared intergranular, normal to the tensile axis for all heat treatment conditions, implying a weakening of the grain boundaries. Within 200 μm, the initial intergranular mode transformed into a transgranular mode. It appears however that the size of the intergranular portion of the crack surface increased with the degree of sensitization. For all samples tested in PWR environments, the cracks initiated and propagated in a transgranular mode irrespective of the degree of sensitization. The initiation was normal to the tensile axis.
3.2.10 Crack initiation and crack growth
Studies on the formation and growth characteristics of short cracks in smooth fatigue specimens in LWR environments indicate that the decrease in fatigue life is caused primarily by the effects of the environment on the growth of microstructurally small cracks (MSCs), i.e. cracks < 200 μm deep and to a lesser extent on the growth of mechanically small cracks, i.e. the propagation stage [20, 31, 35, 48]. This can be connected to the fact that the growth of MSCs is very sensitive to microstructure while fatigue cracks greater than a critical length, the mechanically small cracks, show little or no influence of microstructure [31]. Chopra and Shack [20, 35, 48] has performed tests in air and high-DO water on carbon and low-alloy steel and examined the crack frequency. For similar loading conditions, the number of cracks in the specimens is identical, see Figure 31, although the fatigue life is lower by a factor of approximately eight in water. If the reduction in life is caused by increased crack formation, the specimens tested in high-DO water should show more cracks. Gavenda et al. [31] have found similar results, i.e. that the environmental appears to have little or no effect on the formation of microcracks.
Figure 31. Number of cracks on fatigue specimens tested in different environments [20].
Seifert and Ritter [40, 41, 49] have examined the corrosion fatigue initiation and short crack growth of different low-carbon and stabilized austenitic steels under simulated BWR water chemistry and PWR conditions by cyclic fatigue tests with sharply notched fracture mechanics specimens in the temperature range from 70 to 320˚C. A relevant environmental reduction of fatigue initiation (average crack advance from notch-root of about 10 μm) life occurred for the combination of temperatures ≥ 100˚C, notch strain rates ≤ 0.1 %/s and notch strain amplitudes ≥ 0.3 %, see Figure 32. If these threshold conditions were satisfied simultaneously the environmental enhancement increased with decreasing strain rate and increasing temperature. For example, the corrosion fatigue crack growth rates were increased by a factor of about 5 to 10 with increasing temperature from 150˚C to 320˚C, under comparable loading conditions in air the fatigue crack growth rates increased only by a factor of 1.4. Material properties (such as cyclic plastic behaviour, yield strength, mean grain size, delta-ferrite content, twin boundary fraction, austenite stability, carbides, homogeneity and anisotropy), product form (piping, rod, plate) and water chemistry parameters usually only had a little effect on crack initiation and short crack growth. The effect of environment on the genuine initiation process was relevantly stronger than on the subsequent stationary short crack growth, by a factor of 5 to 10.
Figure 32. Comparison of fatigue initiation and short crack growth behaviour in air and BWR environment at 288˚C [40].
Seifert and Ritter [40, 41] also found that the effect of temperature on corrosion fatigue crack initiation and short crack growth in austenitic stainless steel at small strain/stress amplitudes was opposite to the usual behaviour, i.e. the environmental reduction decreased with increasing temperature. This is probably related to the distinct secondary hardening at small strain amplitudes and high temperatures due to dynamic strain aging.
In another study [50] the fatigue crack growth behaviour of low-alloy steels was examined. It was found that the crack growth rate increased with increasing temperature from 150˚C to 200˚C. Depending on the loading conditions, the dissolved oxygen level either had very pronounced or only a moderate effect on corrosion fatigue crack growth. Below a loading frequency of 10 Hz, environmental acceleration of fatigue crack growth was observed. Above a dissolved oxygen concentration of 0.4 ppm, neither the dissolved oxygen concentration nor the sulphate content had an effect on the corrosion fatigue crack growth rate.
3.2.11 Mechanism
The environmental effects on the fatigue life of carbon and low-alloy steel are consistent with the slip oxidation/dissolution for crack propagation [54], see Figure 33. A critical concentration of sulphide (S2-) or hydrosulphide (HS-) ions, which are produced by the dissolution of sulphide inclusions in the steel, is required at the crack tip for environmental effects to occur. The crack tip is supplied with sulphide and hydrosulphide ions as the advancing crack intersects the sulphide inclusions and the inclusions dissolve in the high-temperature water environment. Dissolution of MnS inclusions changes the water chemistry near the crack tip, making it more aggressive. The requirements for this mechanism are that a protective oxide film is thermodynamically stable to ensure that the crack will propagate with a high aspect ratio without degrading into a blunt pit, and that a strain increment occurs to rupture that oxide film and thereby expose the underlying matrix to the environment. Once the passive oxide film is ruptured, crack extension is controlled by dissolution of freshly exposed surface and by the oxidation characteristics. The effect of the environment increases with decreasing strain rate. The mechanism assumes that environmental effects do not occur during the compressive load cycle, because during that period water does not have access to the crack tip although limited data indicate that a slow strain rate during the compressive load cycle also slightly decreases fatigue life [20, 38].
![Figure 18. Fatigue behaviour for alloy 690 and 152 Weld in simulated PWR water [3].](https://thumb-eu.123doks.com/thumbv2/5dokorg/3350060.19019/27.892.242.587.520.782/figure-fatigue-behaviour-alloy-weld-simulated-pwr-water.webp)
![Figure 19. Fatigue life plotted as a function of fraction of strain at high strain rate [48]](https://thumb-eu.123doks.com/thumbv2/5dokorg/3350060.19019/28.892.252.575.408.748/figure-fatigue-life-plotted-function-fraction-strain-strain.webp)
![Figure 21. Relation between F en (N air /N water ) and strain rate in (a) BWR water and (b) PWR water [36]](https://thumb-eu.123doks.com/thumbv2/5dokorg/3350060.19019/29.892.106.861.422.690/figure-relation-water-strain-rate-bwr-water-water.webp)
