Research
2010:07
Indicators of safety culture – selection
and utilization of leading safety
performance indicators
This report concerns a study which has been conducted for the Swedish Radiation Safety Authority, SSM. The conclusions and viewpoints presented in the report are those of the author/authors and do not necessarily coin-cide with those of the SSM.
SSM Perspective
According to the Swedish RadiationSafety Authority’s Regulations con-cerning Safety in Nuclear Facilities (SSMFS 2008:1) “the licensee shall en-sure that safety in the nuclear activity is routinely monitored and followed up, deviations are identified and handled so that safety us maintained and continuously develops according to the objectives and directives that apply” (2 Chap., 9 §, 8 point). The deviations may concern deviations from safety goals and directives as well as deviations from procedures and instructions that are applied in the nuclear activity. Safety indicators can be a suitable aid in the monitoring and follow up of the nuclear activity. However, safety indicators or safety performance indicators can also be an aid in the proactive safety management of a nuclear activity.
SSM expects, as a part of the safety management, that safety culture to be regularly assessed by the licensees and indicators of safety culture can be a useful tool both for licensees and the regulators.
Background
SSM has identified a need for an overview, analysis and evaluation of safety performance indicators and particularly safety culture indicators in the domain of nuclear safety. Current safety performance indicators are usually lagging i.e., measuring something that has happened. In order to be able to monitor the effects of proactive safety work as well as anticipate vulnerabilities the organizations should define leading indicators. Those should be able to grasp organizational practices and processes that pre-cede changes in the safety performance of the organization.
Objectives of the project
The overall objective of the project was to provide an overview of the se-lection and effects of leading safety performance indicators in the domain of nuclear safety. The project should provide guidance on the selection and interpretation of leading indicators as well as information on the theoretical justification of the intended measures. Indicators should be categorized on the bases of the underlying phenomena they seek to measure as well as based on the nature of data they produce. The project should also propose a tentative model of the influence of the leading indi-cators on nuclear safety in terms of their effects.
Results
The project has resulted in a broad overview of the definition of safety performance indicators, the existing types of indicators and the utilization of safety performance indicators in the nuclear industry. The project has given deeper knowledge in the different kind of safety performance indi-cators (leading and lagging) including safety culture indiindi-cators and how they are related to safety management in the nuclear domain. A framework for selection and use of safety performance indicators has been developed supported with examples.
Effect on SSM supervisory and regulatory task
This framework for selection and examples of safety performance indica-tors, including safety culture indicaindica-tors, will give a good support for the development of the regulatory indicators in the area. Also, the project has given further knowledge in how to evaluate safety critical organisations with the emphasis on the nuclear industry (see Evaluation safety-critical organisations – emphasis on the nuclear industry, SSM Report Research 2009:12).
Project information
Project managers at SSM: Lars Axelsson and Per-Olof Sandén Project reference: SSM 2009/2235
overview on leading safety indicators in the domain of nuclear safety. The report explains the distinction between lead and lag indicators and proposes a framework of three types of safety performance indicators – feedback, monitor and drive indicators. Finally the report provides guidance for nuclear energy organizations for selecting and interpreting safety indicators. It proposes the use of safety culture as a leading safety performance indicator and offers an example list of potential indicators in all three categories. The report concludes that monitor and drive indicators are so called lead indicators. Drive indicators are chosen prio-rity areas of organizational safety activity.
They are based on the underlying safety model and potential safety acti-vities and safety policy derived from it. Drive indicators influence control measures that manage the sociotechnical system; change, maintain, rein-force, or reduce something. Monitor indicators provide a view on the dy-namics of the system in question; the activities taking place, abilities, skills and motivation of the personnel, routines and practices – the organiza-tional potential for safety. They also monitor the efficacy of the control measures that are used to manage the sociotechnical system. Typically the safety performance indicators that are used are lagging (feedback) indi-cators that measure the outcomes of the sociotechnical system. Besides feedback indicators, organizations should also acknowledge the important role of monitor and drive indicators in managing safety.
The selection and use of safety performance indicators is always based on an understanding (a model) of the sociotechnical system and safety. The safety model defines what risks are perceived. It is important that the safety performance indicators can help in reflecting on this model. Key questions to ask when selecting and utilizing safety performance in-dicators are 1) what is required from the nuclear power plant to perform safely and 2) what is required from the organization in order to be aware of its safety level and enhance its safety performance.
The indicators should provide information on whether these require-ments are met or not, where the organization should put more effort to meet the requirements and finally, does the organization have an ac-curate view on the requirements.
1 Introduction ... 3
2 Safety, performance and safety performance indicators... 5
2.1 What is a safety performance indicator?... 5
2.2 Functions of organizational safety performance indicators ... 6
2.3 Types of safety performance indicators... 9
3 Utilization of safety performance indicators in the nuclear industry ... 11
3.1 Indicating nuclear safety... 11
3.2 Indicator systems ... 12
3.3 State-of-the-art on safety performance indicators ... 14
4 Leading and lagging indicators of safety... 19
4.1 Distinguishing lead from lag ... 19
4.2 Leading indicators as precursors to harm or signs of changing vulnerabilities... 20
5 Safety culture as a leading safety performance indicator ... 23
5.1 Criteria for good safety culture ... 23
5.2 Monitoring safety culture in the sociotechnical system ... 24
6 Framework for the selection and use of safety performance indicators ... 31
6.1 The role of indicators in safety management ... 31
6.2 The selection of key safety performance indicators ... 32
6.3 Relation of monitor indicators to performance ... 37
6.4 Making inferences about the level of safety ... 39
7 Conclusions ... 43
Acknowledgements ... 44
References... 45
Appendix A: Examples of drive indicators ... 48
Appendix B: Examples of monitor indicators ... 56
1 Introduction
Contemporary view on safety emphasises that safety critical organizations should be able to proactively evaluate and manage safety of their activities. This proactivity should be endorsed in the organizational safety management. Safety, however, is a phenomenon that is hard to describe, measure, confirm, and manage. Technical reliability is affected by the performance of the employees. Furthermore, the effect of the management actions, working conditions and the culture of the organization can not be ignored when evaluating the overall safety of the activities.
Scientists in the field of safety critical organizations state that safety emerges when an organization is willing and capable of working according to the demands of their task, and when they understand the changing vulnerabilities of their work (Dekker, 2005; Woods & Hollnagel, 2006; Reiman & Oedewald, 2007). Adopting this point of view we state that managing the organization and its sociotechnical phenomena is the essence of management of safety (Reiman & Oedewald, 2009). Thus, management of safety relies on a systematic anticipation, monitoring and development of organizational performance. Various safety indicators play a key role in providing information on current organizational safety performance. An increasing emphasis has been placed also on the role of indicators in providing information to be used in anticipation and development of organizational performance. These indicators are called leading indicators.
The safety performance indicators that have commonly been used have often been lagging – measuring outcomes of activities or things and events that have already happened. In order to be able to monitor the effects of proactive safety work as well as anticipate vulnerabilities the organizations should define leading indicators. Those should be able to grasp organizational practices and processes that antecede (lead) changes in safety performance of the organization. Hollnagel (2008) calls this kind of control feed-forward control. This kind of control relies on anticipated effects instead of past outcomes contrary to the traditional feedback-based safety management.
Understanding and managing organizational processes and practices has become the primary concern of safety management and science (Reason, 1997; Reiman & Oedewald, 2007). Safety management has been conceptualised as culminating in the problem of system control in complex sociotechnical environments (Rasmussen, 1997; Reiman & Oedewald, 2009). Hollnagel and Woods (2006, p. 348) summarize that “in order to be in control it is necessary to know what has
happened (the past), what happens (the present) and what may happen (the future), as well as knowing what to do and having the required resources to do it.” The system should be controlled in a manner that it remains within the boundaries of its safe performance. If safety is understood as something more than the absence of risk and the negative, the indicators should also be able to focus on the positive side of safety - on presence of something (Hollnagel, 2008, p. 75; Rollenhagen, 2010). This requires a model of the system as well as an outline of how the system produces safety (Hollnagel, 2008; Reiman & Oedewald, 2009).
The aim of this report is to provide an overview on leading safety indicators in the domain of nuclear safety. The report first aims at clarifying the purposes and types of safety performance indicators. The report explains the distinction between lead and lag indicators and proposes a framework of three types of safety performance indicators – feedback, monitor and drive indicators. Finally the report provides guidance for nuclear energy organizations for selecting and interpreting leading safety indicators. It proposes the use of safety culture as a leading safety performance indicator and offers an example list of potential safety performance indicators in all three indicator categories.
2 Safety, performance and
safety performance
indicators
2.1 What is a safety performance indicator?
The literature on safety performance indicators shows that the concept of safety indicator is all but clear (see Safety Science, 47 (2009) for the latest scientific discussion on the issue) and there are different purposes for using safety indicators. For example, indicators can be seen as national or international tools for defining political goals and for following whether the goals are met (cf. Valtiovarainministeriö, 2005). Indicators can also be seen as tools for the authorities for defining their regulative activities and the goals they expect safety critical organizations to fulfil and for following whether theses goals are met. Indicators can also be seen as a way to communicate safety issues for the public (cf. Karjalainen, 2009, p. 88). Finally, safety performance indicators can be used by the organization to gain information on its current safety level and on the efficacy of its safety improvement efforts.
The definition of safety is all but clear. In practice the different definitions of the measured object (safety) that are used explicitly or implicitly affect the selection of the indicators and the interpretation of the collected data. Many indicators embed an idea of safety as an absence something or the missing inadequacy of something, e.g., the fewer the number of unplanned scrams or INES rated events, the higher the safety level. Another bad example would the using the number of human errors to postulate the safety level, i.e. the fewer human errors the higher the safety level. Often the concept of safety remains undefined in the indicator system. This leads to the above mentioned examples where interpretations about safety level are made based on scarce and often deficient data.
Chakraborty et al. (2003) argue that a “nuclear power plant Safety Performance Indicator (SPI) is a basic parameter (described qualitatively or quantitatively) that is perceived as having potential meaning (or relationship) to plant safety”. Wreathall (2009, p. 494) defines a safety indicator as follows: “Indicators are proxy measures for items identified as important in the underlying model(s) of safety”. Similarly to Wreathall’s view, we see that defining safety performance indicators and their purpose should start by defining what is this
“safety” that we are talking about. What is it that we are trying to find indications of?
The selection and use of safety performance indicators is always based on an understanding of the sociotechnical system and system safety. This understanding is often at least partly implicit or tacit understanding, meaning more or less justifiable opinions on what is important for nuclear safety and what things should be taken care of when assuring nuclear safety. These opinions then affect both the selection and the interpretation of the safety performance indicators. In this report we use a term safety model to indicate this underlying model of how safety is created in the sociotechnical system. We argue that in order to be able to select and utilize safety performance indicators in a manner that they would approximate the correct level of nuclear safety the safety model should be systemic incorporating people, technology and the organization.
We approach safety of the nuclear power plants from the point of view of nuclear safety as distinct from for example occupational safety. We define safety as an emergent property of the entire sociotechnical system. Thus, safety is a dynamic property or a state that includes people and technology. It is important to realise that safety is not a system; the organization is (Reiman & Oedewald 2008). Safety management requires the management of the organization. Safety performance indicators should provide information on this organizational ability to fulfil the core task. This means that they should provide information on the safety culture of the organization. According to our definition, the essence of safety culture is the ability and willingness of the organization to understand safety, hazards and means of preventing them, as well as ability and willingness to act safely, prevent hazards from actualising and promote safety. Safety culture refers to a dynamic and adaptive state. It can be viewed as a multilevel phenomenon of organizational dimensions, social processes and psychological states of the personnel.
To conclude, in this report safety performance indicators are approached from organizational point of view. The indicators are seen as organizational tools for the evaluation and improvement of safety used as part of the safety management process of the organizations. 2.2 Functions of organizational safety performance indicators When looked from an organizational point of view the purposes of safety indicators can roughly be categorized into three groups; a) monitoring the level of safety in the organization, b) changing and developing the means of managing safety in the organization, and c)
motivating the management and the personnel to take the necessary action (cf. Hale, 2009, p. 479).
Monitoring the level of safety in the organization
In their documents and guidelines both IAEA and WANO seem to emphasize the monitoring function of safety indicators. They see safety performance indicators primarily as a way to monitor the level of safety performance of the plant (cf. IAEA, 2000, p. 1; WANO, 2009). Often the monitoring is accomplished by looking at trends of the indicator data over some period of time. For example, a guideline by IAEA (2000, p. 1) states that “specific indicator trends over a period of time can provide an early warning to plant management to investigate the causes behind observed changes.”
Safety management process should utilize the indicators for example as triggers for investigating in-depth whether there is substance for concern in the organization (Wreathall, 2009, p. 494). These investigations can be made e.g. by a small focused audit, by a field investigation or by a survey of the workforce. These in turn provide a more focused and indepth indicator of the status of the area of concern.
The challenge in using safety performance indicators for monitoring the current safety level is the unclear causal link between past events and the current safety performance. Monitoring should not rely solely on lagging indicators but also on indicators of current activities and the potential of the organization to succeed in the future. We will return to this topic in various sections of this report.
Changing and developing the means of managing safety in the organization
A partly distinct purpose for using safety indicators besides monitoring the safety level is to use them for change or improvement. First of all, safety indicators can be used as a tool for setting specific development goals and measuring the effectiveness of improvements (cf. IAEA, 2000; WANO, 2009). Second, safety performance indicators can be used to facilitate change and development in the desired direction. This can be done by selecting indicators that promote the wanted behaviour and new practices or inhibit unwanted activity. For example, if the organization is implementing a practice of having bre-job briefings before safety significant tasks are started the amount of such briefings can be selected as a safety performance indicator to be followed annually or even more often.
Motivating the management and the personnel to take the necessary action
Besides helping in goal setting and progress evaluation, the process of utilizing leading indicators and the selected safety performance indicators as such can also have an effect on the actual safety performance. Leading indicator process itself offers intrinsic value in helping to address the role of organizational factors in human performance (EPRI, 2001b). This is an important point that has not always been given sufficient attention when discussing the selection and use of safety indicators.
Safety indicators are cues for the personnel about the priotirities and interests of the management and they can shape the personnel’s ideas on what safety or safe behaviour is or should be like. Thus, the indicators steer the behaviour in the organization. Sometimes the behaviour steering power of the indicators is intensified by embedding the indicators into the incentive system of the organization. Unfortunately, this steering effect remains often unintentional and might lead to problems when the explicit goal of the safety indicators is to monitor the safety level and not change or develop some specific issue being measured.
Safety performance indicators can also be used to explicitly motivate certain kind of behaviour from the employees or the management. Hudson (2009, p. 484) reminds that “to shape managers’ behaviour most organizations will require indicators that can show significant variation on a quarterly or annual basis”. Safety performance indicators should aim at countering the focus on short term production effects such as cost cutting that manifests in safety only after the manager already has probably moved on. However, Hudson (Ibid.) points out that in order to influence motivation the effect of the measure on the performance of the plant should be understood. Thus, the indicators should be experienced as meaningfull by the personnel. To summarize, safety indicators can have different types of effects on the behaviour in the organization:
- Direct effects on the measured metric: selection of some specific indicator increases that kind of behaviour (e.g. counting the number of management walk arounds per month increases the amount of management walk arounds)
- Direct effects on the indicated phenomenon: the selection of some specific indicator increases the underlying (psychological) phenomena (e.g. counting the number of management walk arounds per month increases the
management’s commitment to safety and personnel’s interest in safety)
- Unintended effect: the personnel become more interested in managing the indicator itself rather than the phenomenon of which it is supposed to provide an indication. For example, the management optimizes the number of walk arounds and neglects other (important) issues that are not being measured. We will return in Section 6 to the difference between metric and indicator. Here it is sufficient to say that a metric denotes the operationalization of the indicator (how it is measured), whereas an indicator denotes something that one wishes to measure with the use of one or more metrics.
2.3 Types of safety performance indicators
Safety performance indicators can measure various aspects of nuclear safety. Sometimes safety performance indicators are focused only on human performance or human factors and sometimes the object is nuclear safety in general. We have emphasized that the object of safety performance indicators should be the functioning of the sociotechnical system and thus nuclear safety in general.
Different categorizations of safety performance indicators exist in the literature. We can differentiate at least six typologies of indicators:
- outcome versus activity based indicators - leading versus lagging indicators
- input versus output indicators - process versus personnel indicators - positive versus negative indicators - technical versus human factors indicators
It is important to note that these categorizations are partly overlapping, especially concerning the first three categories. For example, the division between outcome and activity indicators are often considered similar to that of the division between lagging (outcome) and leading (activity) indicators. OECD (2003) defines activities indicators as means for measuring actions or conditions that should maintain or lead to improvements in safety. Outcome indicators in turn measure the results, effects or consequences of these activities.
Outcome indicators are usually similar to lagging indicators, and they show the safety performance in terms of measures of past performance e.g. injury rates, radiation doses, and incidents. Input indicators are usually called leading indicators, and they monitor the processes that are effecting and maintaining safety performance. These include leadership, training activities and work processes. OECD’s guidance document on safety performance indicators (2008, p. 5) argues that “outcome indicators tell you whether you have achieved a desired result (or when a desired safety result has failed). But, unlike activities indicators, they do not tell you why the result was achieved or why it was not.”
In this report we categorize indicators into three types of indicators, feedback, monitor and drive indicators. The feedback and drive indicators correspond closely with outcome and activity indicators, respectively. The monitor indicators are a set of indicators often neglected in previous discussions on safety performance indicators. They indicate the current level of safety in the organization. We will return to these indicator types in Section 4, after looking at the past utilization of indicators at the nuclear industry.
3 Utilization of safety
performance indicators in
the nuclear industry
Different types of safety indicators have been utilized in the nuclear industry for a long time. For example, unit capability factors and INES-events have been used to indicate the (safety) performance of the plant. High capability factors have been used as indicators for a positive indicator of safety performance, whereas INES-events are a negative indicator. Also WANO offers a set of performance indicators including capability factors and unplanned reactor scrams (see below) with trend data for several years and different power plants.
3.1 Indicating nuclear safety
In an NKS-project conducted together with Carl Rollenhagen and Ulf Kahlbom (see Reiman et al. in press) we asked 30 experts from the Finnish and Swedish nuclear organizations (power companies, regulators, and consultants) what issues they would consider if they would have a task of evaluating the nuclear safety of a given power plant. Figure 1 illustrates a combination of all the answers that we received (see Reiman et al. in press).
Management and owners Personnel Outcomes The nuclear process
Events (INES etc.)
Functioning of safety systems
Organizational activities Original technical design Unplanned scrams Systems and structures Radiation dosages Competence Resources
Personnel safety commitment Owners’ safety commitment
Technical construction Management safety commitment
Quality of instructions Rule compliance / use of procedures Reporting of deviations
Way of thinking about safety / risk awareness
Planning activity and plant life time management Way of operating the plant Quality of PRA Decision making practices Communication practices Operating experience and learning from events
Load factors Management safety policy and
priorities Maintenance of the plant
Documentation Design basis of the plant
Maintenance backlog Openness
Fuel integrity, leaks
Quality management
Management system Management safety
under-standing and risk awareness
Understanding the safety significance of one’s work
Research activity Proactive learning practices Change management
Radioactive releases
Safety case
Investments in safety
Number of trains, diversity and redundancy of safety systems Trust in management
Failure tolerance
Attitudes
Figure 1. Indicators that the interviewees explicitly raised as signals of the safety level of the plant (from Reiman et al. in press). The indicators have been arranged according to general themes that emerged from the definitions – management and owners, technical design of the plant, organizational activities, personnel, systems and structures, and finally, the outcomes.
Many people emphasized technical data and performance measures that can be compared to other power plants – outcomes of the organization. Another emphasis was on the organizational activities that produce safety. Personnel-related issues were also considered important indicators of the level of nuclear safety. What the respondents seemed to lack was an overview of the relation of different indications of the safety level. A few divided nuclear safety explicitly into a) the technical condition of the plant and b) its operation and management. (Reiman et al. in press)
In terms of this study it is noteworthy that the responses can be categorized according to whether they indicate outcomes, organizational activities or current states or structures in the organization (system and structures as well as personnel). Clearly the experts in the Nordic nuclear industry considered that nuclear safety cannot reliably be evaluated by relying on only one type of indicator. Rather several sources of information are needed.
3.2 Indicator systems
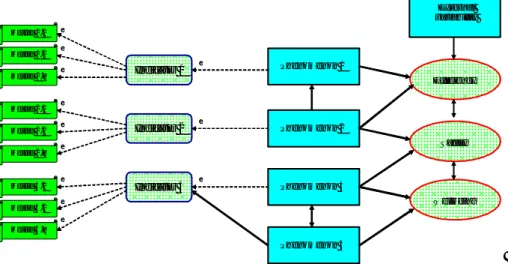
In Finland the regulator, STUK, has developed an indicator system for supervising the nuclear safety of the Finnish nuclear power plants. The indicator system divides nuclear safety into three sectors: 1) safety and quality culture, 2) operational events, and 3) structural integrity. These three sectors are divided into a total of 14 indicators (figure 2).
Figure 2. STUK’s indicator system, from Kainulainen (2009, p. 88)
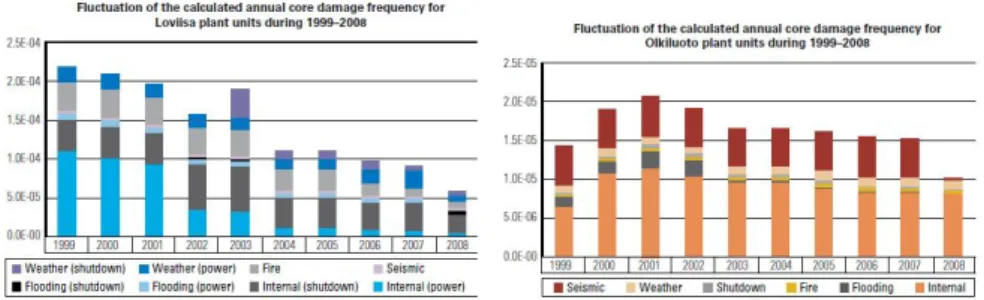
An interesting indicator in terms of this study is the accident risk of nuclear facilities. This indicator is based on the result of probabilistic risk analyses (PRA) (figure 3). STUK reminds that “when assessing the indicator, it must be remembered that it is affected by both the development of the power plant and the development of the calculation model. Plant modifications and changes in methods, carried out to remove risk factors, will decrease the indicator value. An increase of the indicator value may be due to the model being extended to new event groups, or the identification of new risk factors. In addition, developing more detailed models or obtaining more
detailed basic data may change risk estimates in either direction” (Kainulainen 2009, p. 121).
The above example also illustrates the point that was made in Section 2.1 that the utilization of the indicators is based on an understanding of the sociotechnical system. When this understanding deepens it can actually be seen as a decrease in safety level as measured by the safety performance indicators. What actually happens then is of course not a real decrease in safety but a calibration of the model to better correspond with reality. In other words, the safety level has in reality already been closer to the new decreased level than the old indicated level, but the previous models of safety have been unable to indicate it.
Chakraborty et al. (2003) point out that “PSA [the old acronym for PRA] provides a formal and most logical means for quantifying the safety significance of operational events, corrective actions, design modifications, and changes in plant configuration (plant condition). In other words, PSA appears to be a consistent framework for defining the most meaningful set of SPIs, and for linking these with the most effective top-level safety indicators.” PRA is focused on the propability of the nuclear power plant to be safe in the future, and thus it is a leading indicator of nuclear safety.
Figure 3. PRA calculations for the Finnish plants 1999-2008, from Kainulainen (2009, p. 121)
However, Chakraborty et al. (2003) note that within the PSA framework does not address the risk influence of management and organizational aspects and thus it is not easy to assess the appropriateness of the safety performance indicators that are proposed for assessment of management and organizational factors.
Besides the actual safety performance indicators that were depicted in figure 2, STUK publicizes each year the following information from Olkiluoto 1&2 and Loviisa 1&2 nuclear power plants (Kainulainen 2009):
- Daily average gross power for the reporting year - Operation and operational events
- Annual maintenance outage – activities and performance - Events during the year subject to special report
- INES-classified events (ten year trend)
- Non-compliancies during the year with Technical Specifications
- Reliability of the plant’s safety functions (failures during the year in the plant’s safety functions and the systems, equipment and structures implementing them)
- Failures or signs of wear in the integrity of equipment and structures critical to plant safety
- Fuel leaks
- Events in the treatment, storage or final disposal of low- and intermediate-level waste
- Development of the plant and its safety – activities and performance
- Management and safety culture – activities and performance - Functionality of the management system – activities and
performance
- Personnel resources and competence – activities and performance
- Operational experience feedback – activities and performance - Occupational radiation safety – activities and performance - Collective occupational radiation doses since the start of the
operation
- Annual radiation doses to the critical groups since the start of operation
- Radioactive nuclides originating from the plant - Emergency preparedness
This information is not explicitly considered as safety performance indicator information. However, many of the issues that STUK attends to do indicate the safety level of the power plants, and as such they can also be considered safety performance indicators – just qualitative in type.
3.3 State-of-the-art on safety performance indicators
In their study on safety performance indicators in eight countries and eleven partner organizations representing regulatory organizations, utilities, and technical support organizations at the nuclear field Chakraborty et al. (2003, p. 2) summarize the state-of-the art of the application of safety performance indicators as follows:
• In all countries operating nuclear power plants performance indicators are either being tracked or are being proposed that can be applied to monitor the safety performance of the plants.
• There is no unified approach concerning terminology and definition of “performance indicators”, “safety indicators”, and “safety performance indicators”.
• Most widely applied is the WANO set of performance indicators (10 quantitative indicators reported annually by nearly all NPPs worldwide, in order to monitor the safety and economic performance of NPPs).
• In many countries the WANO set, complemented by other indicators, is used by utilities and regulators to monitor the safety performance of NPPs. • There is practically no calibration of safety performance indicators in order to give a quantitative measure of plant safety (resp. risk).
• Evaluation of safety performance indicators applies relative thresholds which are based on past experience.
• Safety performance indicators are generally applied in combination with other methods to monitor plant safety (e.g. inspections, PSA, precursor studies).
• Approaches have been developed to monitor status and trends of safety management and safety culture by means of specific indicators. Calibration in terms of influence on plant safety (resp. risk) is not available.
• Similarly it is intended to find indicators to detect early signs of deterioration of safety. Proposals have been developed, but there is no accepted approach. Furthermore, the relationship of “safety culture and organizational aspects” to fundamental PSA input parameters and models needs to be better established using actuarial plant data.
• Plant specific PSAs, taking into account actual operational experience, produce safety performance indicators (CDF, release category frequencies) based on an integrated view. However, the current PSA methodology does not take into account (potential) influences from safety management or safety culture, which have not yet been manifested in the operational experience.
Chakraborty et al. (2003) propose that the development of risk-based safety performance indicators “should follow the PSA hierarchy that includes the relevant indicators representing, for instance:
• Initiating events
• Reliability of functions, systems, trains and components • Mitigation potential of engineering systems
• Mitigation potential of emergency actions” (Ibid., p. 4).
They (Ibid.) further note that organizational and management influences should be included in the indicator framework but offer limited guidance on how to accomplish this.
IAEA (2000, 1) leaves the choice of specific safety performance indicators up to the organizations by stating that “each plant needs to determine which indicators best serve its needs. Selected indicators should not be static, but should be adapted to the conditions and performance of the plant, with consideration given to the cost/benefit of maintaining any individual indicator.” However, IAEA presents a hierarchical structure or framework for supporting indicator selection and utilization and provides examples of suitable indicators. It
encourages the use of those safety performance indicators WANO has developed (see below), that form the basis for the safety performance indicators currently used in nuclear power plants.
The WANO Performance Indicator Programme supports the exchange of operating experience information by collecting, trending and disseminating nuclear plant performance. Specific key indicator areas are intended to give a quantitative indication of nuclear plant safety and reliability, plant efficiency and personnel safety areas. In 2008 these key indicator areas were:
- unit capability
- unplanned capability loss - forced loss rate
- collective radiation exposure
- unplanned automatic scrams per 7 000 hours critical - industrial safety accidents rate
- safety system performance - fuel reliability
- chemistry performance - grid-related loss factors
- contractor industrial safety accident rate (WANO, 2009). WANO members report on most of these indicators on a quarterly basis. The data is collected through WANO members' Web site, trended and posted on the WANO members' Web site. WANO published and distributed its first performance indicator report in 1991. The level of reporting has grown so that in 2008 82 percent of the operating nuclear power plants reported all eleven indicators (WANO, 2009).
In practice, WANO safety indicators are often complemented with other indicators in the nuclear plants. For example, when Flodin & Lönnblad (2004) reviewed safety performance indicators in use by the Swedish utilities, they found that the selection of indicators was based both on the WANO indicators and on indicators defined by the users themselves. The Swedish utilities used well over 20 indicators for follow-up of safety at the plants, including the 8 WANO indicators that were available at that time.
IAEA (2000, 23) states that safety indicators chosen should include a combination of indicators that reflect actual performance that is sometimes called lagging indicators and those that provide an early warning of declining performance that is sometimes called leading indicators. The American Electric Power Research Institute (EPRI) also emphasizes that there are more indicator types than just one. EPRI strongly encourages the use of leading indicators for their
member utilities and provides tools and guidelines for this (EPRI, 2000, 2001a). These tools and guidelines are constructed so that they are also in line with the principles of INPO (Institute of Nuclear Power Operations).
Next we will look more closely at the differences between leading and lagging safety performance indicators.
4 Leading and lagging
indicators of safety
4.1 Distinguishing lead from lag
The distinction between leading and lagging safety performance indicators is not clear cut. Some safety scientists and practitioners have described them more as a continuum than two separate entities and have even suggested that the distinction between leading and lagging is not that important at all (Hale 2009).
The categorization of safety performance indicators into lead and lag is dependent on the underlying model of safety. If one has a mechanistic and technical-oriented view on nuclear safety, near-misses can be considered leading indicators. More systemic and dynamic view of an organization and system safety would not view near-misses as leading indicators, rather more as indicators of past safety performance. Another typical safety model emphasizes the latent failures (pathogens) of the sociotechnical system as creating conditions for accident (Reason, 1997).
A working group for the UK Oil and Gas Industry (Step-Change in Safety, 2001, 3) has defined leading safety indicators as “something that provides information that helps the user respond to changing circumstances and take actions to achieve desired outcomes or avoid unwanted outcomes” while lagging indicators were seen as “the outcomes resulting from our actions”. The working group used the analogy of sailing yacht as an example of leading and lagging indicators. In a yacht, the compass, wind indicator and radar provide information that can be used to control the boat to maximise speed in the direction that we want to go, whilst avoiding danger. They can thus be seen as leading indicators, which provide information about the current situation that can affect future performance. The log on the other hand provides a measure of how far we have travelled. This parallels lagging indicators, which are the outcomes of our actions. OECD’s guidance document on safety performance indicators at the chemical industry (2008, p. 5) defined leading indicators (or in their usage Activities Indicators) as follows: “Activities indicators are designed to help identify whether enterprises/organizations are taking actions believed necessary to lower risks.” Examples of activities indicators given in the document include “Are there systematic procedures for hazard identification and assessment?”, “Are safety issues adequately addressed in regular meetings of employees?”, “Is
there an adequate recruitment procedure?” and “Is management actively committed to, and involved in, safety activities”.
HSE (2006) defines leading indicators as follows: “The leading indicator identifies failings or ‘holes’ in vital aspects of the risk control system discovered during routine checks on the operation of a critical activity within the risk control system”. The definition seems to view accidents from an epidemiological model (Hollnagel, 2004) and emphasize the indicators’ role in identifying latent failures and system deficiencies before they manifest. Hale (2009, p. 479) emphasizes that the indicator is leading or lagging in respect to whether “it leads or lags the occurrence of harm, or at least the loss of control in the scenario leading to harm”.
The health metaphor can be used to illustrate the challenges of measuring safety. It has for long been pointed out that health of an individual human being is something more than the absence of illnesses or injuries. Health is an active state requiring and enabling certain activities; acquisition of nutrition, exercise, vitality. Often people do not explicitly consider their health or they take it for granted until the negative signs of health surface. These negative signs such as high blood pressure or rise in temperature are lagging indicators. Safety has close parallels to health. Safety is also a state of activity, not only absence of accidents or incidents. Monitoring safety requires more than monitoring the signs of “illnesses”, that is, incidents, deficiencies, errors. One must also be able to monitor the activities, processes and mental states of the personnel that contribute to the level of safety that the organization is producing. It is not enough just to note that there have been no incidents during the year or the trend of the incidents is declining. One must also know why the situation is so, and how the current safety management processes are contributing to the safety level.
4.2 Leading indicators as precursors to harm or signs of changing vulnerabilities
Several reasons for using leading indicators have been proposed in the literature:
- they provide information on where to focus improvement efforts,
- they direct attention to proactive measures of safety management rather than reactive follow up of negative occurrences or trending of events,
- they provide early warning signs on potential weak areas or vulnerabilities in the organizational risk control system or technology,
- they focus on precursors to undesired events rather than the undesired events themselves,
- they provide information on the effectiveness of the safety efforts underway and
- they tell about the organizational health, not only sickness or absence of it.
Typically lead and lag indicators are considered on a time scale where lead indicators precede harm and lag indicators follow harm. According to that, lagging indicators can be used in providing feedback on the functioning of the system to be used as further inputs into the system. Lagging indicators would thus indicate the current safety level of the system. We disagree with this definition.
Kjellén (2009, p. 486) defines a leading safety performance indicator as an indicator that changes before the actual risk level has changed. This definition deviates from many current usages and definitions of the concept. The distinction between indicators that change before and after the actual risk level changes is an important one. It also has important implications for the requirements of leading indicators. For the indicator to be sensitive to changes in the organizational risk control system that predate the rise of the risk level, it cannot focus on “failings”, “holes” or even “near-misses” or “deviations”. The indicator has to provide information on the activities and the organizational means of controlling risk.
EPRI’s definition of leading indicators resembles Kjellén’s definition in some important aspects. According to EPRI (2000, A-3), “leading indicators provide information about developing or changing conditions and factors that tend to influence future human performance”. Thus “effective leading indicators provide a basis for predicting or forecasting situations in which the potential exists for a change in human performance, either for better or worse.”
Both Kjellén (2009, p. 486) and EPRI (2000) seem to view leading indicators not as measures of precursor to harm but as measures of signs of changing vulnerabilities. This means that leading indicators should measure things that might one day become precursos to harm or cause a precursor to harm. We agree with this perspective. All in all we define leading indicators as follows (cf. Dyreborg 2009):
Lead safety indicators indicate either the current state and/or potential development of key organizational functions or processes as well as the technical infrastructure of the system. The current state includes a view on the changing vulnerabilities of the organization as well as its internal model of how it is creating safety. The lead monitor indicators indicate the potential of the organization to achieve safety. They do not directly predict the safety related outcomes of the sociotechnical system since these are also affected by numerous other factors such as external circumstances, situational variables and chance.
In the next chapter we present an organizational theoretical view on safety indicators and system safety that parallels leading indicators with safety culture.
5 Safety culture as a
leading safety
performance indicator
5.1 Criteria for good safety culture
According to our approach (see Reiman et al., 2008; Reiman & Oedewald, 2009), the essence of safety culture is the ability and willingness of the organization to understand safety, hazards and means of preventing them, as well as ability and willingness to act safely, prevent hazards from actualising and promote safety. Safety culture refers to a dynamic and adaptive state. It can be viewed as a multilevel phenomenon of organizational dimensions, social processes and psychological states of the personnel. Reiman and Oedewald (2009, 43) have stated that a nuclear industry organization has a high-level safety culture when the following criteria are met:
- Safety is genuinely valued and the members of the organization are motivated to put effort on achieving high levels of safety
- It is understood that safety is a complex phenomenon. Safety is understood as a property of an entire system and not just absence of incidents
- People feel personally responsible for the safety of the entire system, they feel that they can have an effect on safety
- The organization aims at understanding the hazards and anticipating the risks in their activities
- The organization is alert to the possibility of an unanticipated event
- There are good prerequisites for carrying out the daily work - The interaction between people promotes a formation of
shared understanding of safety as well as situational awareness of ongoing activities
The above-mentioned dimensions can be seen as criteria in an organizational evaluation. If an organization shows all the above-mentioned characteristics, it has a high-level safety culture and thus a high potential for managing its activities safely. In practice, however, organizations show varying degrees of safety value and motivation. Furthermore, the risk and safety conceptions of the personnel are usually partially accurate and partially flawed. Thus the indicators have to reach the social and structural aspects of the organizations and provide information on how well the organization is able and willing to carry out its core task. Especially important in this regard is to
identify those aspects of the organizational ability that have vulnerabilities or can create vulnerabilities elsewhere in the organization.
Reiman and Oedewald (2009) propose that when evaluating an organization and its safety culture, four main elements of an organization should be taken into account. Those are the organizational functions, social processes and psychological properties of the personnel (see also Reiman et al., 2008). The basis for the criteria used in the evaluation is the fourth element of the organization; the organizational core task and production technology. This is the source of the inherent hazards of the sociotechnical system. Organizational evaluation is one type of means of providing safety performance indicator data. Thus, the criteria used in organizational evaluation can also be used when considering the question of what should the safety performance indicators aim at indicating?
5.2 Monitoring safety culture in the sociotechnical system
Adopting the view on the organizational safety culture described in Section 5.1 has implications for safety performance indicators. The framework is based on presence of certain organizational attributes instead of absence of indications of harm. Thus, also the selected safety indicators should be able to show a presence of certain dimensions and measure their level. We argue that the preoccupation with the concepts of harm and accident in the discussion on indicators has led to a neglect of the critical issue worth indicating: the functioning of the sociotechnical system including the way it is currently producing safety (not necessarily – or hopefully – harm and accidents).
We argue that lagging indicators do not tell about the safety level of the system or dynamics of the system’s functioning. Instead lag indicators only tell about the outputs of the system. These outputs are produced by the internal dynamics of the various organizational dimensions influenced by external variability and chance. Likewise, leading indicators are not only indicators of something that precede harm as they have been conceptualized in frameworks based on epidemiological accident models (cf. Hale, 2009). Leading indicators either influence safety management priorities and the chosen actions for safety improvement, or they tell about the dynamics of the sociotechnical system (not about the inputs to the system or merely about the functioning of safety barriers). These leading indicators are labelled drive indicators and monitor indicators in this report, respectively.
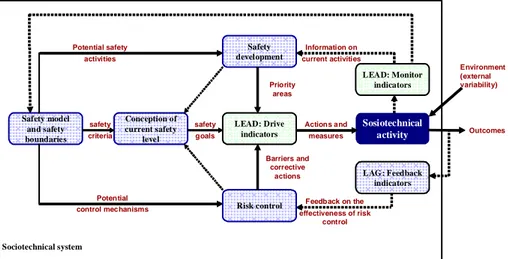
The distinction between lead and lag indicators can be illustrated with the help of Hollnagel’s (2008, p. 70) feedforward model of safety management. Hollnagel (2008) argues that more emphasis needs to be put into controlling the system by anticipated or expected disturbances and deviations (feedforward) instead of actual outcomes (feedback). In figure 4 we have created a model loosely based on Hollnagel’s ideas (2008) to illustrate the three types of indications; feedforward, or leading drive indicators, leading monitor indicators and lagging, or feedback indicators. Safety development LEAD: Drive indicators LAG: Feedback indicators Sosiotechnical activity Environment (external variability) Potential control mechanisms Outcomes Actions and measures LEAD: Monitor indicators Potential safety activities Safety model and safety boundaries Priority areas Risk control Barriers and corrective actions Conception of current safety level safety criteria safety goals Sociotechnical system
Figure 4. The sociotechnical system model indicates the influence of various organizational elements on selection and utilization of safety performance indicators. The model differentiates three types of safety indicators. The “outcomes” in the model indicate situation specific outputs of the system and not emergent properties of the system such as nuclear safety.
Figure 4 illustrates that the safety model prevalent in the organization creates the criteria that the organization uses in making interpretations about the current level of nuclear safety. This conception of current safety level influences the goals that the top management sets for the organization to achieve. These goals again influence what criteria are selected for the drive indicators. The selection of drive indicators is influenced by two parallel organizational functions; that of risk control and that of safety development. Drive indicators are turned into actions that influence the sociotechnical activity. Monitor indicators provide a view on the dynamics of the system in question; on the activities taking place, abilities, skills and motivation of the personnel, routines and practices – the organizational potential for safety. After this potential has actualized in specific situations into outcomes, the feedback indicators can provide a view on the outputs of the sociotechnical system. Figure 4 differentiates the following nine elements:
Safety model and safety boundaries: This means the underlying, often implicit model of what safety is and how it is achieved in an organizational context. Safety boundaries refer to the perceived hazards of the organization and the space that these hazards leave for carrying out activities safely. Even though each employee has their own more or less uniform model of safety, the element in figure 4 refers to the model of people involved in the selection and utilization of safety performance indicators. The safety model defines the risks that are perceived and it is thus “the Achilles heel of feedforward control” (Hollnagel, 2008, p. 68). Disturbances that are not acknowledged or foreseen in the model will no be transformed into drive indicators and corresponding safety interventions either. For more information on safety models, see e.g. Hollnagel (2004, 2008), Reiman and Oedewald (2009) and EPRI (2000, appendix C).
Conception of current safety level: The conception of current safety level refers to views on the level of safety at the power plant held by the top management and other people involved in selecting and interpreting safety indicators. As with the safety model, the conception is seldom homogenous within the group in charge on safety indicators, but for clarity’s sake the figure presumes these conceptions can be grouped together. The conception of safety level influences the goals that are set for the drive indicators as well as safety interventions (how much gap is perceived between the present state and an ideal state).
Risk control: This means the organizational approach aimed at controlling the variance in human behaviour and technological performance by means of various safety barriers. Safety barriers can be physical, functional, symbolic or incorporeal (Hollnagel, 2004). Physical barriers include the containment building in the nuclear power plant as well as walls, doors, valves, fences, safety belts, filters and so on. A functional barrier system works by impeding the action to be carried out by setting preconditions that have to be met before an action can be carried out (e.g. a lock). Symbolic barriers require an act of interpretation in order to achieve their purpose (e.g. signs, signals). Finally, incorporeal barriers lack material form or substance and depend on the knowledge of the user. Typical incorporeal barriers are rules, guidelines, safety principles, restrictions and laws. (Hollnagel, 2004.)
Safety development:Safety development refers to the organizational approach aimed at improving the organizational conditions for achieving safety. Safety development can focus on improving the processes of the organization as well as enhanching the personnel’s awareness and understanding concerning the work that they and other
members of the organization do. Instead of constraining behaviour, safety development aims for building up the know-how and other prerequisites for the personnel to do their work well and safely in changing situations. Both risk control and safety development are needed to manage safety.
Drive indicators: Drive indicators are measures of the fulfilment of the selected safety management activities. Thus, they are chosen priority areas of the organizational safety activity. They are based on potential safety activities from the safety model and the priority areas defined by the safety policy. The drive indicators are turned into control measures that are used to manage the sociotechnical system; change, maintain, reinforce, or reduce something. The main function of the drive indicators is to direct the sociotechnical activity by motivating certain safety management activities.
Monitor indicators: These indicators reflect the potential and capacity of the organization to perform safely. The indicators monitor the functioning of the system including but not limited to the efficacy of the control measures. These indicators monitor the internal dynamics of the sosiotechnical system.
Feedback indicators: Feedback indicators measure the outcomes of the sociotechnical system. An outcome means a temporary end result of a continuous process or an organizational activity. An important qualifier of an outcome is that outcome always follows something; it is a result or consequence of some other factor or combination of factors and circumstances.
Sosiotechnical activity: Sosiotechnical activity refers to all the activities, work, tasks and processes (physical and social) taking place in the sociotechnical system.
Sosiotechnical system: The common term for an organization composed of people and technology. The name reminds of the fact that technology is always designed, used and maintained by people, as well as of the fact that people do not act in a social and technical vacuum but rather in a sosiotechnical context with its shared norms and tools. The safety performance indicators should provide information on the sociotechnical system and its capability for safety. The challenge comes from the fact that safety performance indicators are always selected and utilized within the same system that they are supposed to measure.
In addition to the nine elements the figure includes “outcomes” as outputs from the sociotechnical system and “environmental influences” as inputs into the system. Outcomes are situational end
results or situational actualization of the safety potential of the organization. Thus, safety is not an outcome. Safety is a dynamic non-event where non-non-events are not possible to characterize. Thus, we have to look at the term ”dynamic” and search for the way the event is created and acknowledge that we cannot ever reach the non-event itself.
Environmental influences refer to deviations and disturbances beyond control of the organization. These deviations still have an effect on the situational performance and outcomes of the sociotechnical system, for better or worse.
Figure 4 illustrates that the underlying safety model provides the potential control mechanisms as well as a view on potential safety improvement activities. These areas are then tackled with drive indicators in terms of priority areas of safety development, corrective measures of deficiencies in existing safety barrieres or implementation of new safety barriers. What has been omitted from the figure 4 is the feedback of information from the indicators into the safety model and the two safety management strategies. Figure 5 illustrates the information and feedback that each indicator type provides.
Safety development LEAD: Drive indicators LAG: Feedback indicators Sosiotechnical activity Environment (external variability) Potential control mechanisms Feedback on the effectiveness of risk control Outcomes Actions and measures Information on current activities LEAD: Monitor indicators Potential safety activities Safety model and safety boundaries Priority areas Risk control Barriers and corrective actions Conception of current safety level safety criteria safety goals Sociotechnical system
Figure 5. Sociotechnical system model of lead and lag indicators with the information transfer lines added
In figure 5, it is worthwile to note that there are no lines from the feedback indicators to the conception of safety level or to the safety development. In practice feedback indicators are often used to define safety priorities or make conclusions about the level of safety. That is not a correct use of the feedback indicators. These function only within the predefined risk control framework, finetuning and adjusting the selected safety barriers and making corrective actions to safety systems. The influence to safety model and to the understanding of
current (and future) safety level should always go through the monitor indicators (see also Figure 7).
However, feedback indicators can provide clues about the functioning of the organization - if they are analyzed from that perspective. When used in this manner, indicators indicating a small event in terms of outcomes (e.g. an unplanned reactor scram) might tell more about the current functioning of the system than indicators that show a large event (for example, partial loss of cooling accident). This is due to the fact that large events already change the sociotechnical system; they have immediate consequences for the technical systems, they are interpreted and made sense of by the personnel, investigations and other initiatives to prevent the event from recurring are made. Smaller events go easily unnoticed in the sociotechnical system, and thus by inspecting more closely (with the use of monitor indicators and other data) what led to these events organizations can learn a lot about the dynamics of their organization.
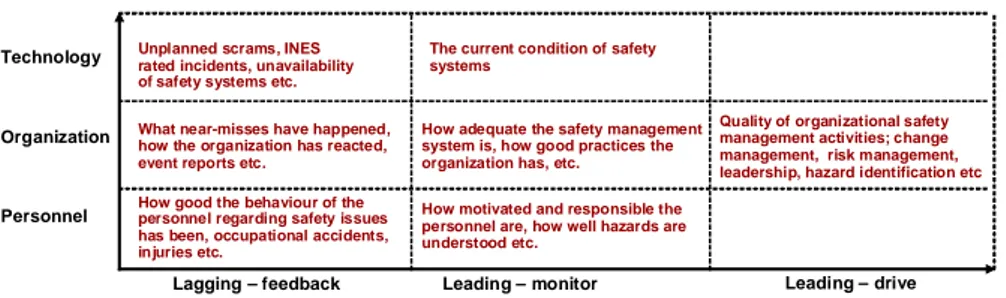
Figure 6 shows examples of lagging indicators as well as the two types of leading indicators – monitor and drive indicators.
Personnel Technology
Organization
Leading – monitor Leading – drive Lagging – feedback
How good the behaviour of the personnel regarding safety issues has been, occupational accidents, injuries etc.
Quality of organizational safety management activities; change management, risk management, leadership, hazard identification etc Unplanned scrams, INES
rated incidents, unavailability of safety systems etc. What near-misses have happened, how the organization has reacted, event reports etc.
The current condition of safety systems
How adequate the safety management system is, how good practices the organization has, etc.
How motivated and responsible the personnel are, how well hazards are understood etc.
Figure 6. Examples of lag and lead indicators (for more examples see appendixes A, B and C).
As proposed by IAEA (2000), the selection of safety performance indicators should always start by considering what is required from an organization or a NPP to perform safely. When focusing on leading safety indicators specifically, the basic question goes: what is required from an organization in order to be aware of its safety level and enhance its safety performance. Interestingly this is what safety culture studies have been trying to find out for years. In fact, several writers have connected the concept of leading safety performance indicators to safety culture concept and proposed the use of safety culture or climate as a leading safety indicator (cf. Mearns, 2009; Grabowsky et al., 2007, see also Zwetsloot, 2009, 495). It is both practical and economical to consider safety indicators and safety culture indicators together, not as separate measurement and improvement tools that in the worst case are collected and handled by different actors in the organization.