Assessing the Market Attractiveness
for a Renewable Energy Source
- A case study of the expanding wind power
market in Finland
Authors:
Carl Fredrik Leifland
Christoffer Löfquist
Supervisors:
Elisabet Wahlstedt
Preface
This master thesis is our final project and thus the end of our master’s studies of Industrial Engineering and Management, at the Faculty of Engineering, Lund University. To apply our acquired knowledge on a reality based case during this spring has been challenging, interesting and rewarding.
We would especially like to thank our supervisor Elisabet Wahlstedt and her colleagues who have been most helpful providing us with information and guidance.
We would also like to thank our academic supervisor Bertil I Nilsson who has believed in us all the way and inspired us in times of doubt as well as given a lot of helpful guidance. Finally - a huge thank you to Marcus Bruzelius and Oscar Werne for their valuable feedback and improvement suggestions when assuring the quality of our thesis.
Lund 2014-06-05
Carl Fredrik Leifland Christoffer Löfquist
Abstract
Title
Assessing the market attractiveness for a renewable energy source – A case study of the expanding wind power market in FinlandAuthors
Carl Fredrik Leifland and Christoffer Löfquist – Master of Science in Industrial Engineering and ManagementSupervisors
Elisabet WahlstedtBertil I Nilsson – Associate Assistant Professor, Department of Industrial Management and Logistics, Lund University, Faculty of Engineering
Background
The EU’s 20-20-20 targets determine that Finland’s share of energy consumption from renewable energy sources is to be 38 % by 2020, a target that the government intends to reach by expansion of wind power. The government has a beneficial feed-in tariff in place as an incentive for rapid wind power expansion, which has made both domestic and international developers evaluate the business case in Finland.Purpose
The purpose of the study is to assess the attractiveness of wind power in Finland and determine the viability for a potential market entry.Objective
The objectives of the study were:• Examine existing framework to assess attractiveness of a geographical market for a renewable energy source. • Map the current market structure and the key drivers. • Evaluate the Finnish business case to conclude the
potential viability of the market.
Methodology
An exploratory approach was used to establish a framework to perform the case study on the wind power market in Finland. Both a descriptive and a predictive approach were later used when applying the framework onto the market.The concluding evaluation then followed an explanatory approach as the interaction of different factors determined the outcome of the conclusion.
Conclusions
The thesis’ developed CL2-model is deemed to be anappropriate framework to assess the wind power market in Finland, and quite possibly applicable onto other geographical markets and weather dependent renewable energy sources. The case study of Finland indicates that there are viable business opportunities for actors interested in acquiring projects as brand new projects are predicted not to be included in the current subsidy system. The financial evaluation indicates an internal rate of return of at least 6.5 %, given the assumptions made in the financial model. Main risks to consider are political interference causing a decrease in the subsidy system and stricter noise regulations.
Key words:
Finland, wind power, feed-in tariff, weather dependent renewable energy source, business case evaluation, 20-20-20 targetsSammanfattning
Titel
Marknadsattraktivitetsbedömning för en förnybar energikälla – En fallstudie av den expanderande vindkraftsmarknaden i FinlandFörfattare
Carl Fredrik Leifland och Christoffer Löfquist – Civilingenjörer inom Industriell ekonomiHandledare
Elisabet WahlstedtBertil I Nilsson – Adjungerad universitetslektor, Avdelningen för Produktionsekonomi, Lunds Tekniska Högskola.
Bakgrund
EU:s 20-20-20 mål fastslår att Finlands andel av förnybar energi ska vara 38 % av den totala energikonsumtionen år 2020. Den finska regeringen avser att nå detta mål genom utbyggnad av vindkraft. För att påskynda utbyggnaden har regeringen infört ett generöst inmatningspris som incitament för utvecklare. Det har lett till att både nationella och internationella utvecklare börjat utvärdera affärsmöjligheterna i Finland.Syfte
Syftet med studien är att utvärdera attraktiviteten hos vindkraft i Finland och bedöma lönsamheten för ett potentiellt marknadsinträde.Mål
Målen med studien var att:• Undersöka existerande ramverk för att utvärdera en förnybar energikällas marknadsattraktivitet.
• Kartlägga den nuvarande marknadsstrukturen och drivkrafterna.
• Utvärdera affärsmöjligheterna i Finland för att dra slutsatser om marknadens potentiella lönsamhet.
Metodik
En explorativ ansats användes för att etablera ett ramverk att använda i fallstudien på vindkraft i Finland. Därefter användes en kombination av beskrivande och predikterande ansats vid tillämpningen av ramverket påmarknaden. Den avslutande utvärderingen följde en förklarande ansats då samverkan mellan olika faktorer låg som beslutsunderlag för det slutliga utfallet av slutsatsen.
Slutsats
Den utvecklade CL2-modellen bedöms vara ändamålsenligför att utvärdera vindkraftmarknaden i Finland, och fullt möjligt tillämpbar på andra geografiska marknader och/eller väderberoende förnybara energikällor. Fallstudien på Finland indikerar att det finns lönsamma affärsmöjligheter för aktörer med intresse att förvärva projekt då nystartade projekt predikteras att inte hinna bli inkluderade i det nuvarande stödsystemet. Den finansiella utvärderingen indikerar en avkastning på minst 6.5 % givet de antaganden som gjorts i den finansiella modellen. De primära riskerna anses vara en politisk orsakad minskning av stödsystemet samt striktare bullernivåer.
Nyckelord:
Finland, vindkraft, inmatningspris, väderberoende förnybar energikälla, affärsmöjlighetsutvärdering, 20-20-20 målTable of Contents
1
Introduction ... 1
1.1 Background... 1
1.2 Problem analysis ... 5
1.2.1 Weather-dependent renewable energy sources (WDRES) ... 5
1.3 Purpose ... 6 1.4 Delimitations ... 7 1.5 Target group... 7 1.6 Report outline ... 8
2
Methodology ... 11
2.1 Methodology approach ... 11 2.2 Research strategies ... 11 2.3 Data collection ... 12 2.3.1 Written questionnaire ... 13 2.3.2 Direct observations ... 13 2.3.3 Interviews ... 13 2.4 Sampling ... 142.5 Qualitative and quantitative data ... 15
2.6 Credibility ... 15
2.6.1 Achieving credibility ... 16
2.7 Chosen method ... 16
2.7.1 Criticism of chosen method ... 18
2.8 Research process ... 19
2.9 Source criticism ... 20
3
Theoretical framework ... 21
3.1 Theoretical approach ... 21
3.2 Mapping the macro-environment ... 22
3.2.1 Political ... 22
3.2.2 Economic ... 23 vii
3.2.3 Social ... 23
3.2.4 Technological ... 23
3.2.5 Environment ... 24
3.2.6 Legal ... 24
3.3 Analysing the industry ... 24
3.3.1 Threat of new entrants ... 25
3.3.2 The power of suppliers ... 27
3.3.3 The power of buyers ... 27
3.3.4 Threats from substitutes ... 28
3.3.5 Rivalry among existing competitors ... 28
3.4 Strategic decision making ... 29
3.4.1 Criticism ... 31
3.5 Project life cycle ... 31
3.5.1 XLPM ... 31
3.5.2 Project steering process ... 32
3.5.3 Project management process ... 34
3.5.4 Project Work Model ... 35
3.6 Investment capital budgeting ... 35
3.6.1 The time value of money ... 35
3.6.2 Net present value - NPV ... 36
3.6.3 Internal rate of return- IRR ... 37
3.6.4 Combining NPV and IRR ... 37
3.6.5 Levelised cost of energy – LCOE ... 38
3.6.6 Weighted Average Cost of Capital – WACC ... 38
3.7 Wind power theory ... 39
3.7.1 Energy conversion ... 39
3.7.2 Turbulence ... 40
4
Model ... 41
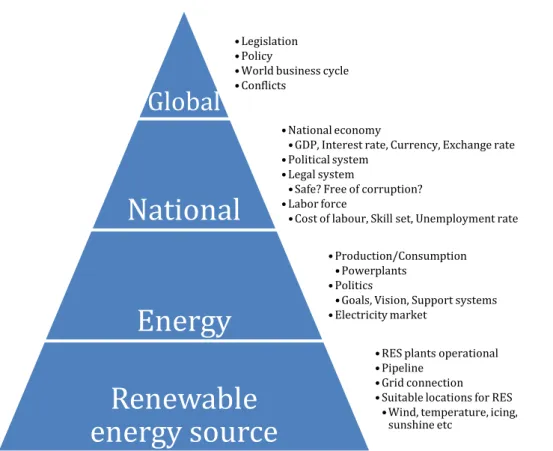
4.1 Market assessment ... 42 viii
4.2 WDRES Lifecycle... 44 4.2.1 Analysis ... 45 4.2.2 Planning ... 46 4.2.3 Execution - Establishment ... 47 4.2.4 Execution - Realisation ... 48 4.2.5 Execution – Hand-over ... 48 4.2.6 Generation ... 49 4.3 Evaluation ... 49 4.3.1 Qualitative analysis ... 49 4.3.2 Quantitative analysis ... 50
5
Case study - Finland ... 53
5.1 Market assessment ... 53
5.1.1 Global ... 53
5.1.2 Finland ... 57
5.1.3 Energy ... 62
5.1.4 Wind power ... 72
5.2 The Finnish onshore wind power life cycle ... 93
5.2.1 Analysis ... 94 5.2.2 Planning ... 98 5.2.3 Execution – Establishment ... 108 5.2.4 Execution – Realisation ... 112 5.2.5 Execution – Handover ... 116 5.2.6 Generation ... 118 5.2.7 Summary of costs ... 122
6
Evaluation ... 123
6.1 Quantitative analysis ... 123 6.1.1 Analysis phase (m=1) ... 124 6.1.2 Planning phase (m=2) ... 124 6.1.3 Establishment phase (m=3) ... 124 ix6.1.4 Realisation phase (m=4)... 124 6.1.5 Hand-over phase (m=5) ... 124 6.1.6 Generation phase (m=6) ... 125 6.1.7 Reference project ... 126 6.2 Qualitative analysis ... 129 6.2.1 Global ... 129 6.2.2 Finland ... 130 6.2.3 Energy ... 132 6.2.4 Wind power ... 133
6.2.5 The project-life cycle ... 137
6.3 Sensitivity analysis ... 139
7
Conclusions ... 141
7.1 Investment recommended, but not risk free ... 142
7.2 Contribution ... 142
8
Final remarks... 145
8.1 Suggestions for further research ... 145
8.2 General applicability of the results and model ... 145
References ... 147
Appendix 1: Developer survey ... 1
Appendix 2: Interview questionnaire ... 1
Appendix 3: Excerpts from financial evaluation ... 1
Table of figures
Figure 1: The preliminary total energy consumption in Finland 2013 ... 3
Figure 2: Electricity consumption by different energy sources in Finland ... 4
Figure 3: The research process ... 20
Figure 4: The PESTEL framework ... 22
Figure 5: Porter’s five forces model ... 25
Figure 6: The SWOT matrix ... 30
Figure 7: XLPM's project life cycle model ... 32
Figure 8: XLPM's tollgate decision making process ... 33
Figure 9: The CL2-model ... 41
Figure 10: The MA pyramid ... 43
Figure 11: The life cycle of a WDRES... 45
Figure 12: A map of Finland and its main regions ... 57
Figure 13: Electric supply 1970-2012 ... 64
Figure 14: Electricity generation with renewables 2000-2012 ... 65
Figure 15: The Nordic power system, price and flow at 17.08 2014-03-03 ... 68
Figure 16: The historic spot price on Nord Pool in Finland... 69
Figure 17: Prognosis of the future spot price in Finland ... 71
Figure 18: The FIT described with Finnish electricity prices from 2013 ... 76
Figure 19: Total installed capacity as of May 2014 [MW] ... 79
Figure 20: The largest actors and project clusters ... 81
Figure 21: The Finnish main transmission grid... 85
Figure 22: To the left: Annual average wind speed (m/s) at 100 m To the right: Annual average electricity production (MWh) at 100 m ... 88
Figure 23: The project pipeline up until 2015 ... 89
Figure 24: The project life cycle of onshore windpower in Finland... 94
Figure 25: Onshore wind power tendering process ... 110
Figure 26: Spot price prognois in price area Finland ... 128
Figure 27: Estimation of when the FIT system is full. ... 134
Table of tables
Table 1: The proposed 2030-targets on EU-level ... 56
Table 2: Finland's national and climate targets ... 62
Table 3: Overview of the nuclear reactors in Finland ... 65
Table 4: Installed wind capacity in the FIT system as of May 2014 ... 80
Table 5: Project pipeline after 2015 ... 89
Table 6: Fingrid's grid development plan 2012-2022 ... 91
Table 7: Cost structure of a typical 3 MW wind turbine... 115
Table 8: Fingrid's Grid connection solutions and fees 2014 ... 115
Table 9: Grid service fees 2014 in Fingrid’s transmission grid ... 121
Table 10: Summary of main costs during the project process ... 122
Table 11: Comparison of the same project started at different times ... 128
Table 12: Project pipeline with estimated time of commencing operations. . 134
Abbreviations and definitions
Brownfield - A project from TG1-TG3CAPEX - Capital Expenditures
CCS - Carbon Caption and Storage
CO2 - Carbon dioxide
EA - Energy Authority
ECB - European Central Bank
EIA - Environmental Impact Assessment
EOW - End-of-warranty
GHG - Green House Gases
Greenfield - A project at TG0
IEA - International Energy Agency
IPCC - Intergovernmental Panel on Climate Change
IRR - Internal Rate of Return
ITT - Invitation to tender
LCOE - Levelised Cost of Energy
NDA - Non-disclosure agreement
NPV - Net Present Value
O&M - Operation & Maintenance
OEM - Original Equipment Manufacturer
OPEX - Operational Expenditures
PLCM - Project Life Cycle Model
R&D - Research & Development
RES - Renewable Energy Source
TG - Tollgate
WACC - Weighted Average Cost of Capital
WAsP - Wind Atlas Analysis and Application Program
WDRES - Weather Dependent Renewable Energy Source
XLPM - Excellence in Project Management
Units
MWe - Megawatt electricity
Wh - Watt-hour = 3600 Joule
VA - Volt-ampere – the apparent power in an electrical
circuit
1 Introduction
This chapter introduces the background of this study and briefly mentions the drives and incentive to explore Finland’s wind power sector. The purpose and problem analysis is presented to allow the reader to gain understanding of the study’s objectives before winding up with delimitations and the target group.
1.1 Background
The issue of global warming and climate change has been widely discussed over the last decades and several international organisations have been created due to this cause. Meanwhile, climate sceptics have worked in counter-organisations against the claim of anthropological influence. In the fifth (and latest) report from the Intergovernmental Panel on Climate Change (IPCC) the panel states that it is “extremely likely [95 percent confidence] more than half of the observed increase in global average surface temperature from 1951 to 2010 was caused by the anthropogenic increase in greenhouse gas concentrations and other anthropogenic forcings together”1, thus virtually
ensuring that humankind is responsible for climate change.
Two of the main sources of greenhouse gases (GHG) emissions are electricity production and transportation. Both sectors’ emissions primarily come from combustion of fossil fuels. The energy production of fossil fuels can be traced back hundreds of years and is considered one of the main factors behind the industrial revolution. The dependence of fossil fuels, which are a finite source of energy, is a significant political power factor impacting society on a global level. This is one of many reasons why alternate energy sources have developed over the last centuries like hydro or nuclear power.
In the most western countries, both collaborative unions like the EU and individual nations have recognised that the GHG emissions level are too high and thus created legislations and incentives to lower them. This has led to a rapid expansion of renewable energy sources (RES) like wind and solar power as well as increased R&D within renewable energy. To promote the expansion of RES most countries offer the producers some kind of subsidy as investments in RES have difficulties to break-even. The government in Finland recently initiated an ambitious feed-in tariff system for wind power and plants fuelled with biogas, forest chips and wood-based fuels2 that has enticed a few
1 (IPCC, 2013)
2 (Finland's Ministry of Employment and the Economy, 2013) 1
Swedish wind power developers to enter the wind power market in Finland. This decision has incited other actors on the Swedish wind power market, where the green certificate system is the incentive to pursue profits, to evaluate the business case in Finland.
The climate changes have forced the world’s governments to implement preventative measures, like the Kyoto Protocol. However, not all governments acknowledge the situation or are willing to sign binding agreements to lower GHG emissions. In an attempt to be the role model for the rest of the world, the European Union (EU) has legislated an ambitious energy and climate policy. In 2007 the EU introduced the 20-20-20 targets, which consists of three main objectives to be reached by 20203:
• Reduce GHG emissions by 20 % from 1990’s level. • Improve energy efficiency by 20 %.
• Increase share of energy produced with renewable resources to 20 % of the final energy consumption.
The targets were set for the entire union. However, differentiated targets were developed for each country in the case of objective three, this to equalize the burden between all nations as some countries already met the quota. For example Finland, where hydro plants and power plants combusting biomass fuels already produced over 20 % of the national energy consumption. Thus, Finland’s target was set to 38 % by the EU4.
3 (European Commission, 2014a)
4 (Finland's Ministry of Employment and the Economy, 2013, p. 7) 2
Figure 1: The preliminary total energy consumption in Finland 20135
The share of renewables (hydro, wind and wood-based fuels) was approximately 28 % of the total energy consumption, thus falling 10 % short of the 2020-target. As seen in figure 1 above, Finland net imports almost 4 % of the consumed energy, which corresponds to ~19 % of the consumed electricity in Finland6. The electricity mix for 2012 is shown in figure 2 below
(the statistics of 2013 were incomplete at the time the study was published):
5 (Official Statistics of Finland (OSF), 2014a) 6 IBID Oil; 23% Hard coal; 11% Natural gas; 8% Nuclear; 19% Net import electricity; 4% Hydro; 3% Wind; 0,2% Peat; 4% Wood-based fuels; 24% Other; 4%
Energy consumption 2013
3Figure 2: Electricity consumption by different energy sources in Finland7
As seen in figure 2, the share of fossil fuels has greatly decreased in comparison with other energy sources. It is worth noticing how hydro power’s share of the energy consumption is only 4 %, while in electricity production is around 20 %. The overall share of renewables in the electricity consumption is slightly higher than in the energy consumption. Since Finland still has some way to go to meet the 38 % quota it is noteworthy that a new nuclear reactor is under construction and supposed to begin commercial operation in 2016. This will increase the installed nuclear capacity by 58 % (2740 MWe installed today and the new reactor is 1600 MWe) and thus affect the production mix significantly8. Also, Finland is dependent on electricity imports, since a few
years back mainly from Sweden, as the current national production corresponds to roughly 80 % of the final consumption. The National Energy and Climate Strategy put emphasis on the importance to become self-sufficient, which intends to be accomplished by the new reactor (and another two in the project pipeline) and continued expansion of especially wind power.
Figure 2 states that wind power accounts for less than one percent of the production 2012 which corresponds to ~0.5 TWh. In 2013 the production 7 (Official Statistics of Finland (OSF), 2013)
8 (World Nuclear Association, 2014)
Nuclear; 26% Oil; 0,3% Hard coal; 8% Natural gas; 8% Other fossil fuels; 1% Peat; 4% Hydro; 20% Wind; 1% Black liqour; 6% Other wood-based fuels; 6% Other RES; 1% Other energy sources; 1% Net import; 21%
Electricity consumption by energy
source 2012
4
grew rapidly to ~0.8 TWh. As the official political target for 2020 is 6 TWh, a substantial gap and opportunity is recognised for industry growth9. The
Finnish government introduced a generous feed-in tariff system in 2011 to strengthen the incentives for wind power expansion, which has made the national business case of interest to further evaluate.
1.2 Problem analysis
The expansion of renewable energy is soaring over the globe, making different kinds of stakeholders take interest in new geographical markets which seem to have great potential. However, the energy market is unique in many ways, for instance its extremely politicised and in many parts of the world nationalised. Depending on which market, or RES, a developer will face different issues to enter a market. Transmission grids over the globe are unevenly integrated due to this, but the EU is pursuing a target of total grid integration which impacts Finland and its electricity market. Also to consider, there are also several different ways to transform energy and electricity so that it can be used in society. Combustion, nuclear, renewables – all of them have pros and cons in regard to both economic and environmental factors. Also, the market is close to perfect competition, thus the supply and demand deciding the spot price making the electricity producers vulnerable to sudden demand changes.
Wind power in Finland shows promising potential due to the newly introduced feed-in tariff system combined with the political target to increase the produced electricity from wind farms by a factor of 12 over the next six years. To determine whether it actually poses a prospective market, information about what drives the industry and current market situation must be collected and analysed. All phases of the lifecycle of a wind farm must also be investigated to explore different actors on the market, legal implications, and probable timeframes for each phase. Lastly, the costs and revenues related to a wind farm must be described to assess the financial viability of a project.
1.2.1 Weather-dependent renewable energy sources (WDRES)
Most RES share similar traits compared to other energy sources and industries:
9 (Finland's Ministry of Employment and the Economy, 2013, p. 33) 5
• A capital-intense business with often lengthy timeframes for project delivery.10
• Almost negligible life cycle GHG-emissions compared to traditional energy sources.11
Different RES’ may be categorised according to their relation with weather/climate variability12:
• Not affected: Geothermal and tidal energy.
• Somewhat affected: Bio energy and hydro power are related to weather on a seasonal time scale.
• Directly affected: Wind power, photovoltaic, solar thermal and other solar concentrated power resources correlates perfectly with fluctuating weather conditions.
Hence, the directly affected RES are weather-dependent. Other traits this particularly category share is:
• Fixed O&M-costs and low variable O&M-costs (particularly due to repairs and spare parts)
No anthropologically induced fuel keeps the variable O&M-costs at minimum.13
1.3 Purpose
The purpose of the study is to explore the current theories of assessing the attractiveness of a new market for a developer within renewable energy sources. Finland’s gratuitous feed-in tariff system for wind power combined with ambitious political goals make the market attractive to explore for domestic and international wind power developers. Thus another purpose is to determine if there are viable business conditions for a developer to enter the Finnish wind power market.
The information needed may be obtained through examining the answers of a few questions.
10 (Fontana, et al., 2012; EIA, 2013) 11 (Sovacool, 2008)
12 (von Bremen, 2010) 13 (EIA, 2013)
6
• How should a RES developer assess the attractiveness of a new market?
• Are there viable business opportunities to enter the Finnish wind power market?
o What is the market structure today? o What are the key drivers?
o Which are the essential risks?
By answering these questions thoroughly a developer should have the appropriate information to either pursue or leave a potential market. Compressing the answers of the questions are however appropriate as the answers most likely interlace one another.
1.4 Delimitations
Every nation has their own bureaucracy and permit process, thus a somewhat generalizable model has to be seen as a framework and not a step-by-step map to assess any market. The study will focus on well-developed markets like the Nordic, but will still be applicable to assess any geographical market. Wind is a dynamic phenomenon and its unpredictability affects the confidence level of the study. The study will rely on wind maps based on the purely statistical WAsP-model, which does not include any actual wind measuring. The Finnish electricity market is part of Nord Pool Spot Exchange and interconnected with the Nordic and Baltic countries. Despite the size of the marketplace, the spot price is highly volatile and highly correlated with seasonal variations. The uncertainties of the future spot price will be dealt with by assessing and comparing different Nordic actors’ long term prognosis. The study will not cover the funding of RES projects in any way due to the stretch of financial capabilities depending on the developer.
1.5 Target group
The business perspective of the study especially targets stakeholders within the energy industry, especially companies within the wind industry whom consider Finland to be a market worth exploring. The study does approach the industry from a developer’s point of view. The academic perspective addresses graduate students and academics in engineering, but also economics and environmental sciences due to the possible applications of the findings.
1.6 Report outline
Chapter 1: Introduction – This chapter introduces the reader to and sets the scoop of the study. It starts with the background of renewable energy targets and why Finland has chosen to expand in wind power. This is followed by the problem analysis in which the WDRES concept is introduced. The purpose of the study is stated together with the main questions the study is to answer. The study’s delimitations and target group is also explained.
Chapter 2: Methodology– This chapter starts by describing available and applicable methods and research strategies. Further on the chosen method is described in depth. At the end the research process is outlined and criticism of the chosen method and sources are included.
Chapter 3: Theoretical framework – This chapter describes available theories-for analysis of a WDRES market. It includes models theories-for analysis and mapping of the; macro environment, the industry, strategic decision making and the project life cycle. Towards the end of the chapter several widely used models for investment capital budgeting are explained and the last subchapter gives a theoretical background of wind power.
Chapter 4: Model – This chapter introduces the developed CL2-model. The
model was developed as the theories in the chapter 3 were found to generic and in need of modification to be used on markets for WDRES. The model includes market assessment, analysis of the RES-lifecycle and quantitative and qualitative evaluations all explain in detail. The RES-lifecycle is divided into five sub-phases; analysis, planning, execution – establishment, execution – realisation, execution – hand-over and generation.
Chapter 5: Case study - Finland – In this chapter the CL2-model is applied for
analysis of the Finnish wind power market. Firstly a market assessment for four levels; global, Finland, energy and wind power is conducted by analysing each level for; as/is, future and risks. The second part of the chapter outlines the process of building in wind power and describes each sub-phase listed in the last paragraph by analysing; activities, stakeholders, financial, future and risks.
Chapter 6: Evaluation – This chapter evaluates the findings for the Finnish wind power market presented in chapter 5 with CL2-model. First a
quantitative evaluation is conducted by applied the capital investment theories to a Finnish wind power project. The second part is a qualitative
analysis of several levels and the project-life cycle. The chapter is ended by a sensitivity analysis.
Chapter 7: Conclusion – This chapter presents the conclusions and answers the main questions stated in the purpose. It reveals under which circumstances an investment in Finland is recommended and which the essential risks are. It also states the study’s main contributions.
Chapter 8: Final remarks – In this chapter suggestions for further research is presented together with a discussions and comments on the general applicability of the results in the study.
2 Methodology
The methodological choices made in the study are presented in this chapter, along with some generic theories concerning the subject. The chosen methodological approach is presented at the end of the chapter, including the research process and a critical discussion about the choice of approach.
2.1 Methodology approach
In the beginning of a study a methodology is determined. The purpose of the methodology is to present a general idea about the approach the researchers will use when conducting the study without in detail explain every step of the process.14
A study’s research purpose and objectives influence its methodological approach. An exploratory approach is used to look into an area with limited knowledge to gain fundamental understanding of the subject. When the objective is to merely describe a field and state facts about it, without explaining why things are in a certain way, a descriptive approach can be used. When the objective is to more deeply look into a field and explain how factors interact and affect each other or to answer the question of why something occurs an explanatory approach can be used. A predictive approach is used to give a prognosis or predict what will likely happen in the future.15
A researcher moves between the empirical world where data is gathered and the theoretical world in which theories and concepts are created or used. An inductive approach is used when the researcher collects facts and data about several cases and then uses them to build a general understanding or theory. The opposite, when a general theory is applied onto several empirical cases to reach a conclusion, is called a deductive approach.16
2.2 Research strategies
A research strategy is a general strategy chosen in accordance with the purpose of the study and does not include specific research methods17. The
four most applicable research strategies for a master thesis within applied science are: surveys, case studies, experiments and action research18.
14 (Höst, et al., 2006, p. 29)
15 (Lekvall & Wahlbin, 2001, pp. 196-198) 16 (Arbnor & Bjerke, 2009, pp. 90-91) 17 (Denscombe, 2009, p. 26)
18 (Höst, et al., 2006, p. 30)
11
The survey approach is suitable when the study has a wide approach, mapping out the details of a subject. A survey strives to describe a phenomenon at a certain point in time, usually at the time when data is collected. The research is executed by conducting empirical data collection, either through literature studies but most often by collecting new data in the field. The most commonly used methods for data collection with this research strategy are described in section Data collection19. If a survey is conducted on a small population, the
population as a whole can be used. If the population is large, a smaller sample can be selected to represent the whole population20.
Case studies are in-depth studies of a presently existing phenomenon or object to find the cause of a problem or to understand a situation. Since the selection of the study object is not random, the findings can seldom be generalised, but sometimes the results can be applied on similar cases.21
Experiments are conducted in controlled environments allowing the researcher to adjust variables to see how they affect the phenomenon. An experiment is usually repeated with new variable settings. Experiments have a fix design; once the experiment has started the design cannot be changed.22
Action research studies problems and situations which occur in the activities of everyday working life. It strives to involve the people studied in both planning and executing the study to make them feel comfortable, participate actively and be receptive to the findings. The study is cyclic; the first findings suggest changes which then are implemented and evaluated. If necessary a new study may be started to suggest even further improvements and this new study can build on the findings of the first one.23
2.3 Data collection
When collecting data one needs to distinguish between primary and secondary information. Secondary information has been collected previously by other researchers and is usually gathered through literature studies. Primary information is collected by the researcher, often through; written questionnaires24, direct observations, and/or interviews. Data can also be
19 (Denscombe, 2009, pp. 25-26) 20 (Höst, et al., 2006, p. 31) 21 (Höst, et al., 2006, pp. 33-34) 22 (Höst, et al., 2006, pp. 36-38) 23 (Denscombe, 2009, pp. 169-170) 24 (Lekvall & Wahlbin, 2001, p. 261)
12
collected through experiments which are described in the previous section. When using secondary information its compatibility needs to be considered since the data might have been collected with another purpose or classified in a way not suitable to the new study. To which extent the data is correct is known as trustworthiness and also needs to be considered.25
2.3.1 Written questionnaire
The most well-known type of surveys is the written questionnaire. These are usually sent to a large number of respondents by post, e-mail or posted on a website. The written questionnaire is seen as impersonal since it is sent without prior notice and since the questionnaire is the only mean of communication between the researcher and the respondent. The subject of the survey and the length of the questionnaire affect people’s willingness to respond which is frequently low; resulting in a return rate around 20 %.26
2.3.2 Direct observations
A direct observation is conducted by observing a present situation. Since data is only gathered during the observation, time and place affects the result and need to be chosen carefully. Observations can be conducted with low or high interaction between the observer and observant, also, the observant’s knowledge of being observed can be either high or low.27
2.3.3 Interviews
Interviews are used to collect data about complex situations and gain understanding of people’s feelings, thoughts and experiences. They are also used when examining sensitive issues or subjects with privileged information. Interviews can be divided by their level of structure and the media used when they are carried out.
In structured interviews the questions, the order of the questions and the answering options are predetermined. All respondents follow the defined structure which makes a quantitative analysis a good option due to the standardised form of data.28
In semi-structured interviews a list of questions and subjects intended to cover is used. Compared to a structured interview the interviewer is more 25 (Arbnor & Bjerke, 2009, p. 180)
26 (Denscombe, 2009, pp. 27-28) 27 (Arbnor & Bjerke, 2009, p. 181) 28 (Denscombe, 2009, pp. 233-234)
13
flexible about the order in which the subjects are covered. The interviewee is allowed to talk freely about the subjects he or she wants to, resulting in less structured, but more in-depth, data. When conducting an unstructured interview the interviewer introduces a subject and lets the interviewee talk freely for as long as he wants about the subject. The differences between semi-structured and unsemi-structured interviews are small and sometimes the interview technique used is a combination of the two.29
There are three ways of communicating with respondents when conducting interviews: personal interviews, telephone interviews or online interviews.30
A personal interview has flexibility in the way the questions are asked and the answers recorded and are usually semi-structured or unstructured. Disadvantages are primarily high cost and time consumption. Telephone interviews can be described as a combination of written questionnaires and personal interviews. Computer aided support for telephone interviews has developed fast during recent years giving it more of the flexibility found in personal interviews. Telephone interviews are less time consuming and costly compared to personal interviews.31
Online interviews are usually conducted as written questionnaires. There are two main types and the difference between them has to do with how the respondents are chosen. If it is possible to find a sample big enough to represent the whole population and if all of them are believed to have internet access, the questionnaire can be distrusted to them through email or posted on a website. The other way is to build a “panel” of people with certain criteria and interest to participate in a study. When the study is decided a sample is selected from the panel.32
2.4 Sampling
When conducting research on a large population not everyone in the population can be included due to time and cost restraints. Instead a smaller group called a sample is selected. For larger populations a random sample is used and the belief is that this sample is representative for the total population so that the results can be generalised. When conducting in-depth studies on smaller populations a subjective sample can be used. This sample is 29 (Denscombe, 2009, pp. 233-234)
30 (Lekvall & Wahlbin, 2001, pp. 261-262) 31 (Lekvall & Wahlbin, 2001, pp. 265-267) 32 (Lekvall & Wahlbin, 2001, pp. 267-269)
14
not chosen due to its representativeness of the population, instead the people in the sample are believed to have knowledge or other insights of a subject which are useful for the study.33
2.5 Qualitative and quantitative data
Data can be either qualitative or quantitative which affects both the gathering and analysis. Qualitative data is usually presented as words or pictures while quantitative data is presented numerically. Quantitative analysis is done by calculations or the use of statistics and qualitative analysis by reasoning presented as text or figures. Respectively data is generally analysed by the corresponding analysis. Qualitative data can also be analysed with a quantitative method e.g. calculating the number of times a word occurs in a paragraph. Quantitative data can also be analysed qualitatively e.g. reasoning about a company’s result and balance sheet.34
2.6 Credibility
When evaluating the credibility of a study three factors need to be considered; validity, reliability and representativeness35.
Validity is a measurement of how the study’s data collection measures what it intends to measure. One way to ensure the validity in written questions is to have them reviewed by a person with knowledge with in the field. The reviewer should immediately get a feeling whether the questions seem reasonable to measure the intended subject or not. This method is known as face validity36. Another way to increase the validity of a study is to use
triangulation by studying the object with more than one method37.
Reliability measures the method’s ability to withstand outer situational influences during the collection. If a data collection can be redone several times giving the same or at least similar result the reliability is considered high.38
Representativeness concerns whether the results can be generalised. A survey or an experiment may only be generalised to the population from which the 33 (Denscombe, 2009, pp. 32-33)
34 (Lekvall & Wahlbin, 2001, p. 213) 35 (Rosengren & Arvidson, 2002) 36 (Lekvall & Wahlbin, 2001, p. 304) 37 (Höst, et al., 2006, p. 42)
38 (Lekvall & Wahlbin, 2001, p. 306)
15
sample was made. However, case studies or action researches are seldom considered generalised due to the subjective sample of object.39
2.6.1 Achieving credibility
To ensure the validity in the interviews and the written questionnaire the questions were formulated to be clear and unbiased and they were reviewed by individuals with industry knowledge. After the interviews the result was shared with the interviewee to ensure he or she was not misinterpreted. Together with the clearly formulated questions this has ensure reliability in the interviews. To ensure overall credibility, multiple sources was used and examined critically throughout the data collection. When sources with conflicting views were found both views was used if they were believed to give a more balanced and holistic picture. Otherwise both sources were confronted when possible.
2.6.1.1 Triangulation
A common tool to achieve credibility in the findings is through triangulation, which means that the researcher use different sources when studying an object40. When triangulating data, two different approaches are often used41:
• Informant triangulation is when the researcher use different kinds of data sources when studying the same object, for instance combining interviews and literature.
• Time triangulation is when the researcher use data which has been collected at different times.
Depending on the object, a combination of the approaches mentioned above may increase the credibility even further. Triangulation is often defined as “a combination of methods used to study the interrelated phenomena from multiple and different angles or perspectives”, thus if properly applied in a qualitative research approach, the validity of the research could be considered high.42
2.7 Chosen method
Initially an exploratory approach was used to identify relevant theories to assess a geographic market for a WDRES, in particular wind power. The exploratory study revealed a gap in the theory, thus the CL2-model was 39 (Höst, et al., 2006, p. 42) 40 (Rothbauer, 2008) 41 (Denscombe, 2009, p. 186) 42 (Rothbauer, 2008) 16
created to fill this gap. The produced model was then applied in the second phase in which the key drivers in the market, the interaction between actors, and project process were identified and described with a combination of a descriptive and predictive approach. Finally an explanatory approach analysed the accumulated information of the market to explain the interaction of different factors as they laid ground to the concluding evaluation concerning the overall attractiveness of the market. An inductive approach was used as the study concerns if the market is attractive to enter rather than how the market should be entered.
The study covers a broad scope thus the research strategy used was a survey approach. At first secondary data was collected through literature studies to scan and evaluate theories and present a general overview of the Finnish wind power market. As the study proceeded, knowledge gaps were discovered in some areas. Thus, in-depth studies of these areas were conducted to create a complete picture of the market. These studies were primarily conducted through personal and telephone interviews with experts in respectively field. Both primary and secondary data was obtained as some respondents referred some material to other sources.
Subjective sampling was used to select the interviewees as the main subject of the interviews greatly varied due to the present gap of knowledge and the interviewees’ core competencies. Both officials from several authorities together covering the whole planning and permitting process and wind developers were interviewed to triangulated information about the market from the two main perspectives, that off the authorities and that of the wind developers. As time was not a big constraint but costs were, personal interviews were preferred when not causing long and expensive trips. Four authority officials and two wind developers were interviewed in person and two wind developers by telephone. All interviews were semi-structured to ensure coverage of all topics needed to fill the information gaps and also to let the developers speak freely and in that way point out information that had not been considered beforehand. The interview questionnaire was validated beforehand through face validation with a wind developer. Information from the interviews that was referred to in the report has been sent to the respectively interviewee for them to control the interpretation. The final report has also been sent to many of the interviewees as they have been interested in the findings.
Several presentations given by authority officials and wind developers were attended during the Vaasa Wind Exchange conference in March 2014.
A written questionnaire was sent out to 52 actors on the Finnish wind power market, they were selected through subjective sampling and the majority were; consultants, wind developers and investors. The questionnaire was validated through face validation with a developer beforehand. Since many of the actors in the market are international and since both Finnish and Swedish are official languages in Finland, the questionnaire was available in Finnish, Swedish and English. 12 answers were received, giving a return rate of 23 %, slightly more than the expected rate.
Both qualitative and quantitative data was collected and used in the study as they complemented each other in the pursuit of creating a comprehensive picture of the market. The theoretical framework included several models in which different types of data were preferred. The quantitative data was analysed through quantitative methods and the qualitative through qualitative methods. To increase the validity of the study, triangulation was implemented thoroughly through the process, both by using primary and secondary information and by interviewing industry professionals with different perspectives. To ensure the validity of the produced model, the preliminary drafts were presented to professionals and master thesis students in the studied field. The discussions led to minor updates to the final model.
The quantitative method was validated by comparing the answers to answers from a model used in the industry with input data from a wind turbine in the market and data from a Finnish wind power project. The project consists of 12 turbines, which is an average size for installed capacity as well as the project pipeline.
2.7.1 Criticism of chosen method
The choice of using an exploratory method in the beginning of the study was suitable to gain a first overview of the market. The further in-depth study used both a descriptive and predictive approach, which was suitable as both the current and future market needed to be analysed.
The study has gathered information on the Finnish wind power market, as many market it is dynamic and continuously evolving. The explanatory findings describe the current market conditions and the predictive findings make qualified guesses and prognoses for the future. Thus if the study would
be repeated soon after it was finished the reliability would be high. The further into the future the study is repeated the less will the reliability be since the market conditions change as time goes by.
The qualitative analysis was based on the collected information but also on the experience, business aptitude and beliefs of the researcher thus decreasing the reliability of the study. To decrease this risk clear connections and references to the empirical chapter was made in the analysis.
The validity of the study has been insured by validation of interviewee questionnaires, written questionnaires and the CL2-square model beforehand
through face validation.
It is in the nature of a WDRES-project that several factors affecting the projects profitability varies from site to site. Thus in order to be able to evaluate projects quantitatively, assumptions have to be made. Therefore the quantitative results should be seen as an indicator of the profitability instead of an absolute number. The reference project was selected as it represents an average of projects in the market to give an indication of the market as a whole. Projects with better and worse fundamental conditions existed in the market.
The developed model was tested by application to the Finnish wind power market which is a geographical market for one type of WDRES. The findings of this study are therefore not generalizable to all WDRES on all geographic markets. The chosen method was nevertheless considered the best alternative for validating the model giving time and other constraints of the study. The results of the study can be seen as an indicator of the models usability but further studies will have to show if it is applicable to other markets.
As the findings of the study were presented to industry professionals and academia the authors received valuable feedback that was used to further improve the study.
2.8 Research process
The research process was semi-structured over the time period when the study was produced with iterations between the phases, the process is visualised in figure 3.
Figure 3: The research process
2.9 Source criticism
A variety of sources were used to cover many perspectives and build a comprehensive knowledge of the study object. Secondary information was collected from; books, reports, law texts and websites, as knowledge gaps were found they were filled by primary information from interviews. All sources were thoroughly examined and the original source has always been search for.
People in general have different experiences and perspectives depending on their background, believes and profession that is also the case in the wind industry. This was compensated for by the use of triangulation, by selecting interviewees through selective sampling from authorities and both Finnish and international wind developers. Information received from the primary data collection was used if it was verified by several respondents or could also be found in secondary sources.
Defining the issue of the study Litterature studies of existing theories Designing the CL2- model Case study of Finland with the CL2- model Verification of the model's applicability 20
3 Theoretical framework
To be recognized as a scientific study, the structure of the empirics and results must rest on a stable foundation of acknowledged theoretical framework. This chapter present relevant theories to be used as foundation in order to assess the objective of the study. The presented frameworks are later developed in chapter 4 were a new framework for the study is created.
3.1 Theoretical approach
To assess the attractiveness of investing in a geographical market for WDRES energy production several factors needed to be analysed. Such a market is highly politicised, regulated and also affected by the macro economy. These and other macro-factors are covered by the PESTEL framework. The framework was chosen to be used for mapping the macro-environment since it gives the most complete picture for the WDRES market.
When assessing the attractiveness of a geographical market one also needs to understand the actors and drivers in the national industry for the particular WDRES of interest. Porter’s five forces is a model that gives a complete mapping of an industry with concern to its drivers, actors and how the profitability is divided. As it is widely used and covers the factors of interest to us it was chosen for the industry analysis.
Investing in renewable energy project is a long process. Understanding the tasks involved, the time frame and the risks requires a full understanding of the process. The project lifecycle model XLPM was chosen for this since it has sufficient number of phases and is generic enough to cover the process of investing in all types of WDRES projects.
Finally as for all types of industrial investments capital budgeting is also need for these types of energy projects. The NPV-model and the IRR-model, complementing each other and giving solid evaluations of investments with long time horizons were chosen for this. They were complemented by the energy industry specific calculations of levelised cost of energy.
3.2 Mapping the macro-environment
43Figure 4: The PESTEL framework
The PESTEL framework is used to scan and describe the macro-environment. It stands for Political, Economic, Social, Technological, Environmental and Legal. At first the framework was introduced just as PEST, then legal was introduced and the letters rearranged to SLEPT. Later on environmental became a factor and the abbreviation PESTEL became a concept presented in most corporate strategy literature. Lately, two more factors has been introduced, Ethics and Demographic, and the framework called STEEPLED. This study will apply the PESTEL framework.
PESTEL identifies sub-factors that cause both opportunity and threat. It is often used to identify trends that particularly may impact the market, the so called key drivers. PESTEL is not a complete science, but is a useful tool to get a general idea of a market situation.
3.2.1 Political
The political situation is a critical factor when mapping a market, and it could concern multinational, national or even the local political climate. A stable political climate is often preferred, as instability may lead to for instance policy changes affecting current business situations and profits. Identifying political trends that would change the current situation could, if used correctly, turn out very beneficial and alter present competitive advantages. The time until the next election could turn out to be vital within some industries.
43 (Johnson, et al., 2009; Mind Tools, 2014a; Communication 18 Ventures, 2014abcde)
Business
Political Economic Social Technological Environmental Legal 22Sub-factors to the overall political climate are for instance tax policies, tariffs and other subsidies, trade restrictions and policies on state regulation/deregulation. Bureaucracy and the timeframe for processing authorization to initiate operations on the market are also of concern.
3.2.2 Economic
The economic climate depends on a number of factors such as economic growth, interest rates and exchange rates. A region which experience stagnated growth and bad future outlook is often less favourable due to the increased risks of doing business there. Some industries are dependent of access to capital and the cost of capital, which also could be a deal breaker. However, the financial system is highly globalized which at least should lead to reasonable access to capital.
The labour market is another important aspect. A rising unemployment rate combined with decreasing disposable income of the consumers indicates less favourable economic conditions. Depending on the needed skill of the labour force, opportunities may arise. A large labour supply and need for low-skilled workers may imply low labour costs as opposed to a low-skilled labour supply when high-skilled labour is needed.
3.2.3 Social
Social aspects of a region may include demographics, religion, age distribution and the overall culture. The way of doing business varies greatly depending on the underlying culture. Mapping the social factors helps to understand the market and customers. The attitude towards change differs between regions thus new products may be accepted on some market whereas some markets may refuse them completely. However, these softer aspects are often difficult to quantitatively measure even though they impact the business potential greatly.
3.2.4 Technological
A significant uncertainty concerns the emergence of new technologies with potential to impact the business. It could be brand new technology developed by for instance university or research institutes, but it could also be technology transfers to more rural regions where the level of technology has been low. High-tech regions are often more adaptive to the newest technology, but the actual impact of a new technology may be greater when a simpler, but more “useful”, product is introduce on a low-tech market. The different needs in different regions may also affect the use of a certain technology – such as
the widespread use of mobile payments in Africa while this method is less common in the more industrialised countries of the world.
3.2.5 Environment
The importance of environmental issues has increased over the last decades creating new vital aspects that must be considered when conducting business. There is a slight negative correlation between environmental and economic factors as being environmental friendly often incurs increased costs. The raised awareness of global warming and corporate social responsibility has pushed companies to adapt their footprint and conform to the new standards set by society.
3.2.6 Legal
The legal systems may vary a lot between regions and present certain advantages or disadvantages for businesses. Labour laws and consumer laws are of importance for companies’ ability to perform business in different regions, some countries are less restricted concerning for instance the rights of the labour force. Another factor regards the level of how the legal system is upheld or if it is easily corrupted.
3.3 Analysing the industry
44To people in general as well as to managers and strategists, competition is what appears between two companies selling the same products on the same market. This is a narrow idea of competition correctly defined as direct competition. An industries profitability is effected not only by direct competition but by several actors; customers, suppliers, potential entrants, and substitute products. These actors impact an industry’s competiveness and are described in The five competitive forces that shape industry competition more commonly known as “Porter’s five forces” after its originator the Harvard Business School professor Michael E. Porter.
Industries are very different from one another. The global auto industry and the heavily regulated European health care delivery industry do not seem to have much in common when looking at them at a glance. But their underlying competitive forces and attractiveness can both be analysed with the competitive forces.
When the forces are strong as they are in the airline, hotel and textile industries hardly any company is profitable. When the forces are favourable 44 (Porter, 2008; Porter, 1998)
24
as they are in software, soft drinks and toiletries many companies earn an attractive return on investment. As seen in the previous examples, both emerging and mature, high tech and low tech industries, products and services can be profitable depending on their structure and dominant competitive forces. In the short run many factors can affect an industries attractiveness, for example the weather and the business cycle. But in the medium and long run the competiveness is driven by the competitive forces.
Figure 5: Porter’s five forces model45
3.3.1 Threat of new entrants
New entrants bring more capacity to the market and try to gain market shares which put pressure on prices and costs and increase the need for investments. Companies entering from related markets can use their existing cash flows and competences and raise the level of competition. The threat of new entrants depends on how hard the entry barriers are to overcome and what reactions a new entrant expects from the incumbents. Since the threat of intruders, forces companies to invest and keep competitive prices, it is the threat of and not the actual new entrants that are the force.
3.3.1.1 Entry barriers:
1. Supply side economies of scales – occurs in industries with large fixed cost where a large production gives economies of scales and decreases the unit price. An entry needs to be large scale or the entrant will have to accept a cost disadvantage.
45 (Porter, 1998)
Rivalry among existing competitors Threat of new entry
Bargaining power of buyers Threat of substitute product or services Bargaining power of suppliers 25
2. Demand side benefits of scales – these benefits arise when customers are more likely to use a service when many other customers do. This is also known as network effects and an example is that many people use eBay since they know that many others do which increase the reach to potential customers.
3. Customer switching costs – the fixed cost that a customer needs to pay when switching from one supplier to another. These costs arise if the customers have to change product specifications, retrain its employees or redesign its business processes.
4. Capital requirements – the need to invest large amounts of capital in start-up cost such as facilities or inventory to be able to compete. The barrier grows higher for irrecoverable investments such as, advertising or research and development. The importance of capital requirements as a sole barrier should not be overstated. If an industry has large capital requirements but shows a potential for long-term profitability and the capital markets are well functioning there should be investors willing to supply capital for an entrant.
5. Incumbency advantages independent of size – no matter their size existing actors have advantages that are not available to entrants. They can come from various sources such as brand identity, stores in the best location or efficient production as a result of long experience and development.
6. Unequal access to distribution channels – new entrants must gain access to existing distribution channels or create new ones. A new food product must compete with existing ones over the shelf space in supermarkets through lower prices or promotions. The low cost airlines choose to skip the old way of distributing through travel agencies and started selling their tickets on their own websites instead.
7. Restrictive government policies – governmental policies can increase entry barriers through regulation of industries such as liquor retailing, environmental or safety regulations that increase the need of economies of scales or by hard patenting regulations making it harder to imitate existing technologies. On the other hand a government can
also decrease the entry barriers through subsidies or by funding research and making the results publicly available.
In addition to the entry barriers the expected reactions from existing actors in the market can also scare off new entrants. If incumbents previously have protect their markets from new entrants decisively and shown this publicly that will scare off new entrants. The attractiveness for new entrants also decreases if the existing actors have important resources such as financial resources, access to productive capacity or close ties to the distribution channel. If the market growth is low new entrants will have to take market shares from the incumbents to grow and can therefore expect big retaliations. If the industry has big fixed costs and excess capacity the existing players are likely to cut prices to fill their capacity pressuring the profitability for new entrants.
3.3.2 The power of suppliers
Powerful suppliers can influence an industry by raising prices, decreasing quality of products or services or shifting cost upwards in the value chain. If companies in the industry cannot shift their raising cost over to their customers by raising prices this decreases the profitability of the industry. The following industry conditions increase the power of suppliers: When an industry is dominated by a few large suppliers selling to many smaller buyers. The industry is not an important customer to the supplier. If the industry only makes up a small fraction of the suppliers sales they will get less attention and worse terms. When the supplier’s product is of strategic importance for the buyer and it is hard for the buyer to build a stock of the product. If there is a switching cost for the buyer when changing supplier. The supplier is a seriously potential entrant to the industry through forward integration. The lack of substitute products decreases the competition and the possibility to balance power for smaller buyers.
Another form of supply is that of labour. In industries where there is a shortage of highly skilled and strategic important professionals or if the labour is highly unionized the power of labour is high.
3.3.3 The power of buyers
Powerful buyers influence an industry by demanding low prices, higher quality in products or services and try to get this by playing the competitors against each other, all these action decrease the industry profitability.
The following industry conditions increase the power of buyers: The number of buyers is low or a single buyer accounts for a large fraction of the total sales of a supplier. This is especially true in industries with large fixed costs. If the industry accounts for a large share of the buyers overall procurement they are willing to spend money and time to shop for good prices and terms. Standard or undifferentiated products make it easier for buyers to switch supplier and have suppliers compete for ones business on price. The supplier switching cost is low. Low profitability gives high incentives for lowering purchasing costs. Buyers with the knowledge of doing things in-house know the cost of production, leveraging price negotiations. They are also a credible threat of expanding into the suppliers business by backward integration. The quality of the buyers’ product is not affected by the quality of the industry’s product. The market price, the cost of production and demand is known to the buyer. 3.3.4 Threats from substitutes
Substitutes are products from other industries providing the same or similar function and therefore competing for the same customers. The definition seems clear but finding all of one industry’s substitutes can be a challenging task. When shopping for a father’s day gift, a tie and a power drill are considered as substitutes. A substitute for buying a new product is to buy a used one, not buy one at all or to do it or produce it in-house instead. Substitutes have low switching costs and they limit industries profitability and often growth potential.
Customers compare price-performance ratios for substitutes form different industries limiting these industries profitability. Collective industry investments in marketing, quality improvements and availability can decrease the power of substitutes.
The most dangerous substitutes are those with an improving price-performance ratio compare to that of the industry and those in highly profitable industries. The second one is likely to look for new business opportunities if their profit margins are decreased by increasing competition. A company’s strategy needs to be adapted to its substitutes, either by fighting them or when that is not possible planning for adapting to their existence. 3.3.5 Rivalry among existing competitors
Price discounts, product introductions and advertising campaigns are forms of rivalry among existing competitors. Competitors within the same industry are interdependent, if one of them takes action it will affect the others which are