Measuring the performance
of a preventive maintenance
programme for heavy trucks
-from a life cycle profit perspective
Andreas Bernspång
Zoltan Kali
Department of Industrial Management and Logistics
Division of Production Management
Lund Institute of Technology
Lund University
Supervisors:
Professor Hans Ahlmann, Lund Institute of Technology
Anna Pernestål, Scania Commercial Vehicles AB
Sven Egerhag, Scania Commercial Vehicles AB
Measuring the performance of a preventive maintenance programme for heavy trucks
Preface
This Master’s thesis, conducted in the fall of 2010, marks the end of our four and a half year long education in Industrial Engineering and Management at Lund University, Faculty
of Engineering.
The project was conducted at Scania CV in Södertälje at the department Vehicle Service
Information in assistance with Production Management within Department of Industrial Management and Logistics at Lund University, Faculty of Engineering. We have gained
great insights to the world of heavy truck maintenance and a whole new understanding of the life cycle profit perspective. The work has been intense and challenging, but at the same time very inspiring.
We would like to thank our supervisors at Scania CV, Anna Pernestål and Sven Egerhag for your support, feedback, and for always challenging us with new angles of approach. It has been very valuable for us that you have always taken time for discussions and questions throughout the entire project.
Professor Hans Ahlmann, our supervisor from Department of Industrial Management &
Logistics, your experience and commitment to the field of study has been an invaluable
asset to the project. The sources of information you have provided us with has been a great help and the inspiration and understanding you have given us has kept us motivated and on track. Thank you!
We would also like to thank Linda Helsing for the co-operation when conducting interviews. Last but not least, we would like to thank all of those who have contributed to the project through interviews, discussions, and feedback. Without your sacrifice we would not have been able to complete the project.
Södertälje, January 18th 2011
Measuring the performance of a preventive maintenance programme for heavy trucks
Abstract
Title:
Measuring the performance of a preventive maintenance programme for heavy trucks - from a life cycle profit perspectiveAuthors:
Andreas Bernspång Zoltan KaliSupervisors:
Hans Ahlmann, Professor, Department of Industrial Management and Logistics, Lund Institute of TechnologyAnna Pernestål, Project Manager, Scania Commercial Vehicles AB
Sven Egerhag, Senior Engineer Maintenance Programme, Scania Commercial Vehicles AB
Problem:
Scania Commercial Vehicles (Scania CV) initiated the project, as aresult of a vision regarding future preventive maintenance (PM) programmes. This vision and its core concepts will impose great changes to the way PM for heavy trucks are viewed upon at Scania CV. Within this vision many questions have risen, one of which is:
How does one measure the performance of a preventive maintenance programme for heavy trucks?
Purpose:
The result of the project will work as a tool when evaluating PM programmes for heavy trucks within Scania CV. The foundation of the measurement system rests upon identifying crucial factors with emphasis on the life cycle profit (LCP) for heavy trucks. Quantifying crucial factors within the measurement system will result in a set of maintenance performance indicators (MPI:s), which will be decisive for the customer’s, i.e. the hauler’s, profitability. The objective of the project is to:Develop a set of MPI:s, which forms a system that measures the performance of PM from a LCP perspective.
Inference on how to measure the set of MPI:s.
Evaluate Scania CV’ present PM programme according to the developed measurement system.
Measuring the performance of a preventive maintenance programme for heavy trucks
Delimitations:
For the projects feasibility two delimitations have to be taken intoconsideration. The first delimitation is that the design and customer specification of the vehicle is given. In other words, the vehicle has already been delivered and the specifications of the vehicle cannot be changed, even if it would be beneficial for the customer’s LCP. The second delimitation is that only Scania CV’ existing customers are considered and the study is confined to the Swedish market.
Methodology:
As a foundation for this project the authors performed, among other things, theory studies of the life cycle concepts, internship at heavy truck workshops, interviews with specialists within the field of heavy truck maintenance and interviews with the end users, i.e. the haulers. The approach has been systematic and aimed at mapping the current situation in order to identify key performance indicators.The main theoretical approach for the project has been action research based, with an initial case study as a foundation for the action research approach. However, several research strategies and methods were applied in order to have a broad approach to the study in question. Regarding the empirical collection of data, both quantitative and qualitative data has been collected.
Conclusion:
In the development of the measurement system the project has found three main MPI criteria: economic, availability and customer satisfaction related MPI:s. Furthermore, the project has come to the conclusion that scrutinizing the MPI:s separately can result in sub-optimization or wrongful conclusions of the PM programme’s performance. A comprehensive view is required when regarding the system. Moreover the MPI system has been ordered according to a multi-criteria hierarchical structure, in order to provide a better overview of the MPI:s, which allows management at different levels to focus on MPI:s that concern them directly. The project strived to have an unbiased approach when developing the MPI system. The project disregarded if the measures used in the MPI:s seamed difficult to measure, as long as they were not impossible to measure. The unbiased approach allowed the project to fully focus on the objective of the MPI system, developing a system that measures the performance of PM. The project found that there are crucial measures which will always have difficulties regarding their measuring process, irrespectively of resources or efforts invested in the measuring process.Measuring the performance of a preventive maintenance programme for heavy trucks
Keywords:
Maintenance performance indicator (MPI), life cycle cost (LCC), lifecycle profit (LCP), preventive maintenance (PM), corrective maintenance (CM), maintenance management, heavy truck maintenance, maintenance performance measurement (MPM).
Measuring the performance of a preventive maintenance programme for heavy trucks
Abbreviations
3PL : Third Party Logistics
BSC : Balanced Scorecard
BULCC : Best Uptime and Life Cycle Cost
CBM : Condition Based Maintenance
CM : Corrective Maintenance
LCC : Life Cycle Cost
LCP : Life Cycle Profit
LCR : Life Cycle Revenue
MPI : Maintenance Performance Indicator
MPM : Maintenance Performance Measurement
MRD : Maintenance and Reliability at the Design Phase
MRRD : Maintenance, Reliability, and Redundance at the Design
Phase
MSC : Maintenance Scorecard
MTTF : Mean Time to Failure
PDM : Predetermined Maintenance
PI : Performance Indicator
PM : Preventive Maintenance
Measuring the performance of a preventive maintenance programme for heavy trucks
Table of Figures
Figure 2.1 ... 5 Figure 2.2 ... 6 Figure 4.1 ... 15 Figure 4.2 ... 18 Figure 4.3 ... 22 Figure 4.4 ... 23 Figure 4.5 ... 24 Figure 4.6 ... 26 Figure 4.7 ... 27 Figure 4.8 ... 28 Figure 4.9 ... 29 Figure 5.1. ... 31 Figure 5.2 ... 34 Figure 5.3 ... 35 Figure 5.4 ... 38 Figure 5.5 ... 40 Figure 5.6. ... 41 Figure 5.7 ... 41 Figure 5.8 ... 42 Figure 5.9 ... 42 Figure 5.10 ... 42 Figure 5.11 ... 43 Figure 5.12 ... 43 Figure 5.13 ... 43 Figure 5.14 ... 44 Figure 5.15 ... 44 Figure 5.16 ... 46 Figure 5.17 ... 48 Figure 6.1 ... 57 Figure 6.2 ... 62 Figure 6.3 ... 68 Figure 6.4 ... 70 Figure 6.5. ... 72 Figure 6.6 ... 72 Figure 6.7 ... 73 Figure 6.8. ... 73 Figure 6.9 ... 75 Figure 7.1 ... 82 Figure 7.2 ... 85 Figure 7.3 ... 85 Figure 7.4 ... 87 Figure 7.5. ... 87Measuring the performance of a preventive maintenance programme for heavy trucks Figure 7.6 ... 88 Figure 7.7 ... 89
Measuring the performance of a preventive maintenance programme for heavy trucks
Table of Contents
1 Introduction ... 1
1.1 The Company Scania Commercial Vehicles ... 1
1.2 Purpose ... 2
1.3 Delimitations ... 2
1.4 Target Groups ... 3
2 The Organization of Workshops and Dealerships ... 5
2.1 Organization Map ... 5
2.2 Scania CV’ Workshops and Dealers in Sweden ... 6
3 Methodology ... 9 3.1 Research Strategies ... 9 3.1.1 Exploratory Research ... 9 3.1.2 Explanatory Research ... 9 3.2 Research Methodology ... 9 3.2.1 Preparatory Research ... 10 3.2.2 Case Study ... 10 3.2.3 Action Research ... 10
3.3 Methods for Gathering Data ... 11
3.3.1 Literature Review ... 11
3.3.2 Observations ... 11
3.3.3 Interviews ... 11
3.4 Quantitative and Qualitative Data ... 12
3.5 Validity and Reliability ... 13
3.6 Practical modes of procedure ... 13
3.6.1 Participating Observation ... 13
3.6.2 Literature Review ... 13
3.6.3 Interviews ... 14
3.6.4 Data Collection ... 14
4 Maintenance Theoretical Framework ... 15
4.1 Maintenance Strategies ... 15
4.2 Preventive Maintenance ... 16
Measuring the performance of a preventive maintenance programme for heavy trucks
4.2.2 Predetermined Maintenance ... 17
4.3 Corrective Maintenance ... 17
4.4 Scheduled Maintenance ... 17
4.5 Maintenance Crucial Parameters ... 18
4.6 Efficiency and Effectiveness ... 19
4.7 Performance Measurement Systems ... 20
4.7.1 Maintenance Performance Measures ... 21
4.7.2 Balanced Scorecard ... 21
4.7.3 Maintenance Scorecard ... 23
4.7.4 Maintenance Performance Indicator ... 25
4.7.5 Multi-criteria Hierarchical Framework for MPM ... 25
4.8 Life Cycle Perspective ... 26
4.8.1 Life Cycle Cost ... 26
4.8.2 Life Cycle Profit ... 27
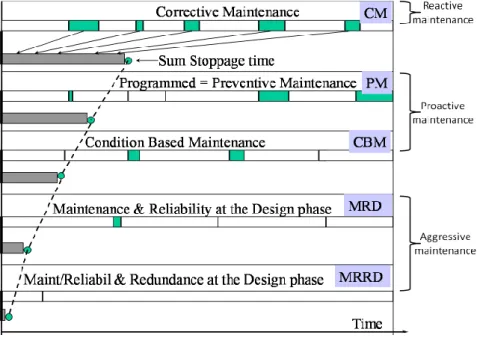
4.9 Effect of Maintenance Strategies ... 28
5 The Hauler Industry ... 31
5.1 Positioning in the Business System ... 31
5.2 Maintenance Terminology ... 32
5.3 Differences to Manufacturing Industry ... 33
5.4 Definitions within the Hauler Industry ... 34
5.4.1 Availability ... 34
5.4.2 The Hauler´s LCP ... 34
5.4.3 Cost and Non-realized Revenue Elements for a Haulage Company ... 36
5.5 Maintenance Scorecard for the Hauler Industry ... 38
5.6 Cost Allocation in the Hauler Industry ... 40
5.6.1 Improvement Potentials ... 46
5.7 Economic Figures ... 47
5.7.1 Working Hours per Year ... 49
6 Development of the MPI System ... 51
6.1 Economic Impact ... 51
6.1.1 Impact of Planned Maintenance Activities ... 51
Measuring the performance of a preventive maintenance programme for heavy trucks
6.1.3 Maintenance Impact on Profitability ... 52
6.2 The Set Takes Shape ... 56
6.3 Economic Tree ... 57
6.3.1 Description of MPI:s in the Economic Tree ... 58
6.4 Availability Tree ... 62
6.4.1 Description of MPI:s in the Availability Tree ... 64
6.5 Customer Satisfaction Tree ... 68
6.5.1 Description of MPI:s in the Customer Satisfaction Tree... 69
6.6 Sub Optimization and Interrelation ... 70
6.7 A Multi-Criteria Hierarchical Structure for Scania CV’ MPI:s ... 74
6.8 Measuring the MPI:s... 76
7 How the MPI system is used ... 81
7.1 Time Frame and Scope ... 81
7.2 Evaluation ... 81
7.3 Development ... 82
7.4 Application of the MPI system ... 82
7.4.1 Vehicle specification ... 82
7.4.2 Calculations ... 83
7.5 Evaluation of Scania CV’ PM Programme ... 85
7.5.1 Adding an Extra PM Occasion ... 86
7.5.2 Impact of More Effective PM ... 88
8 Conclusions ... 91
8.1 Purpose ... 91
8.2 Findings ... 91
8.3 Recommendations... 93
8.4 For Further Research ... 93
Reference list ... 95 Appendix 1 – Interview Questions for Service Sales Representatives ... I Appendix 2 – Interview Questions for Haulers ... V Appendix 3 – MPI tree structures... VII Appendix 4 – Maintenance Material Cost ... XI
Measuring the performance of a preventive maintenance programme for heavy trucks
1
1 Introduction
The aim of Chapter 1 is to provide the reader with a comprehension of the background of this project. This is needed in order to have an understanding for the purpose and delimitations.
1.1 The Company Scania Commercial Vehicles
Scania Commercial Vehicles (Scania CV), with its main office in Sweden (Södertälje), is
today one of the leading manufacturers of heavy trucks, buses and engines for industrial and marine use. Besides vehicles and engines, Scania CV also offers comprehensive service and financing solutions for their products. Being a global player within its business areas results in operations in some 100 countries with the support of 32 300 employees. In addition, Scania CV’ independent sales and service organization employ about 20 000 people. 1
Being the leading company in its industry, both in terms of profitability and brand, is distinguishing for Scania CV. The company’s philosophy, focusing on methods rather than results, is one of the reasons for its success. Result is a consequence of doing the right things the right way and this is the Scania CV motto. This combined with an active strive towards core values: Customer first, Respect for the Individual, and Quality characterizes Scania CV as a company.(2,3)
Only depending on the success of the past, in Scania CV’ case being a brand defined by the equipment, could be devastating for any company in today’s competitive environment. Scania CV’ objective, to supply its customers with optimized vehicles providing the best total operating economy, is leading to a shift in focus. The development from being a traditional manufacturer of commercial vehicles to a total solution provider for its customers is confirmed by the increased share of employees working in sales and services. This is a result of customers increasingly wanting to focus on their core business. 4
A new Scania CV is taking shape, where focus lies on increased and lasting profitability for its customers. This is achieved by offering products and services that give customers high life-time revenues combined with low life-time costs. Consequently, this new shape means that the brand is not only defined by the equipment, as in the past, but also by the life-time profit generated from this equipment.
1 Scania, Scania Group, Scania in brief, retrieved 3 January 2011,
<http://www.scania.com/scania-group/scania-in-brief/>
2 Scania, Scania Group, Philosophy, retrieved 3 January 2011, <http://www.scania.com/scania-group/philosophy/> 3
Scania, Scania Group, Core values, retrieved 3 January 2011, <http://www.scania.com/scania-group/core-values/>
4 Östling L., “Customers profitability in focus”, Scania World 3/2010, Appelberg Publishing Group,
Measuring the performance of a preventive maintenance programme for heavy trucks
2
1.2 Purpose
Scania CV initiated the project, to measure the performance of a preventive maintenance (PM) programme for heavy trucks, as a result of a PM vision. This vision and its core concepts will impose great changes to the way PM for heavy trucks are viewed upon at Scania CV. Within this vision many questions have risen, one of which is: How does one
measure the performance of a PM programme for heavy trucks?
The overall purpose of the project is to find an answer to the question above, i.e. to develop tools for measuring the performance of PM. This is done by studying the performance of PM from a life cycle profit (LCP) perspective. The LCP approach to the question above is in line with the new shape Scania CV is taking, as mentioned in Section 1.1.
The result of the project will work as a tool when evaluating PM programmes for heavy trucks within Scania CV. The foundation of the measurement system rests upon identifying crucial factors with emphasis on LCP for heavy trucks. Quantifying crucial factors within the measurement system will result in a set of maintenance performance indicators (MPI:s), which will be decisive for the customers profitability.
Crystallizing the goals of the project results in the following points:
Develop a set of MPI:s, which forms a system that measures the performance of PM, from a LCP perspective
Inference on how to measure the set of MPI:s
Evaluate Scania CV’ present PM programme according to the developed measurement system
1.3 Delimitations
For the projects feasibility a number of delimitations have to be taken into consideration. The first delimitation is that the design and customer specification of the vehicle is given. In other words, the vehicle has already been delivered and the specifications of the vehicle cannot be changed, even if it would be beneficial for the customer’s LCP.
The second delimitation is that only Scania CV’ existing customers are considered and the study is confined to the Swedish market.
Measuring the performance of a preventive maintenance programme for heavy trucks
3
1.4 Target Groups
The project is intended for Scania CV employees at the departments Vehicle Service
Information and Service Operations as well as the project Best Uptime and Life Cycle Cost (BULCC).
Other parties which can have interest for this project are companies offering products and services similar to Scania CV’. Furthermore, an important target group is within the academic world, i.e. teachers, professors and students who want to gain knowledge about
Measuring the performance of a preventive maintenance programme for heavy trucks
Measuring the performance of a preventive maintenance programme for heavy trucks
5
2 The Organization of Workshops and Dealerships
The following chapter will present an overview of Scania CV’ maintenance organization and the services they provide in Sweden. Since the project is performed at Scania CV it is important that the reader has a basic understanding of Scania CV’ organization and service products.2.1 Organization Map
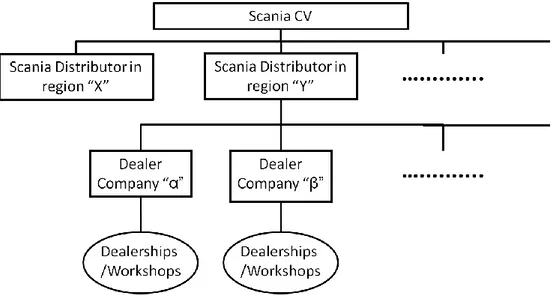
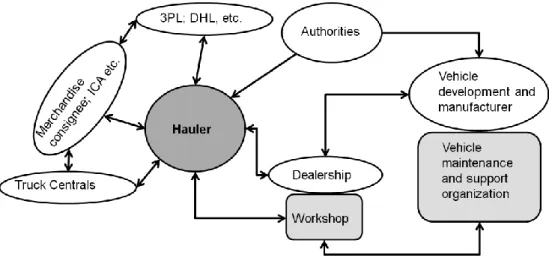
Figure 2.1 illustrates in principle how the organization regarding maintenance and dealership looks like at Scania CV.
Scania CV is the parent company where R&D, production and other corporate functions
exist. Every market or region, where Scania CV is active, is represented by a distributor. The distributor is the link between Scania CV and the dealer companies, who in turn can have one or several dealerships/workshops. The distributors, dealer companies and consequently dealerships/workshops are either independent or wholly owned subsidiaries of Scania CV. On a worldwide basis, approximately two thirds of the 1500 dealers and workshops are wholly owned subsidiary of Scania CV, which is unique in the industry.
Measuring the performance of a preventive maintenance programme for heavy trucks
6
2.2 Scania CV’ Workshops and Dealers in Sweden
In Sweden, Scania CV is represented by a total of 29 dealer companies. These dealer companies cover Sweden with a total of 96 dealerships/workshops, as seen in Figure 2.2. 5
The extent of the services offered by the workshops vary from strictly truck repair and service to total service solutions, which include trailer service, transport refrigeration unit service, vehicle rental, tire service, vehicle washing etc.
The dealerships and workshops also offer maintenance contracts with different extent. In Sweden there are mainly three types of contracts offered; Service contract, Powertrain contract and
Green Card contract. The contracts are beneficiary
for the customers since the maintenance and service activities are discounted, compared to doing them standalone. Furthermore, the contracts are paid periodically or as a lump-sum in advance.
Service Contract
The service contract covers scheduled PM, including materials and labour costs. This contract can be signed from one to two years at a time and there are no restrictions on vehicle age or mileage.6
Powertrain Contract
A powertrain contract covers repairs on the powertrain as well as scheduled PM. The extent of repairs covered is decided upon signing the contract. This contract can be signed for a period of 3-5 years and there is both a mileage and vehicle age limit.7
5 Scania, Careers, Work areas, Sales & Service, retrieved 3 January 2011,
<http://career.scania.com/work_areas/sales_service/>
6
Scania, Tjänster, Verkstadstjänster, Avtal, Tillsynsavtal, retrieved 3 January 2011, <http://www.scania.se/tjanster/verkstadstjanster/avtal/tillsynsavtal.aspx,>
7 Scania, Tjänster, Verkstadstjänster, Avtal, Drivlineavtal, retrieved 3 January 2011,
<http://www.scania.se/tjanster/verkstadstjanster/avtal/drivlineavtal.aspx>
Figure 2.2 Map of Scania CV’ dealership and workshop network in Sweden.
Measuring the performance of a preventive maintenance programme for heavy trucks
7
Green Card Contract
The whole chassis is covered by the Green Card contract, in terms of repairs and PM. As for the powertrain contract, the extent of repairs covered is decided upon signing the contract. The contract can run 3-7 years, usually five years with an option for two more years, and there is both a mileage and vehicle age limit. 8 The Scania CV distributor and dealer/workshop shares the risk in the contract, i.e. if the actual maintenance cost exceeds the pre-paid sum the customer does not have to cover the excess amount.
8 Scania, Tjänster, Verkstadstjänster, Avtal, Grönt Kort-avtal, retrieved 3 January 2011,
Measuring the performance of a preventive maintenance programme for heavy trucks
Measuring the performance of a preventive maintenance programme for heavy trucks
9
3 Methodology
The choice of methodology lays the basis for the work methods in a research project. It is of importance that the reader has knowledge of the academic standing ground and approach applied within the project. Hence the reader can get a better understanding of the validity and reliability of the project, as well as forming an opinion about the quality of the data that has been collected.
3.1 Research Strategies
Research strategies set the basic framework for how to proceed with the research project at hand. It is not intended to describe in detail how the research should be conducted, but should instead show the direction.9
3.1.1 Exploratory Research
The aim of an exploratory research is to learn more about something that is new to the researcher. This strategy of research has great value in the early stages of a research project since, beside illuminating problems and opportunities it also elucidates the field of research. Furthermore the strategy can generate ideas and provide the researcher with insights relevant to the subject of study. In principle there are three methods to conduct exploratory research; literature review, interviewing experts within the field of the study and
interviewing focus groups.(10,11)
3.1.2 Explanatory Research
The explanatory research aims at examining the relationship between cause and effect. By identifying certain variables the researcher can obtain explanations between cause and effect relations. Theories built by utilizing the knowledge gained through explanatory research allow the researcher to predict future effects, given similar circumstances.12
3.2 Research Methodology
The goals and the design of research consist of research methodology, which is the frame for the study. The methodology can be viewed as a general way to approach the research, more clearly the direction, scale and the underlying philosophy which lay the basis for the research project.13
9 Höst M., B. Regnell & P. Runeson, Att genomföra examensarbete, Studentlitteratur AB, Lund, 2006
10 Wrenn B., R.E Stevens & D.L Loudon, Marketing Research: texts and cases, 2nd edn, The Haworth Press Inc.,
Binghamton NY, 2007
11 Saunders M., P. Lewis & A. Thornhill, Research methods for business students, 5th edn, Pearson Education Ltd.,
Harlow, 2009
12
MacNabb D.E, Research Methods for Political Science: Quantitative and Qualitative Methods, 2nd edn, M.E Sharpe Inc., Armonk NY, 2004
13 Denscombe M., Forskningshandboken – för småskaliga forskningsprojekt inom samhällsvetenskaperna, trans.
Measuring the performance of a preventive maintenance programme for heavy trucks
10
3.2.1 Preparatory Research
In many cases researchers begin a research project with a preparatory research. This aims at providing the researcher with a deeper understanding of the subject in study. The review of literature and analysis of available information within the field of study is included in a preparatory research. This research method often generates many ideas for how to proceed further in the research project.14
3.2.2 Case Study
A case study attends one or a few special cases and tries to give a deep explanation of the underlying connections and processes associated with the case. 15 The goal of this strategy is to find general results in a specific case. It is suggested that by focusing on a specific case the researcher might come to conclusions which would not be possible with a wider strategy like surveys. The depth of a case study gives the researcher a possibility to make inference as to why certain results were achieved as opposed to only providing the results. A strength of the case study is that it not only allows but encourages the researcher to incorporate several different sources, research methods and types of data throughout the research. The choice of methods is based on what is suitable for the specific case.
A recurrent question the researcher has to ask himself is whether the results of the case study can be generalized or not. This often becomes a question of how the specific case was chosen or if there exists similar studies where there is accordance in results.
3.2.3 Action Research
The purpose of action research is to build and/or test theory, within the context of solving a practical problem in a real setting. Action research can be regarded as a research approach, rather than a specific method of research. The recognition as a research approach is a result of action research combining theory and practice, researchers and practitioners, and intervention and reflection.16
The action research approach is an iterative process consisting of several steps. It starts with the observation of a situation or phenomenon, in order to identify and clarify the problem which is subject for the research. For the first step the case study method can be used, according to Section 3.2.2. Step two is finding a solution, to the identified problem, and implementing the proposed solution. Following step two is the evaluation of the solution. This third step is of utmost importance, since it puts the solution in a context, providing an opportunity for analysis and reflection of the functionality of the solution. The steps above should be considered as an iterative process, repeated depending of the outcome from step
14 Haviland W.A, H.L Prins, D. Walrath & B. McBride, Cultural anthropology: the human challenge, 12th edn,
Thompson Wadsworth, Belmont CA, 2008
15
Denscombe (2009)
16Azhar S., I. Ahmad & M.K Sein, “Action Research as a Proactive Research Method for Construction
Engineering and Management”, Journal of Construction Engineering & Management, vol. 136, no. 1, 2010, pp. 87-99
Measuring the performance of a preventive maintenance programme for heavy trucks
11
three. If the solution is not satisfying or new problems have risen, the researcher needs to clarify the issues and find a satisfying solution.17
Action research approach has both strengths and weaknesses. One strength is that action research offers a wide explanation of how and why the problem under investigation occurs. This can sometimes be very hard or impossible to answer by statistical or regression models. Furthermore, the natural setting of the research problem can many times prove to be expensive, difficult or impossible to replicate in a restricted research location, e.g. a laboratory. One weakness of action research is that the conclusion derived from a single study has limited generalizability.18
3.3 Methods for Gathering Data
There are different methods for gathering data. None of the methods is completely perfect or completely useless. This is because each method deals with data gathering from certain conditions. The usability of the data, provided from a certain method, depends largely on what the researcher wants to achieve.19
3.3.1 Literature Review
It is of importance for any research project, especially in the beginning of it, to establish an overall perception of the present situation in the field of study. A thorough literature review gives the researcher a solid knowledge basis and reduces the risk to overlook existing knowledge in the field of study.20
3.3.2 Observations
Through observation the researcher has the possibility to collect data in a very tangible way. The observation technique focuses, by directly observing events, on what people actually do instead of only relying on what people say they done or would have done.21 There are two types of observation techniques: systematic and participating observation. Systematic observation is especially used when studying interactions and is characterized by quantitative data and statistical analysis. Participating observation is mainly used when the researcher wants to deeply penetrate an issue and is characterized by delivering qualitative data.
3.3.3 Interviews
Interviews can be used both as a way to gather background information and provide the researcher with information about the current situation. Furthermore, interviews can also provide ideas for solving the problems of the research project. An interview is basically a systematic hearing of a person, concerning a certain topic. Random selection of the
17 Höst et al. (2006)
18 Hales D.N, & S.S Chakravorty, “Implementation of Deming's style of quality management: An action research
study in a plastics company”, International Journal of Production Economics, vol. 103, no. 1, 2006, pp. 131-149
19 Denscombe (2009) 20 Höst et. al. (2006) 21 Denscombe (2009)
Measuring the performance of a preventive maintenance programme for heavy trucks
12
interview subjects is not essential if the research is of a qualitative nature and does not focus on representativeness. Instead it is important that the selection of the interview subjects reflect the variations in the population. As a consequence of non random selection of interview subjects, no general conclusions can be made based on the population which was used for selecting the interview subjects. On the other hand, the researcher is given the possibility to a deep qualitative exploration of the research area.22
The extent of how structured the interviews are can vary between structured,
semi-structured and un-semi-structured. Structured interviews are more or less an oral survey, where
the researcher has a list of questions, each question having several predefined answer options. Furthermore, the order in which the questions have to be answered is fixed. When it comes to the semi-structured interview the researcher still has a list of questions but the order in which they are asked is not fixed. The interview subject is not bound by predefined answer options; instead he or she can give comprehensive answers. As for the un-structured interview the researchers role is to intervene as little as possible. Basically the researcher only starts the interview and introduces the topic, letting the interview subject elaborate his or her ideas.23
3.4 Quantitative and Qualitative Data
Quantitative data is defined as numerical data and data that can be classified. The analysis of quantitative data is attended to with statistical methods. Several different methods of research can be utilized in order to collect quantitative data. These comprise interviews, questionnaires, observations and different kinds of documents. All quantitative data are not numbers when they are collected and must be coded. It becomes important for the researcher to choose how and when to categorize and code the data. (24,25)
Qualitative data comprehends words, pictures and descriptions which are rich with nuances and detail. Qualitative data is attended to with categorization and sorting techniques. As with quantitative data, it can be obtained using several different methods of research. Qualitative data needs interpretation from the researcher in the process of analyzing the results. It is not sufficient to say that the data speaks for itself. The interpretation of the data involves a high demand on the researcher to be thorough when analyzing qualitative data. It is also important for the researcher to be free from prejudice and not to be locked to previously established theories within the field. (26,27)
22 Höst et. al. (2006) 23 Denscombe (2009) 24 Ibid. 25 Höst et. al. (2006) 26 Denscombe (2009) 27 Höst et al. (2006)
Measuring the performance of a preventive maintenance programme for heavy trucks
13
3.5 Validity and Reliability
Reliability concerns the trustworthiness of a research method. This includes both the collection and analysis of data. The reliability of a research method is characterized by its ability to reproduce data in a consistent way on repeated trials. However there will always be a presence of chance error no matter how reliable the method is. (28,29)
While reliability concerns the trustworthiness of a research method, validity addresses the issue of measuring what is intended to be measured. When concerning validity the following questions should also be raised: Is the data relevant for the field of study? Was
the data collected in the right way? Failing to satisfy the questions raised above results in
the information, although accurate, being useless. Using different methods of scrutiny for an object, that is triangulating, one can achieve higher validity. The combination of reliability and validity is essential for the outcome of the research quality. (30,31)
3.6 Practical modes of procedure
The practical modes of procedure describe how the research has been conducted and how conclusions are reach within the scope of the research project.
3.6.1 Participating Observation
The project was initiated with observations which entailed working at a Scania workshop, performing repairs and PM, during three days. It had the objective of illuminating how the delivery of the service products takes place.
3.6.2 Literature Review
The literature review has the focus of elucidating different aspects concerning maintenance, performance measurement as well as the LCP perspective. The theoretical foundation of this project lies in various books, articles and papers within relevant fields of research. The literature review is conducted as a desk study review and much effort will be made towards finding the theories which most adequately can be applied towards maintenance of heavy trucks.
Iterative methods will be applied when conducting the literature review and as the project precedes those fields of research which are of interest will be studied further.
28 Carmines E.G, & R.A Zeller, Reliability and validity assessment (Quantitative Applications in the Social
Sciences), Sage Publications Inc, Thousand Oaks CA, 1979
29 Höst et. al. (2006) 30 Ibid.
Measuring the performance of a preventive maintenance programme for heavy trucks
14
3.6.3 Interviews
The empirical data for the project is to a large extent based on interviews that have been conducted during the course of the project. Initially, internal interviews were made with different Scania employees in order for the project to grasp the scope of the problem at hand. As the project have preceded additional interviews with Scania employees, as well as maintenance and hauler industry organizations have been made. All of the interviews were conducted in co-operation with another master student, who carried out a similar project. The co-operation was initialized in order to rationalize the interview processes for both projects. Furthermore all of the interviews above where in the form of open discussions. The interview subjects were chosen based on their position within their respective organizations.
To seize the hauler perspective, twelve interviews with service sales representatives have been made. The service sales representatives each have a large customer portfolio and by interviewing them the opinions of several customers are brought to light. The service sales representatives work at the different workshops and the interview objects were chosen such that all of Sweden was represented. The interviews were semi structured with a fixed set of questions but without fixed answer alternatives. The questions can be found in Appendix 1. Five haulers, representing different transport segments, have also been interviewed to validate the information received from other interviews. The project only gained access to a limited number of customers and the choice of interview subjects were based on which haulers that were able to conduct interviews. The interview questions can be found in Appendix 2.
All interviews have been conducted face to face with the exception of: one interview with a service sales representative and three of the customer interviews. In addition most of the interviews have been recorded. All of the interviews were conducted in Swedish.
3.6.4 Data Collection
Quantitative data has been collected from several sources. In those cases where primary data has been unable to collect secondary data as well as assumptions have been made. The assumptions made are based on the conducted interviews.
Financial statistics concerning hauler companies have been accessed through the database
“AffärsData”. Data on cost allocations within the hauler industry have been collected from
the Swedish hauler industry organization, Sveriges Åkeriföretag. Data on cost and time for maintenance is gathered from Scania CV’ database.
Measuring the performance of a preventive maintenance programme for heavy trucks
15
4 Maintenance Theoretical Framework
The theoretical framework lays the foundations for the project. In the development of the MPI system it is of great value to study previous theoretical findings within performance measurement. General principles and terminology within maintenance theory are further explored to give the project an understanding of how maintenance can affect profitability.
4.1 Maintenance Strategies
The strict definitions of maintenance terminology presented in Sections 4.1-4.4 are based on the Swedish standard for maintenance terminology, SS-EN 13306:2010, which is also a European Union standard. The standard specifies generic terms and definitions for the technical, administrative and managerial areas of maintenance. Correct and formal definitions are required in order to give readers a full understanding of the maintenance terms used.
Maintenance is defined as32
“Combination of all technical, administrative, and managerial actions during the life cycle of an item intended to retain it in, or restore it to, a state in which it can perform the required function.”
The definition states that activities designed to either prevent an item from failing or correct the function of an item that has already failed is considered as maintenance. As seen in Figure 4.1 maintenance can be divided into two main strategies; corrective and preventive maintenance which will be further examined in the following sections.
Figure 4.1 Maintenance overall view (SS-EN 13306:2010)
32 SS-EN 13306:2010 Maintenance–Maintenance terminology, 2nd edn, Swedish Standards Institute, Stockholm,
Measuring the performance of a preventive maintenance programme for heavy trucks
16
4.2 Preventive Maintenance
PM is defined as33
“Maintenance carried out at predetermined intervals or according to prescribed criteria and intended to reduce the probability of failure or the degradation of the functioning of an item.”
PM comprises all maintenance activities performed on an already functioning item with the intention of decreasing its failure rate. The item to be maintained could either be replaced or reconditioned depending on the wear and tear of the item. The failure rate of an item is its probability to fail over a given period of time. As illustrated in Figure 4.1 PM can be divided into two sub categories, namely condition based maintenance (CBM) and
predetermined maintenance (PDM).34
4.2.1 Condition Based Maintenance
CBM is defined as35“Preventive maintenance based on performance and/or parameter monitoring and the subsequent actions.”
The use of CBM is dependent on the ability to monitor the condition of an item. There are two main strategies on how to monitor the condition of an item;
Inspection – A person inspects the item at regular intervals and performs maintenance when needed or possible
Condition monitoring – A parameter is measured and when it reaches a certain predetermined level, maintenance is performed
Condition monitoring is often followed by some sort of estimation of when the monitored item will fail. This method of scheduling maintenance is referred to as predictive maintenance. CBM is especially suited when the failure rate is dependent on operating conditions rather than time. When failure rate depends on operating conditions PDM is not optimal. (36,37)
33 SS-EN 13306:2010 (2010)
34 Coetzee J.L, Maintenance, Trafford Publishing, Victoria BC, 2004 35 SS-EN 13306:2010 (2010)
36 Coetzee (2004)
37 Bengtsson M., Condition based maintenance systems: An Investigation of Technical Constituents and
Measuring the performance of a preventive maintenance programme for heavy trucks
17
4.2.2 Predetermined Maintenance
PDM is defined as38“Preventive maintenance carried out in accordance with
established intervals of time or number of units of use but without
previous condition investigation.”
A requirement for PDM to be effective is that the item, on which maintenance is performed, has a failure rate which increases with the aging of the item. The maintenance intervals for the item are decided based on age, running hours, distance travelled or number of uses.39
4.3 Corrective Maintenance
Corrective maintenance (CM) is defined as40“Maintenance carried out after fault recognition and intended to put an item into a state in which it can perform a required function.”
CM is the wait-for-failure strategy and does not entail any prediction of when an item will fail. Depending of the failed items impact on the functioning of the system it is in, maintenance could either be performed immediately or be scheduled at a later point in time as illustrated by Figure 4.1. This is a strategy applied most often when it is difficult or even impossible to make inference on when an item will fail. CM is commonly referred to as repair.(41, 42)
4.4 Scheduled Maintenance
Scheduled maintenance is defined as43
“Maintenance carried out in accordance with established time schedule or established number of units of use.”
By the pure definition of scheduled maintenance, PM is positioned as a scheduled maintenance activity. It should be pointed out that CM can also be positioned as a scheduled maintenance activity, depending on if the failing item is critical for the function of the system. When maintenance cannot be scheduled it has to be performed immediately and is thus called an immediate maintenance activity.
38 SS-EN 13306:2010 (2010) 39 Coetzee (2004) 40 SS-EN 13306:2010 (2010) 41 Bengtsson (2004) 42 Coetzee (2004) 43 SS-EN 13306:2010 (2010)
Measuring the performance of a preventive maintenance programme for heavy trucks
18
4.5 Maintenance Crucial Parameters
The total time an item is intended to be used is called the planned operating time and is denoted T. It is not to be confused with the total time it could be operating which for instance could be 24 hours a day. Whenever the item is inoperable for maintenance purposes a down state is imposed. The total time the item is in its down state is called
downtime and is denoted D. Apart from maintenance purposes there could be other
limitations preventing the item from being used. These include staff meetings, idling and set up times. These activities will be summarized into waste which is denoted W.
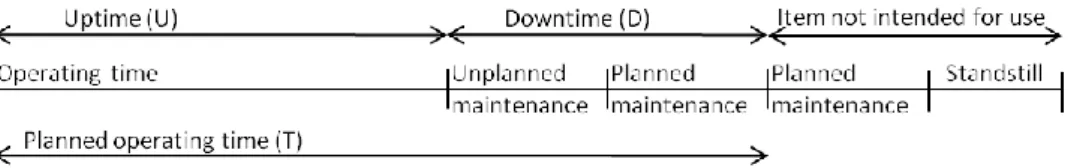
When the item is operable it is in an up state. The total time the item spends in its up state is called uptime and is denoted U. The relationship between planned operating time, downtime and uptime can be formulated according to Equation 4.1 and Figure 4.2. 44
Equation 4.1
Figure 4.2 The relationship between planned operating time (T), downtime (D), and uptime (U) is illustrated.
Availability
Availability is a measure of the capability to keep an item in a functional state, such that it
can perform its required task.45 Availability is given as the ratio between the time an item could be utilized and the time it was planned to be utilized, as showed in Equation 4.2.
Equation 4.2
where A is the availability, T the planned operating time, D the downtime and U the uptime. The measure A gives the ratio between the actual operating time and the planned operating time. The measure is independent of the cause of the downtime and merely gives us the share of time which we could use an item for its intended purpose. 46
44 Coetzee (2004) 45 Ibid.
46 Nakajima S., Introduction to TPM, trans. Productivity Press Inc. Cambridge 1988, Japan Institute for Plant
Measuring the performance of a preventive maintenance programme for heavy trucks
19
Failure
A failure is defined as47
“Termination of the ability of an item to perform a required function”
Failure is an event and describes when an item fails. The item will then be in a faulty state until its required function is restored. Failure can aim at both the failure of a specific component and the failure of a system that consist of a large number of components.
Mean Time to Failure
Mean time to failure (MTTF) is the average operating time between two consecutive
failures of an item. 48 While the availability presents the average percentage uptime MTTF measures the regularity at which an item needs to be maintained. MTTF is often considered as a measure of reliability. It is given according to Equation 4.3.
Equation 4.3
where N represents the number of failures over a period of time. With an increase in MTTF the item will be able to operate over a longer period of time without failure.
4.6 Efficiency and Effectiveness
The clear definitions of efficiency and effectiveness depend largely on which context these measures are used in. In an economic productivity context, efficiency is defined as a ratio, consisting of what is produced to what is needed to produce it. As seen in Equation 4.4, the ratio can also be explained as the total output of e.g. goods, divided by the total input of e.g. labour or raw materials. In fact, any input can be used in the denominator. 49
Equation 4.4
47 SS-EN 13306:2010 (2010) 48 Coetzee (2004)
49 Frankel M. & J.W Kendrick, Productivity (economics), Britannica Online Encyclopedia Academic Edition,
Measuring the performance of a preventive maintenance programme for heavy trucks
20
Effectiveness is derived from effective, meaning the ability of producing an intended result. The ability to achieve intended results can be measured, as illustrated in Equation 4.5, through dividing the goals set by the actual results achieved.50
Equation 4.5
4.7 Performance Measurement Systems
An organization reaches its goals, according to the marketing perspective, by outperforming its competitors. The outperformance is accomplished through superior efficiency and effectiveness when it comes to customer satisfaction. So, in a business context, performance can be defined as the efficiency and effectiveness of actions. Using a set of metrics to quantify the efficiency and effectiveness of actions, results in a performance
measurement system.51
A performance measurement system can be used for strategic and day-to-day operations of the organization, control and implementations of improvements, and monitoring of these. It is important that the performance measurement system has a clear orientation towards the organizational strategy.(52, 53)
Furthermore, establishing the relationship between the internal measures (causes) and the external measures (effects) is a significant objective of a measurement system.
From a maintenance perspective the performance measurement system can be adopted by the MPM concept. If linked to performance trends a MPM system can be used to highlight business processes, areas etc. within maintenance that need to be improved in order to fulfil the organizational goals. In other words MPM enables a solid basis for establishing where maintenance related improvements are most appropriate at any given time. Furthermore a MPM system can be utilized as a foundation for benchmarking and the data from a MPM system can also be used as a marketing tool. 54
The concept of measuring maintenance process activity is not a new phenomenon; it has been around for a long time. Mainly in the form of scorecards or indicators measuring; maintenance cost per unit, maintenance budget, non-availability index due to maintenance
50Miller G.A, R. Tengi, H. Langone, A. Ernst & L. Jose, effective/effectiveness, Princeton University: WordNet–A
lexical database for English, retrieved 20 December 2010,
<http://wordnetweb.princeton.edu/perl/webwn?o2=&o0=1&o7=&o5=&o1=1&o6=&o4=&o3=&s=eff ective&h=100001000000000000&j=7#c>
51 Neely A., M. Gregory & K. Platts, “Performance measurement system design: A literature review and research
agenda”, International Journal of Operations & Production Management, vol. 25, no. 12, 2005, pp. 1228-1263
52 Parida A. & U. Kumar, “Maintenance performance measurement (MPM): issues and challenges, Journal of
Quality in Maintenance Engineering, vol. 12, no. 3, 2006, pp. 239-251
53 Parida A., Development of a multi-criteria hierarchical framework for maintenance performance measurement
– Concepts, issues and challenges, Doctoral Theses no. 2006:37, Luleå University of Technology, Luleå, 2006
Measuring the performance of a preventive maintenance programme for heavy trucks
21
etc. A shortcoming of these indicators has been the lack of linkage to the corporate level. Instead the indicators are often stand alone and isolated to the shop-floor or operational area only. 55
4.7.1 Maintenance Performance Measures
Commonly used maintenance performance measures can be divided, depending on what they focus on, into three categories.56
I. Measures of equipment performance II. Measures of cost performance III. Measures of process performance
Availability, reliability and overall equipment effectiveness are all possible measures of equipment performance (I), while measures used for following up cost performance (II) can be maintenance labour and material costs. When measuring process performance (III) e.g. the ratio between planned and unplanned maintenance work can be used.
Often the reasons for keeping track of the measures I-III can be derived to habit or because the measures has always been used by the organization. Mimicking other organizations and because the data collection is easy are further reasons for keeping track of the measures I-III.
The measures I-III are of diagnostic character and they are mainly chosen to support operational control and benchmarking of maintenance performance. Being backward looking and introspective distinguishes these measures, besides being biased towards the financial and process perspective of maintenance.
In order to establish the benefits of maintenance to the success of the organization, performance measures must be linked to the strategy of the maintenance function.
4.7.2 Balanced Scorecard
Only focusing on the traditional performance measurement systems, like financial accounting which measures return-on-investment and earnings-per-share, is inadequate for the demands of today’s competitive environment. A specific shortcoming of the traditional financial measures is the fact that they report past events. This results in an inadequate tool for managers to improve present and future performance.
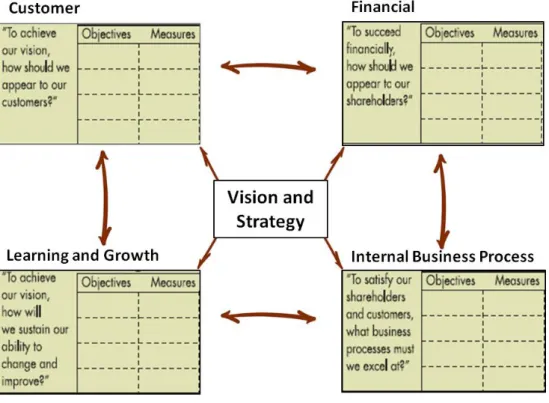
As illustrated by Figure 4.3, the balanced scorecard (BSC) emphasizes four perspectives which are crucial for any business. These perspectives reflect on financial and customer measures as well as on learning and growth and internal business process measures. While traditional financial measures give information on the happenings in the past, without
55 Parida (2006)
56
Tsang A.H.C., “A strategic approach to managing maintenance performance”, Journal of Quality in Maintenance Engineering, vol. 4, no. 2, 1998, pp. 87-94
Measuring the performance of a preventive maintenance programme for heavy trucks
22
indicating how managers can improve performance in the future, the BSC functions as the cornerstone of a company’s current and future success. The information from the four perspectives balances the external measures, like operating income, and internal measures, like new product development. The BSC allows senior managers to focus on the above mentioned four perspectives, but at the same time avoids overburdening them with information by limiting the number of measures used.
Figure 4.3 The four perspectives of the BSC (Altered from Kaplan and Norton 2007)
By gathering different factors the BSC results in a sole management report. The measures of the scorecard are also closely tied to the organization’s strategic objectives. Furthermore, the BSC illuminates all the important measures together and diminishes thereby risks of sub-optimization in the organization, i.e. advocating an improvement in one area, which in turn will result in deterioration in one or several other areas.
It is important to point out that there is no general BSC template that is applicable to all business. Diverse product strategies, competitive environments and market situations demand different scorecards. The BSC should be developed so that it suits the business unit’s mission, strategy and culture. De facto, a crucial test of the BSC’s prosperity is its
Measuring the performance of a preventive maintenance programme for heavy trucks
23
transparency. One should be able to observe the business unit’s competitive strategy just by looking at the 15-20 measures of the scorecard. (57,58)
4.7.3 Maintenance Scorecard
The cause and effect interrelationship, from a maintenance angle, can be mapped by implementing the BSC concept with production and maintenance in focus, giving rise to the
maintenance scorecard (MSC). The basis for the MSC is the leveraged effect of increased
maintenance performance. The leveraged effect consists of the internal efficiency supporting the external effectiveness. Figure 4.4 illustrates the leveraged effect of maintenance performance. Increased maintenance performance results in less maintenance related disturbance in production, offering higher supply availability. Furthermore it leads to products with higher or consistent quality. Higher supply availability and increase in quality will act as value drivers for the market strategy, resulting in increased demand from customers. The leveraged effect of increased maintenance performance reflects the total effectiveness of the business, resulting in growing profitability.59
Figure 4.4 The leveraged effect of maintenance performance (Ahlmann 2002)
57 Kaplan R.S. & D.P. Norton, “The Balanced Scorecard-Measures That Drive Performance”, Harvard Business
Review, vol. 70, no. 1, 1992, pp.71-80
58 Kaplan R.S. & D.P. Norton, ”Putting the Balanced Scorecard to Work”, Harvard Business Review, vol. 71, no.
5, 1993, pp.134-145
59 Ahlmann H., “From traditional practice to the new understanding: the significance of life cycle profit concept in
Measuring the performance of a preventive maintenance programme for heavy trucks
24
Improvements which affect internal efficiency and external effectiveness at the same time results in a multiplicative effect on total effectiveness. By contrast, improvements affecting solely internal efficiency or external effectiveness result in a graduate effect on total effectiveness.
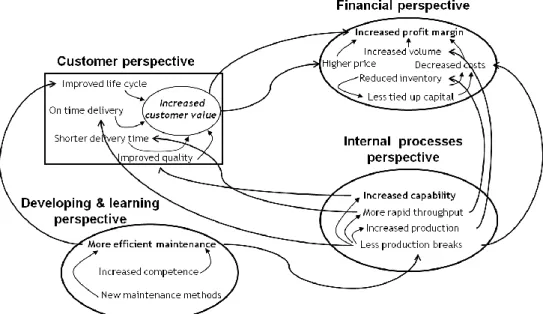
Figure 4.5 Maintenance Scorecard (Ahlmann 2002)
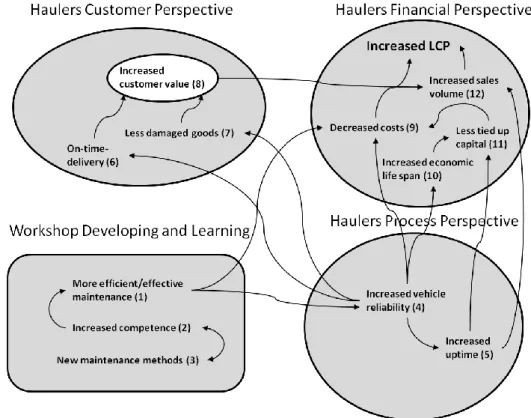
Figure 4.5 illustrates the four perspectives and the relationship between them in the MSC. These relationships are all possible to calculate or measure. These perspectives and relations affect the cost and income as well as the volume and price. Consequently the effect on the profit margin of the business is also possible to calculate. The four perspectives are essentially the same as for the BSC. The Developing & learning
perspective deals with the future of the maintenance organization and how it should evolve
to be able be competitive. The internal process perspective has the role of describing what is happening right now within the company. How efficiently resources are utilized and the quality of products are issues attended to in this perspective. The customer perspective also has the present in its focal point but focuses on external effectiveness. How the customer perceives the products offered is important in this perspective. The financial perspective is the rear view mirror and past performances are quantified here.60
Measuring the performance of a preventive maintenance programme for heavy trucks
25
4.7.4 Maintenance Performance Indicator
A measure that can generate a quantified value to indicate the level of performance, using single or multiple aspects, is called a performance indicator (PI). Consequently, the PI:s are the set of metrics used in a performance measurement system to quantify efficiency and effectiveness. 61
An organization can use PI:s as an aid to focus its efforts on supporting the course of the corporation.62
“All performance indicators must be tied to the long-range corporate
business objectives”.
Each element of a strategic plan needs relevant and defined key performance indicators. The strategic plan as a whole can then be broken down into PI:s at the basic shop floor.63 MPI:s are the tools for the organization to supervise the effectiveness of the maintenance carried out. 64
4.7.5 Multi-criteria Hierarchical Framework for MPM
An MPM system incorporates a number of criteria or goal functions, which needs to be regarded from the different views of the stakeholders. These criteria can be broken down to several maintenance indicators, e.g. MTTF, downtime, maintenance cost etc. It is important that these indicators can be structured from the operational level to the strategic level.65 For an organization the foundation for developing and identifying MPI:s lies in the organizations vision, objectives and strategy as well as the requirements of external and internal stakeholders.
The perspective of the organizations multi-hierarchical levels has to be considered when contextualizing the MPI:s. Depending on the structure of the organization, the number of hierarchical levels can differ. With a three level structure, as illustrated in Figure 4.6, the first hierarchical level could correspond to the organizations corporate or strategic level. The second hierarchical level could correspond to the tactical level of the organization and the third level would then correspond to the operational/functional level. The MPI:s at the functional level, i.e. the level where the actual maintenance is performed, are integrated or linked to the tactical level in order to provide management with a base for analysis and decision making at the strategic or tactical level. It is beneficiary to break down the strategic goals into objective targets for operating maintenance managers, as these may act as performance driver for the maintenance group. If the objective outcome from the
61 Wireman T., Developing performance indicators for managing maintenance, Industrial Press, New York NY,
1998
62 Ibid. 63
Parida (2006)
64 Wireman (1998)
65 Parida A. & G. Chattopadhyay, “Development of a multi-criteria hierarchical framework for maintenance
performance measurement (MPM)”, Journal of Quality in Maintenance Engineering, vol. 13, no. 3, 2007, pp.241-259
Measuring the performance of a preventive maintenance programme for heavy trucks
26
operating level is linked back to the strategic goals, in the form of MPI:s, the subjectivity increases as the objective outcomes are integrated to prevail MPI:s at higher level.66
Figure 4.6 Hierarchical levels of MPM model (Altered from Parida and Chattopadhyay 2007)
4.8 Life Cycle Perspective
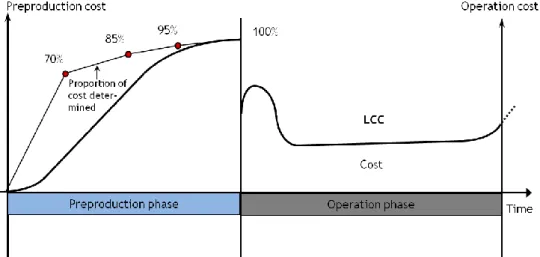
The life cycle perspective of owning and operating equipment entails looking at the entire life cycle when making investment decisions. The definition of maintenance from Section 4.1 clearly states that maintenance should be viewed upon from a life cycle perspective. As illustrated in Figure 4.7 the life cycle starts with the Preproduction phase, continues with the Production phase to finally end with the disposal of the equipment. The ability for a piece of equipment to generate profit for its owner during its life cycle is almost entirely decided in the Preproduction stage. To fully embrace the life cycle perspective a company is inclined to look at high availability and low maintenance costs in the projecting stage.67
4.8.1 Life Cycle Cost
The life cycle cost (LCC) of a plant, machine or vehicle is the total cost associated with that unit. The LCC concept emphasizes that one should not only look at the initial investment cost but also at the cost of ownership. Costs associated with LCC are typically acquisition, operation, maintenance, conversion, and disposal.The cost of ownership is often several times greater than the initial investment. When performing LCC analysis the net present value of all future costs must be taken into account since value of money changes over time. As can be seen in Figure 4.7, a large portion of the LCC is decided in the
66 Parida et al. (2007) 67 Ahlmann (2002)
Measuring the performance of a preventive maintenance programme for heavy trucks
27
preproduction phase of the life cycle. In the early stages of the production phase, costs are usually higher due to running in costs.(68,69)
Figure 4.7 The LCC Concept (Adapted from Ahlman 2002)
4.8.2 Life Cycle Profit
Maintenance has traditionally been viewed upon with economic measures and managers have aimed at reducing cost. With the LCP concept this changes. The equipment is utilized with the objective of making money. In order to be successful in a competitive market one needs to focus on both revenue and cost. 70
The formula for calculating LCP is merely the difference between the life cycle revenue (LCR) and the LCC for a piece of equipment according to Equation 4.6.
Equation 4.6
Both the revenue and cost elements needs to be discounted and LCP is thus the net present value of future profits/losses. The revenue side of LCP is very sensitive to disturbances in quality, on time delivery and production capacity. Figure 4.8 shows how the LCP for a piece of equipment typically varies with the aging of the equipment. 71
68 Barringer H.P., “A life cycle cost summary”, paper presented at the International Conference of Maintenance
Societies (ICOMS® -2003), Perth, May 20-23, 2003
69 Kawauchi Y. & M. Rausand, ”A new approach to production regularity assessment in oil and chemical
industries”, Reliability Engineering & System Saftey, vol. 75, no. 3, 2002, pp. 379-388
70
Ahlmann H., “Maintenance effectiveness and economic models in therotechnology concept”, Maintenance Management International, vol. 4, 1984, pp. 131-139