GERMANY, SPAIN AND SWEDEN.
A Thesis by
ANDREW BARNEY
Submitted to the Office of Graduate Studies of Gotland University
in partial fulfillment of the requirements for the degree of WIND POWER PROJECT MANAGEMENT
June 2012
Major Subject: "Energy Technology"
Master of Science in Wind Power Project Management 2012 Andrew Barney
MAKING THE MOST OF WIND: A BUSINESS PERSPECTIVE ON SUBSIDY SYSTEMS IN FRANCE, GERMANY, SPAIN AND SWEDEN.
A Thesis by
ANDREW BARNEY
Submitted to the Office of Graduate Studies of Gotland University
in partial fulfillment of the requirements for the degree of WIND POWER PROJECT MANAGEMENT
Approved by:
Supervisor, Liselotte Aldén
Examiner, Bahri Uzunoglu
June 2012
ABSTRACT
Making the Most of Wind: A Business Perspective on the Subsidy Systems in France, Germany, Spain and Sweden. (June 2012)
Andrew Barney, BSA; BA, University of Idaho Supervisor: Prof. Liselotte Aldén
Determining which countries are the most financially attractive for businesses to build wind projects is a matter of serious discussion that lacks succinct commentary. To fill this void this paper employs an empirical study of the wind subsidy support systems used by Germany, France, Spain and Sweden. This paper is based on the premise that businesses prefer to build where they can find the highest overall remuneration for their production; recognizing also the need for stability in those payments and businesses’ strong preference for larger early returns on their investments. The paper also analyzes the results and gives recommendations on possible improvements to each country’s system and where businesses should invest.
In order to reach their 20-20-20 E.U. goals (European Commission, 2010), countries are encouraging the creation of new green energy projects, and this encouragement is frequently in the form of subsidies. The subsidy types used by the countries reviewed are feed-in tariffs, premiums and a certificate quota system. Each country’s support history is detailed along with the criteria of their respective systems.
The countries systems are then compared using actual income and production data for four criteria at three different production levels – 100 percent, 75 percent and 150 percent of actual – and at two different lengths of time, 7 and 20 years. The first criteria of the comparison is total income, the second for variability of payments, the third for timing of payments and the final is the stability of the system itself.
The results of this research show that the German and French systems are superior at all levels for their low variability in payment prices and in making larger payments to businesses earlier. They are also generally superior at lower and actual production levels for total income amounts. However, the Spanish options are superior at high levels of production for income and have middling variability levels. The Swedish system generally has the highest levels of variability for the lowest levels of income. Only the Spanish system is considered to be unstable in its political support of subsidies. Based upon the preceding findings are given to each country to improve their relative weaknesses. Also recommendations are given to businesses based upon the quality of the locations wind resources.
ACKNOWLEDGEMENTS
I would like to acknowledge my family for their overall support and their review of my paper, especially Rhett Barney Esq. and my wife Maria Nitz. I would also like to acknowledge my classmates and teachers in the program for their assistance and perspectives. With special thanks to Liselotte for her feedback and suggestions on additional facets the paper could cover. I would also like to thank Siral AB, especially Nina Gynning, for generously providing the actual information I used as the basis for this paper. Göte Niklasson also needs a big thank you for his efforts in connecting me with Siral AB.
A special thank you must also be extended to my daughter Inara for her unerring and tireless efforts to distract me from writing this paper.
TABLE OF CONTENTS
ABSTRACT ... iii
ACKNOWLEDGEMENTS... iv
TABLE OF CONTENTS ... v
LIST OF FIGURES ...viii
LIST OF TABLES ... ix
CHAPTER I ... 1
INTRODUCTION ... 1
CHAPTER II STUDY OBJECTIVES AND RATIONALE ... 1
Study Objectives ... 1
Rationale ... 2
CHAPTER III SCOPE AND LIMITATIONS ... 2
Scope ... 2
Limitations ... 2
CHAPTER IV LITERATURE REVIEW ... 3
Existing Reports and Studies ... 3
CHAPTER V METHODOLOGY ... 4
Primary Information and Data... 4
CHAPTER VI THEORETICAL FRAMEWORK ... 5
Why Do Countries Use Support Policies ... 5
Why Use Those Policies for Renewable Energy Production ... 5
The Different Types of Subsidies and Methods... 6
Unanalyzed Support Systems... 7
Feed-in Tariffs ... 7
Premium ... 7
Green Certificates ... 8
Methods for Determining Remuneration Amounts ... 8
Electricity Markets ... 9 Countries Reviewed ... 9 France... 9 Germany ... 10 Spain ... 11 Sweden ... 12
CHAPTER VII SUBSIDY COMPARISON ... 13
Methodology ... 13
German Reference Turbine ... 14
French Load Hours ... 15
Spanish System ... 15
Swedish Green Certificate Market ... 15
Results of Actual Production ... 16
Total Income ... 17
Price per kWh ... 17
Price Variability ... 18
Results of Actual Production Decreased 25 Percent ... 19
Total Income ... 19
Price per kWh ... 20
Price Variability ... 21
Results of Actual Production Increased 50 Percent ... 22
Total Income ... 22
Price per kWh ... 23
Price Variability ... 24
German and French Payment Changes ... 25
Payment Differences between Production Levels ... 25
German Extend Introductory Tariff Periods Comparison ... 26
Rates of Return and Net Present Values ... 27
Estimated Future Returns for 20 Year Period ... 28
Total Income for Project Life of 20 Years Using both Estimated and Actual Data.... 28
Rates of Return and Net Present Values for Project Life of 20 Years Using both Estimated and Actual Data... 29
CHAPTER VIII ANALYSIS AND DISCUSSION OF RESULTS ... 30
Total Income ... 30
Price per kWh ... 31
Price Variability ... 32
Payment Timing ... 33
Other Items ... 34
CHAPTER X ADDITIONAL RESEARCH ... 37 BIBLIOGRAPHY ... 38 APPENDICES ... 40
LIST OF FIGURES
Figure 1 Site Production January 2005 – December 2011 ... 5
Figure 2 Spanish Premium Remuneration Graph ... 12
Figure 3 European Spot Markets Graph ... 14
Figure 4 Swedish Green Certificate Surplus ... 16
Figure 5 Swedish Green Certificate Prices ... 16
Figure 6 Total Income at Actual Production ... 17
Figure 7 Price per kWh at Actual Production ... 18
Figure 8 Price per kWh Variability at Actual Production ... 19
Figure 9 Total Income at 75 Percent Production ... 20
Figure 10 Price per kWh at 75 Percent Production ... 21
Figure 11 Price per kWh Variability at 75 Percent Production ... 22
Figure 12 Total Income at 150 Percent Production ... 23
Figure 13 Price per kWh at 150 Percent Production ... 24
Figure 14 Prices per kWh Variability at 150 Percent Production ... 25
Figure 15 German and French Tariff Drop at Actual to 150 Percent Production ... 26
Figure 16 German Additional Introductory Tariff Months at Different Production Levels ... 27
Figure 17 Nord Pool Spot Rates 2004-2011 (Sweden) ... 31
Figure 18 French 2001 Subsidy Payment Rate Scale for Last 10 Years of Production ... 32
LIST OF TABLES
Table 1 Reviewed Countries RES Goals ... 6
Table 2 Reviewed Countries Projected Wind Capacity Increases ... 6
Table 3 Swedish Green Certificate Purchase Quotas ... 13
Table 4 Total Annual Incomes at Actual Production ... 17
Table 5 Prices per kWh at Actual Production ... 18
Table 6 Prices per kWh Variability at Actual Production ... 19
Table 7 Total Annual Incomes at 75 Percent Production ... 20
Table 8 Prices per kWh at 75 Percent Production ... 21
Table 9 Prices per kWh Variability at 75 Percent Production ... 22
Table 10 Total Annual Incomes at 150 Percent Production ... 23
Table 11 Prices per kWh at 150 Percent Production ... 24
Table 12 Prices per kWh Variability at 150 Percent Production ... 25
Table 13 German and French Tariff Drop at Actual to 150 Percent Production ... 26
Table 14 NPV and IRR at Actual Production ... 27
Table 15 NPV and IRR at 75 percent Production ... 28
Table 16 NPV and IRR at 150 Percent Production ... 28
Table 17 20 Year Annual Income at Actual Production Level ... 29
Table 18 20 Year Annual Income at 75 percent Production Level ... 29
Table 19 20 Year Annual Income at 150 Percent Production Level ... 29
Table 20 20 Year NPV and IRR Actual Production ... 30
Table 21 20 Year NPV and IRR 75 percent Production Level ... 30
CHAPTER I INTRODUCTION
Where are businesses going to invest in green energy projects? With some exceptions, they will build where they are most likely to maximize profits. Presumably, this desire also accounts for the variability of earnings, with time value of money preference to receive the largest payments early in the project. However, in order for wind energy projects to effectively compete with both green and standard projects, with less variability and higher overall income prospects, wind projects must receive incentives beyond those currently offered by the market. As a result, several governments hoping to encourage wind and other green projects have taken numerous steps to provide such incentives.
Arguably, the most successful attempts to support green industry are the feed-in tariffs and premiums. Depending on the objectives of the government, there are a range of ways that these tariffs and premiums can be setup, but ultimately they are all based on the concept of providing assistance to businesses choosing to pursue green alternatives. In turn these businesses will prefer the countries and systems that best help them reach their objectives. This paper will compare the subsidy systems of four countries as applied to a specific wind park in Sweden. This comparison will focus on all of the following presumed business preferences: Amount, timing and variability of earnings. Because businesses are faced with substantially more complexity than just the financial payment support system when picking where to build, some additional analysis will be done to determine the historical and future appeal of the subsidy systems reviewed. The other important items businesses should consider, such as the local acceptance levels, wind assessment accuracy, supporting infrastructure, labor costs, administrative complexities, the other economic and non-economic supports offered by the government, among many others, will not be reviewed in this paper. The paper will conclude by recommending those features that attract the most wind power investment.
CHAPTER II
STUDY OBJECTIVES AND RATIONALE
Study Objectives
The primary objective of this study is to determine which of the selected countries’ financial support systems has the highest compensation and stability for wind project development. This compensation will be viewed through the lens of volatility and timing of payment.
The central points are as follows:
Which countries provide the highest absolute payments over the period with actual data?
Which countries have the lowest volatility in their payments?
What are the political risks of the systems reviewed in regards to their subsidy systems?
Are there any suggestions that can be given to businesses wishing to develop a wind project, in so far as maximizing their short and long term profits?
Rationale
While there is commentary and review in existing research discussing the differences between various countries’ subsidy systems (Bökenkamp, et al., 2008) and political risks (Steinhilber, et al., 2011) it generally does not include analysis of specific business conditions. The existing commentary also gives suggestions of preference for wind power developers (Klein, et al., 2008), but again there is little direct comparison of the bottom line financial benefits or shortcomings a individual project would have under a selected system.
CHAPTER III
SCOPE AND LIMITATIONS
Scope
This paper compares the income generated from an actual Swedish wind park under the Green Certificate subsidy system to the systems of three other European countries. Changes in the compared subsidy systems during the review period are reflected in the comparisons. The Swedish electricity spot market rates are used so that final income amounts will be comparable. Additional discussion of the market rates is found in the case study section below. Limitations
The following limitations are found in this review:
Scope of Review: Only four European countries’ subsidy systems have been selected for comparison. A more comprehensive study would include a representative group of countries from around the world, or at least Europe, with a subsidy system in place for wind power development.
Size of Review: Only a single Swedish wind park is being used for comparison in this study. A more comprehensive study would include additional parks from throughout the country and in other countries.
Spot Rates: Monthly average spot rates were used. A more comprehensive study would include daily or hourly rates.
Cost Items: Countries may appear more attractive due to higher payments but may have added costs not addressed in this assessment. A complete review would also include costs incurred relative to the country being assessed.
Wind Assessment: Having an accurate wind assessment for a location can be the basis for determining which subsidy system is most beneficial, and it frequently underlies approval of project financing. This study uses historical production data from an established park making additional commentary as to the importance of the wind assessments beyond the scope of this review. A more complete review of wind assessment may be beneficial in a wider review.
CHAPTER IV LITERATURE REVIEW
Existing Reports and Studies
a. RE-Shaping (Steinhilber, et al., 2011):
This publication reviews the results of a study launched to evaluate the performance of the European Union member states’ renewable energy support policies. The multinational study attempts to quantitatively rate the successes of the support policies based on their effectiveness in increasing renewable developments, as well as how these increases affected costs to society. The report covers support for all types of renewables, not just wind.
As the scope of this paper is limited to wind power subsidy supports in four of E.U. countries, only data related to these countries was reviewed and analyzed in the comparison of subsidies.
b. Evaluation of Different Feed-In Tariff Design Options (Klein, et al., 2008):
This study broadly describes the feed-in systems in use across the E.U. and does not give any rating of the success of the different policies. However, it does give final general recommendations on how a system should be setup to be effective in encouraging renewable energy development and generation. This report covers all types of renewables and not just wind power, and only very briefly describes the Swedish quota support systems.
As the scope of this paper is limited to wind power subsidy supports in four of E.U. countries only data related to these countries was reviewed and used to analyze in the results of the comparison of subsidies.
c. Cost Assessment of Sustainable Energy Systems (Bökenkamp, et al., 2008):
This report identifies and then reviews and ranks the effectiveness of the green policy support systems under a number of different criteria. These criteria include effectiveness, cost-efficiency, predictability, etc. which were given a relative weight by a group of stakeholders. The individual policies are further separated into variations within the policy to determine which variation is the most effective. All variations of all support systems are then ranked based on the weights given by stakeholders to determine which is the most effective. The report
concludes with two case studies, the first on German passive house support and the second on Danish onshore wind support.
The scope of the review is limited to the feed-in, premium and quota policy systems. The information from this report was used to analyze results of the comparison of subsidies.
CHAPTER V METHODOLOGY
This paper is primarily an empirical quantitative study of production and income data provided for a specific wind park in Sweden. The subsidy systems are principally compared based on their absolute numerical financial performances at set production levels. Additional qualitative study is done on each country’s political stability insofar as it relates to continued subsidy payments.
Primary Information and Data
Production and income data was obtained from Siral AB, a Swedish wind power developer and wind park owner, for one of its wind parks in Sweden. The data from Siral refers to a site that has been in operation since before the Swedish green certificate program began. The records provided separate the business’s income into amounts paid by the market and amounts received from sales of green certificates. Additional payments for benefits to the grid were also provided, but have been excluded from this evaluation. Along with the production data, the technical specifications of the turbines were included. All turbines within the data provided had the same make, model and installation period.
When possible the effective payment rates for the German, French and Spanish systems were obtained from each countries’ applicable law. If not possible due to rate adjustments, official documents were sought showing the rate for each year reviewed. When no official documents were found for the Spanish system showing the rate adjustments each year the rates were instead obtained from the Spanish wind energy association, Asociación Empresarial Eólica. In addition the monthly spot electricity market rates were obtained from Nord Pool’s website, nordpoolspot.com.
The remaining periods of the lifetime of the park are estimates based on an average production year, average spot market price and average green certificate price.
Figure 1 Site Production January 2005 – December 2011
CHAPTER VI
THEORETICAL FRAMEWORK
Why Do Countries Use Support Policies
In general, a subsidy can be any form of economic support to a single business or group of businesses, but it can also include an entire type of activities. These supports are almost exclusively provided by a government to support a specific type of unprofitable or relatively uncompetitive activity or activities. Governmental reasons for doing this vary, but may include a desire to support a historic industry, safeguarding a country’s sovereignty, or providing an initial startup incentive for preferred technologies and industries. Ultimately, no matter the reason for the subsidy, the result is same: A change in either the supply or demand curves of the subsidized goods or services.
Why Use Those Policies for Renewable Energy Production
The European Union has attempted to increase its share of renewable energy production and reduce its environmental impact since the end of the last century with actions like approving the Kyoto Protocol. In furthering this objective, it established a number of goals for its member states to increase renewable energy and decrease emissions. The most recent of these actions is the so called 20-20-20 legislative package. The 20’s mean that the E.U. will increase renewable energy’s share of production to 20 percent of the market, and there will be a 20 percent reduction in energy consumption in the E.U. by 2020 (European Commission, 2010).
250000 750000 1250000 1750000 2250000 2750000 Jan -05 May -05 Se p -05 Jan -06 May -06 Se p -06 Jan -07 May -07 Se p -07 Jan -08 May -08 Se p -08 Jan -09 Ma y-09 Se p -09 Jan -10 Ma y-10 Se p -10 Jan -11 Ma y-11 Se p -11 kWh p e r M o n th Months
The following are considered renewable energy sources by EU Directive 2001/77/EC (Klein, et al., 2008):
• Wind power (onshore and offshore)
• Solar power (photovoltaics and solar thermal electricity) • Geothermal power
• Hydro power (small scale and large scale) • Wave power
• Tidal power • Biomass
• Biogas (including landfill and sewage gas).
E.U. member states have each set their own goals for renewable energy sources. Below are the goals of the four countries reviewed in this paper (Teckenburg, et al., 2011) including Sweden’s voluntary increase from 49 to 50 percent (Bertilsson, 2011):
EU Member State RES in 2005 2020 RES Target
% increase required France 10.3% 23% 12.7% Germany 5.8% 18% 12.2% Spain 8.7% 20% 11.3% Sweden 39.8% 50% 9.2%
Table 1 Reviewed Countries RES Goals
Below is the projected wind capacity increases from each reviewed country (including both onshore and offshore projects) (Beurskens & Hekkenberg, 2011):
EU Member State Actual 2005 (MW) Actual 2010 (MW) Projected 2015 (MW) Projected 2020 (MW) Increase from 2010 (%) France 752 5,542 13,445 25,000 451 Germany 18,415 27,676 36,647 45,750 248 Spain 9,918 20,155 27,997 38,000 189 Sweden 536 1,873 3,210 4,547 243
Table 2 Reviewed Countries Projected Wind Capacity Increases
For many E.U. members, achieving these goals will mean significant investment in onshore and offshore wind power (Moccia, et al., 2011). Therefore, many governments have instituted different economic support methods to encourage the growth of wind power in their country. The Different Types of Subsidies and Methods
Many types of economic supports have been implemented to promote wind and other renewables. The most popular of these are:
Feed-In tariffs Fixed premiums Tendering systems
Tradable green certificates/Quotas Investment incentives
Tax laws
Unanalyzed Support Systems
A tendering support system is a simple option where an auction is held for the installation of wind projects. Bidders can purchase capacity based on set remuneration amounts per the power generated. Many E.U. countries have used this method in the past to support their wind projects and the U.K. is currently using it in conjunction with a certificate system for its offshore wind projects (Steinhilber, et al., 2011).
Investment incentives are another support and are simply a payment from the government to cover a business’s cost. The most basic investment incentive would be a set payment by the government to cover project installation costs. More advanced methods can take into account the production of the project to determine the amount of payment. For example the United States offered a thirty percent payment to cover wind project installation costs for projects started by 2011 (U.S. Department of Treasury, 2011).
Changes in tax laws are another economic support mechanism that can be used to favor renewables. These changes can be as simple as a lower tax rate on income from wind power projects, or an exemption from environmental surcharges. Others include allowing increased depreciation rates on equipment used in wind power. Both investment incentives and favorable tax laws can easily be used in conjunction with other supports.
Feed-in Tariffs
Feed-in tariffs can be broadly defined as regulations which obligate an electricity distribution utility to purchase electricity from an eligible renewable energy seller at specified prices. These tariff rates are normally set in a long term contract with guarantees and with predetermined rate changes. This in turn creates stability that allows the renewable energy producer to sell to the utility or receive amounts directly from the government at those set prices for that duration. However, tariffs are generally paid by grid operators who offset the tariff payments through increased billings to their customers. Currently, the feed-in tariff is the most popular support system in the world and in the E.U. (Hempling, et al., 2010).
A reason for its popularity is because a feed-in tariff is versatile with respect to its adjustability. A country can encourage any range of activities and technologies by adjusting the payment levels. Germany has several examples of this in its system, such as where it pays additional amounts for projects at different wind levels, and incentives are offered for projects to be constructed sooner (Bundestag, 2010).
Premium
Under the fixed premium method, the electricity fed into the grid is paid a premium in addition to the price paid by the electricity market. Generally, fixed premium subsidies also have
guaranteed contract periods in which a project can receive the premium payments and ensure grid access. The premiums, like the feed in tariffs, are frequently paid by grid operators who in turn collect the amount paid from their customers, but can also be paid directly by the government to the producer (Bökenkamp, et al., 2008). Like feed-in tariffs, the fixed premiums can be adjusted to encourage certain types of activities and technologies. For example, the Spanish premium pays a bonus for repowering and different rates for different types of renewables. Additionally, premium price floors and caps can be used to ensure the range of payments is neither too low to adequately subsidize the park for its costs, nor too high so that it results in excessive profits (Real Decreto 661/2007, 2007).
Green Certificates
The certificate system requires that a group in the energy supply chain have a certain quota of renewable electricity in the amounts they sell or buy. In the case of Sweden, the utilities are required to have a certain percentage of renewable energy in the amounts they sell to consumers. Every year the group must show it reached its quota by presenting the certificates it has purchased or traded. A certificate system can either cancel all the certificates produced in a year, or allow certificates to accumulate and be saved. The government can also provide technology banding by offering different payment levels for different technologies types and can provide waivers from the program for energy intensive industries. Like the feed-in tariff or the premium methods the costs of the quotas are generally being paid for by the end consumer. These systems must also have a penalty for failure to meet quota levels that is sufficiently high to encourage the purchase of the certificates (Bökenkamp, et al., 2008). Methods for Determining Remuneration Amounts
The payment amounts for feed-in tariffs and fixed premiums are calculated a number of different ways. They can be based on the calculated adjusted cost of renewable energy generation as is done in Germany. They can also be calculated using the avoided cost of renewable energy generation. Alternatively, they can be based on a fixed price without relation to either the avoided cost or the adjusted cost. The last option would be to use a cost based on an auction or bidding process. The most common of these methods is to calculate the adjusted cost of wind power, which is used extensively throughout the member states of the European Union (Couture, et al., 2010).
The way the adjusted cost is determined varies from country to country, but it is normally based on a market study and analysis, an auction or an indexed profitability measure. With the market study method, the government generally reviews the costs of wind power projects and determines the amount of feed-in tariff or premium needed to make a profit for a standard, well run project. The auction method uses the free market, rather than analysis, to determine how much the tariff should be. The profitability measure simply establishes an expected profitability for a specific project and bases the tariff or premium on that amount. The market study method is the most widely used of the cost methods (Couture, et al., 2010).
Electricity Markets
The electricity markets are important for most subsidy systems, but are especially important for the fixed premium and green certificate policies which rely on market prices for a portion of their payments. The electricity market allows for the buying, selling and trading of electricity to cover shortages or to sell surpluses. The market also allows businesses to counteract some of the natural risks of purchasing a product with an inherently volatile price through hedging, which is an investment used to offset the risk of another investment. The prices for electricity on these markets normally operate on the principle of supply and demand unless there is government regulation or congestion in the system preventing it.
Within this market exists the spot market. The spot energy market allows producers of surplus energy to quickly find buyers and to negotiate prices while also delivering the actual energy a few minutes later. Depending on its setup the spot markets can allow for buying and selling an hour, half an hour or fifteen minutes before the delivery of electricity.
Countries Reviewed France
France began using feed-in tariffs for wind in 2001 when their policy paid a set amount for onshore and offshore projects. This set amount, however, only lasted for the first five years of the project. After the first five years, the payment for the remaining ten years was adjusted to the wind resources at the site. This method uses the average full load hours of turbines at the project to determine the tariff amount. If a project has more than 3,600 average full load hours it will receive a minimum tariff amount and if it has 2,000 or less it will continue receiving the full tariff amount. Any load amount between the given payment points uses a linear interpolation to determine the tariff level. The program also has no caps on either capacity or total payments, but does require the project to be in a designated wind development area (Ministère de L’économie, des Finances et de L’industrie, 2001).
France reviewed their tariff law in 2006 and changed the period of set payments to the first 10 years of a projects life. The revised law continued the 3,600 average full load hour minimum payment boundary, but increased the range for the highest tariff rate to 2,400 full load hours for the remaining five years of the lease. The new law also added a separate tariff range for offshore wind projects that both gives higher tariff rates, a longer payment period and a new range with 3,900 full load hours for the minimum payment and 2,800 hours for the maximum payment. Both the on and offshore systems continue to use the linear interpolation between the given tariff levels to determine payments between the max, middle and minimum full load hours. The tariff rates are indexed to inflation for existing projects and the tariff amount is potentially subject to a 60% adjustment for changes in the labor and manufacturing costs of the project (Ministère de L’économie, des Finances et de L’industrie, 2006). The 2006 law was annulled due to a technicality in 2008 because of the legal opposition of a local group. The law was subsequently reinstated by the government, but the same opposition group has recently attempted to again stymie wind power investment based on another technical error that could
potentially temporarily halt the ability of the government to issue new power purchase contracts (Quilter, 2012).
The method used for determining the full load hours of a park will be further explained in the case study below.
Germany
Germany began its support of renewables in the early 1980’s by providing funding for research and development projects. In 1990 and 1991 Germany passed acts first calling for 250 MW of wind power development and then creating a national feed-in tariff. The feed-in tariff law required utilities to buy renewably generated electricity from other non-utility generators. The law set payments to a fixed 90 percent of the retail electricity price for wind power production. The utilities were also required to purchase a fixed percentage of their electricity from renewable sources and were also required to provide renewable generators access to the grid (Couture, et al., 2010). The act later capped the utilities requirement to pay the fixed prices when their renewables share reached five percent (Held, et al., 2007).
In 2000, in part due to a number of pressures on renewables from falling retail prices, Germany passed the Renewable Energy Sources Act (EEG) which unlinked the feed-in subsidy amounts from the retail prices and instead set a fixed price for a fixed period. The act also permitted utilities to participate and removed the caps on the share of renewables for payments by spreading costs to all grid operators. The Act also added requirements that the payments for wind energy be differentiated based on wind resource quality after five years for the remaining lease period and added a payment degression for wind installed after 2001 (Bundestag, 2000). The resource quality differentiation was created to encourage a wider area of development in the country without giving larger payments to projects in high wind areas. The degression created was to encourage the use of state of the art technology in both manufacturing and energy production by adjusting the relative tariff amounts over time. The tariff rates were also set to be reviewed on a regular basis. Additionally, German transmission service providers were required to build grid connections to new wind parks (Held, et al., 2007).
In 2004, Germany reviewed its prior law and gave further incentives for increased power management at wind parks and adjusted the tariff rates for high wind and moderate wind areas. The 2004 Act also created high tariffs for offshore wind parks for the first 12 years of production. The annual degression for wind was also increased to two percent and incentives were given for the repowering of old wind parks (Bundestag, 2004). In 2009 and then in 2011 the law was again reviewed and revised to adjust the tariff rates for both on and offshore wind projects and slightly changed the repowering incentive calculations. The 2009 law also reduced the degression for onshore parks to one percent and increased the offshore degression to five percent after 2015. Unlike the prior laws the latest version of the EEG also gave incentives for both on and offshore parks to come into production by set dates. The program continues to have no caps on payments or capacity and maintains its 20 year maximum on receiving the tariff at any rate (Bundestag, 2010).
The method used for determining the resource quality in different locations will be further explained below in the case study.
Spain
The Spanish feed-in tariff policy began in 1997 with a law that created the Special Scheme rates for production facilities that used renewable energy sources and were less than 50 MW in size. The law also provided for grid access and a premium on payments for the renewable energy. The wind developer was still responsible for their physical connection to the grid. The law also set in place a plan to have 12 percent of Spain’s energy derived from renewable sources by 2010. In 1998 the first law was amended to further identify the renewable producer’s rights and to explain that the payments to the producers were the wholesale price plus a premium determined by the technology type. The first rates for the premiums under the Special Scheme were set in 1998 (Held, et al., 2007).
In 2004 the Spanish issued a new law modifying the Special Scheme again in an attempt to make it more stable. The law also created an option for the energy producer to choose between a fixed tariff rate (regulated tariff) or a premium and incentive amount on top of whatever the market paid. Producers were able to choose between the two methods for one year periods and either continue with that option or switch again. The law also introduced a forecasting penalty of 10 percent of the average tariff on the difference between the predicted and actual production, but only when the difference exceeded 20 percent for wind. The forecasting penalty did not take effect until 2006 (Real Decreto 436/2004, 2004).
The Special Scheme was once again modified in 2007. This scheme still allows a wind project to select either of the two payment methods noted above but introduced a ceiling and floor to the premium option to limit amounts paid out during high electricity prices. The law also added a bonus for repowering and gave an option to those on the fixed tariff option to receive differentiated rates based on peak and off peak times (Real Decreto 661/2007, 2007). In 2010 the Scheme was again modified for the years of 2011-2012. The 2010 modifications reduced the premium amount under the premium option by 35 percent. The ceiling and floor amounts (as indexed to CPI) remain unchanged. The law also limited the payment of the premium to 2,589 full load hours. This load hour cap only goes into effect when the entirety of the Spanish wind sector passes 2,350 full load hours a year (Real Decreto 1614/2010, 2010).
A graph showing an example of the ceiling and floor setup of the premium option is pictured below (Klein, et al., 2008):
Figure 2 Spanish Premium Remuneration Graph Sweden
Sweden began a carbon dioxide tax in 1991 and has had both investment grants and environmental bonuses for renewable energy sources (Widegren, 2011). In 2003, Sweden created a green certificate program in which renewable energy producers receive certificates for each MWh of electricity they produce. These certificates are then sold to electricity providers to augment the amounts the producer receives from their sales of electricity on the market. These electricity providers are in turn required to have a certain quota of renewable energy evinced by the number of certificates they have purchased. These certificates have no set lower or upper price and their prices are directly related to the number required to be purchased and the number that have been produced. Electricity intensive businesses are exempted from the need to participate in the quota requirements. Each April certificates that were used in the prior year are cancelled and removed from system. Projects are allowed to receive the certificates for 15 years. Projects in Sweden are responsible for their own connections to the grid (Nilsson, et al., 2011).
The law originally was set to increase renewable generation by 17 TWh from 2002 to 2020. This increase was amended to 25 TWh. The law has also changed to extend the certificate system until 2030 to permit projects coming online in 2016 to receive certificates for the maximum 15 year period (Regeringskansliet, 2006). Additionally, in 2012 the certificate trading market was expanded so they could be bought and sold across a combined Swedish-Norwegian market. Both Sweden and Norway then agreed to jointly increase renewable production to 26.4 TWh (Senneroe & Fouche, 2010).
Sweden instituted the certificate system to create long term predictability for investors by moving the financing from the government to the market. This market financing was expected to help reduce costs of the program by only funding the most cost effective and productive
renewable energies (Widegren, 2011). Meaning the system does not include the technology banding option mentioned above.
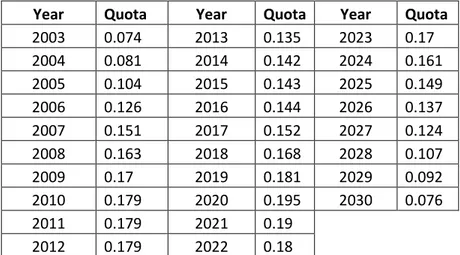
The quota percentages per year are pictured below (Nilsson, et al., 2011): Year Quota Year Quota Year Quota
2003 0.074 2013 0.135 2023 0.17 2004 0.081 2014 0.142 2024 0.161 2005 0.104 2015 0.143 2025 0.149 2006 0.126 2016 0.144 2026 0.137 2007 0.151 2017 0.152 2027 0.124 2008 0.163 2018 0.168 2028 0.107 2009 0.17 2019 0.181 2029 0.092 2010 0.179 2020 0.195 2030 0.076 2011 0.179 2021 0.19 2012 0.179 2022 0.18
Table 3 Swedish Green Certificate Purchase Quotas
CHAPTER VII SUBSIDY COMPARISON
The following section will be a comparison of the economic support systems of France, Germany, Spain and Sweden using production data from a Swedish wind park.
Methodology
The time period of the review will be from January 2005 through December 2011 and the park will have been assumed to have been installed in January 2005. An additional review of the project’s final 13 years’ estimated income will also be done. The information will be calculated using whatever system was in effect in all countries at that time. Changes in a country’s subsidy system will result in a change in the calculations only if those changes specify that they will apply to wind parks installed before the change came into effect. This primarily applies to the Spanish system changes.
The actual income information from the Swedish wind park includes income amounts taken from the market rates but also amounts from purchase agreements. From September 2008 through December 2010 an agreement was in place to purchase the power generated from the park at a set rate. As a result, two Swedish calculations will be done, one for the actual park’s income data referred to as “Swedish Actual” and one for income as it would have been if taken from the variable market prices and is referred to as “Swedish Variable.”
The subsidy systems will be evaluated on actual production rates from the Swedish site, which has moderate production, as well as at rates 50 percent above and 25 percent below actual. This will show the difference between the systems at a low, medium and high production site. Additionally, Swedish market rates will be used for the Spanish premium calculations so the
results are consistent and comparable. As shown in the graph below, the Swedish and Spanish market rates, dark blue and red respectively, during this period were not unreasonably different (Ceña, et al., 2011):
Figure 3 European Spot Markets Graph German Reference Turbine
As noted above the German system uses a reference turbine yield to determine the length of its introductory feed-in tariff rate. This reference turbine is of the same type as those installed in the project but its production is based on a set power-wind speed curve. The power yield from this reference turbine and reference site is then used to calculate a reference yield, which is the five year yield of the turbine if it were built on the reference site (Bundestag, 2004). The reference site is a site determined by means of a Rayleigh distribution with a mean annual wind speed of 5.5 meters per second at a height of 30 meters above ground level, a logarithmic wind shear profile and a roughness length of 0.1 meters (Bundestag, 2004).
A turbine of the type in the Swedish wind park was placed in WindPRO (EMD International A/S, 2012), a wind energy project design and planning software, along with the reference site wind parameters as specified in the law. WindPRO was then used to calculate the reference yield. This reference yield at 150 percent was then used to compare the actual yield of the site to determine the length of the initial tariff rate. The reference yield at 150 percent was also used
to compare the 150 percent and 75 percent production levels to determine the length of the initial tariff rate.
As a result of the project start date, the German system will have a two percent degression applied to its initial and standard tariff amounts.
French Load Hours
The French wind subsidy system uses a payment rate based on the full load hours of the site after the end of the introductory period. Full load hours are determined by dividing the annual production of a turbine by its name plate rated power. The average full load hours were determined for each turbine in the park for the first five years to find the effective payment rates for the turbines at actual production and at 150 percent and 75 percent production. The rates used for the French system will only be the initial rates in the law. No adjustments will be made to apply the inflation rate changes or for installation or operations and maintenance costs.
Spanish System
The Spanish system has been calculated on both the feed-in tariff and the fixed premium options as either may be chosen by a company from year to year. No forecasting errors will be assumed under any level of production.
Swedish Green Certificate Market
The Swedish system is subject to variations in two markets, the electricity market and the certificate market. As there is no ceiling or floor for the Swedish certificate market, the prices can, and have, varied widely over the review period. In 2010 there was a surplus of 5.5 million certificates which has caused a substantial drop in prices. Below is a graph showing the increasing certificate surplus (Nilsson, et al., 2011):
Figure 4 Swedish Green Certificate Surplus
And below is a graph showing the variability of prices in the system since its creation in 2003 (CESAR Elcertifikat, 2012):
Figure 5 Swedish Green Certificate Prices Results of Actual Production
The below results are based on the actual production amounts of the nine turbines in the Swedish wind park without adjustment. The graphs and figures used in the remainder of this chapter are based on data from Siral AB (Siral AB, 2011), Nord Pool Spot (Nord Pool Spot, 2012), the German 2004 renewable energy law (Bundestag, 2004), the French 2001 renewable
125 145 165 185 205 225 245 265 285 305 325 Ju n
Oct Feb nJu Oct Feb Jun Oct Feb Jun Oct Feb Jun Oct Feb Jun Oct Feb Jun Oct bFe Jun Oct Feb Jun Oct Feb
2003 2004 2005 2006 2007 2008 2009 2010 2011 2012 Pr ic e p e r Ce rtif ic ate (SE K ) Months
energy law (Ministère de L’économie, des Finances et de L’industrie, 2001), and the Spanish wind remuneration rates from 2005 through 2011 (Ceña, et al., 2011).
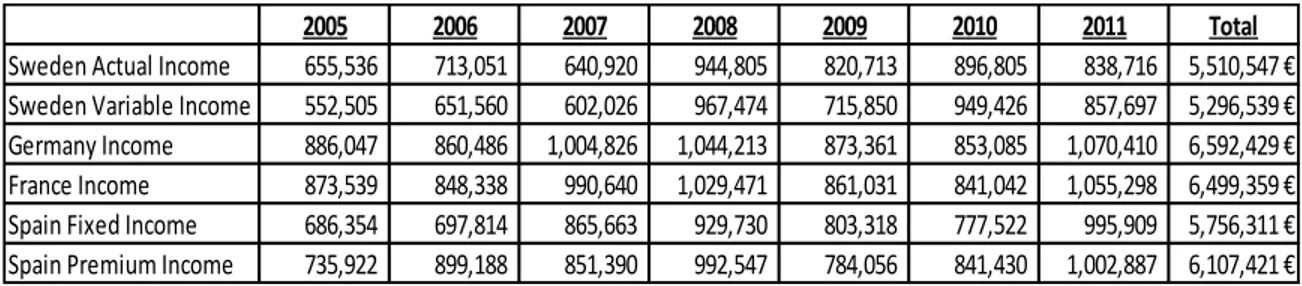
Total Income
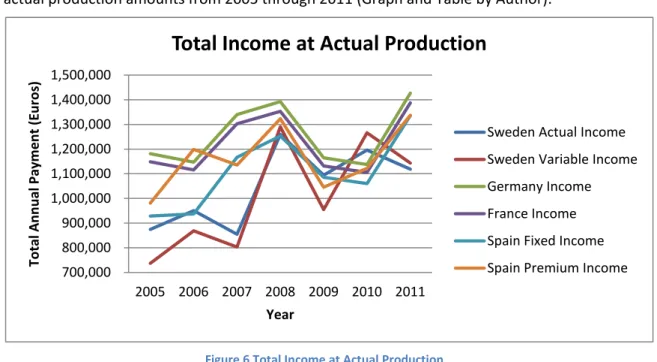
The below graph shows the comparative income from each of the subsidy methods using the actual production amounts from 2005 through 2011 (Graph and Table by Author):
Figure 6 Total Income at Actual Production
Table 4 Total Annual Incomes at Actual Production Price per kWh
The below graph shows the comparative price per kWh from each of the subsidy methods using the actual production amounts from 2005 through 2011 (Graph and Table by Author):
700,000 800,000 900,000 1,000,000 1,100,000 1,200,000 1,300,000 1,400,000 1,500,000 2005 2006 2007 2008 2009 2010 2011 To tal A n n u al Pay m e n t (E u ro s) Year
Total Income at Actual Production
Sweden Actual Income Sweden Variable Income Germany Income France Income Spain Fixed Income Spain Premium Income
2005 2006 2007 2008 2009 2010 2011 Total
Sweden Actual Income 874,049 950,735 854,561 1,259,740 1,094,283 1,195,740 1,118,288 7,347,395 €
Sweden Variable Income 736,674 868,747 802,702 1,289,966 954,466 1,265,901 1,143,597 7,062,052 €
Germany Income 1,181,397 1,147,315 1,339,768 1,392,284 1,164,482 1,137,447 1,427,213 8,789,905 €
France Income 1,148,412 1,115,282 1,302,361 1,353,411 1,131,969 1,105,690 1,387,365 8,544,491 €
Spain Fixed Income 928,210 937,474 1,167,057 1,252,826 1,085,837 1,060,188 1,335,530 7,767,121 €
Figure 7 Price per kWh at Actual Production
Table 5 Prices per kWh at Actual Production Price Variability
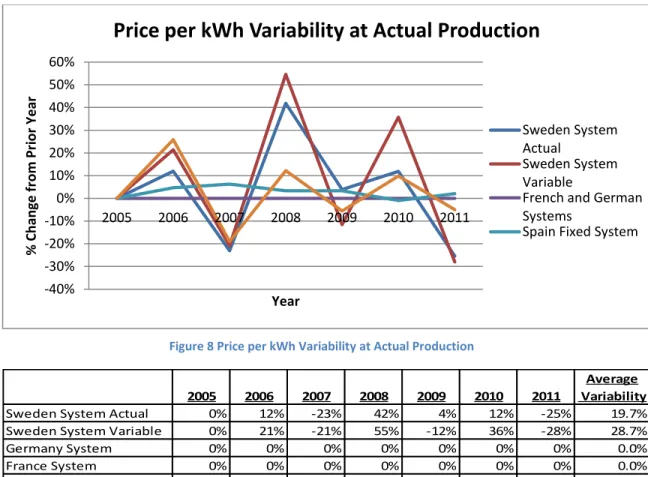
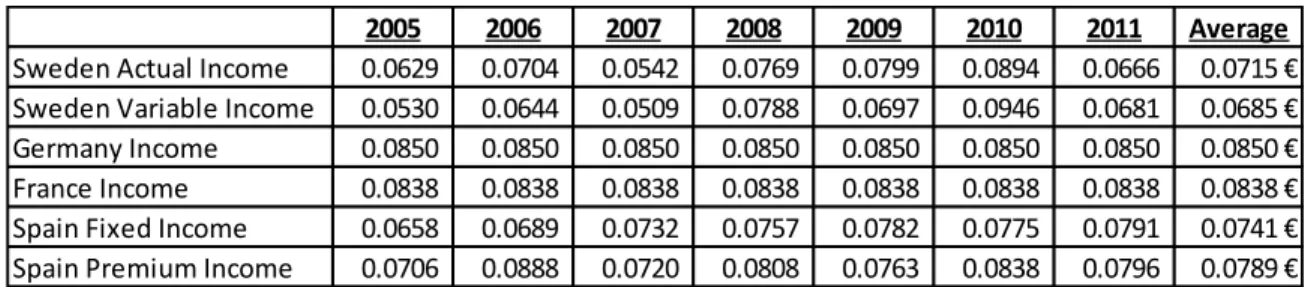
The below graph shows the comparative variability from each of the subsidy methods using the actual production amounts from 2005 through 2011 (Graph and Table by Author):
0.0500 0.0600 0.0700 0.0800 0.0900 0.1000 2005 2006 2007 2008 2009 2010 2011 Eu ro s p e r kWh Year
Price per kWh at Actual Production
Sweden Actual Income Sweden Variable Income Germany Income France Income Spain Fixed Income Spain Premium Income
2005 2006 2007 2008 2009 2010 2011 Average
Sweden Actual Income 0.0629 0.0704 0.0542 0.0769 0.0799 0.0894 0.0666 0.0715 €
Sweden Variable Income 0.0530 0.0644 0.0509 0.0788 0.0697 0.0946 0.0681 0.0685 €
Germany Income 0.0850 0.0850 0.0850 0.0850 0.0850 0.0850 0.0850 0.0850 €
France Income 0.0838 0.0838 0.0838 0.0838 0.0838 0.0838 0.0838 0.0838 €
Spain Fixed Income 0.0658 0.0689 0.0732 0.0757 0.0782 0.0775 0.0791 0.0741 €
Figure 8 Price per kWh Variability at Actual Production
Table 6 Prices per kWh Variability at Actual Production Results of Actual Production Decreased 25 Percent
The below results are based on the actual production of the Swedish wind park with a 25% reduction.
Total Income
The below graph shows the comparative income from each of the subsidy methods using the actual production amounts with a 25 percent reduction from 2005 through 2011 (Graph and Table by Author): -40% -30% -20% -10% 0% 10% 20% 30% 40% 50% 60% 2005 2006 2007 2008 2009 2010 2011 % Ch an ge fr o m Pr io r Ye ar Year
Price per kWh Variability at Actual Production
Sweden System Actual
Sweden System Variable
French and German Systems
Spain Fixed System
2005 2006 2007 2008 2009 2010 2011
Average Variability
Sweden System Actual 0% 12% -23% 42% 4% 12% -25% 19.7%
Sweden System Variable 0% 21% -21% 55% -12% 36% -28% 28.7%
Germany System 0% 0% 0% 0% 0% 0% 0% 0.0%
France System 0% 0% 0% 0% 0% 0% 0% 0.0%
Spain Fixed System 0% 5% 6% 3% 3% -1% 2% 3.4%
Figure 9 Total Income at 75 Percent Production
Table 7 Total Annual Incomes at 75 Percent Production Price per kWh
The below graph shows the comparative price per kWh from each of the subsidy methods using the actual production amounts with a 25% reduction from 2005 through 2011 (Graph and Table by Author): 500,000 600,000 700,000 800,000 900,000 1,000,000 1,100,000 2005 2006 2007 2008 2009 2010 2011 To tal A n n u al Pay m e n t (E u ro s) Year
Total Income at 75% Production
Sweden Actual Income Sweden Variable Income Germany Income France Income Spain Fixed Income Spain Premium Income
2005 2006 2007 2008 2009 2010 2011 Total
Sweden Actual Income 655,536 713,051 640,920 944,805 820,713 896,805 838,716 5,510,547 €
Sweden Variable Income 552,505 651,560 602,026 967,474 715,850 949,426 857,697 5,296,539 €
Germany Income 886,047 860,486 1,004,826 1,044,213 873,361 853,085 1,070,410 6,592,429 €
France Income 873,539 848,338 990,640 1,029,471 861,031 841,042 1,055,298 6,499,359 €
Spain Fixed Income 686,354 697,814 865,663 929,730 803,318 777,522 995,909 5,756,311 €
Figure 10 Price per kWh at 75 Percent Production
Table 8 Prices per kWh at 75 Percent Production Price Variability
The below graph shows the comparative variability from each of the subsidy methods using the actual production amounts with a 25 percent reduction from 2005 through 2011 (Graph and Table by Author): 0.0500 0.0550 0.0600 0.0650 0.0700 0.0750 0.0800 0.0850 0.0900 0.0950 0.1000 2005 2006 2007 2008 2009 2010 2011 Eu ro s p e r kWh Year
Price per kWh at 75% Production
Sweden Actual Income Sweden Variable Income Germany Income France Income Spain Fixed Income Spain Premium Income
2005 2006 2007 2008 2009 2010 2011 Average
Sweden Actual Income 0.0629 0.0704 0.0542 0.0769 0.0799 0.0894 0.0666 0.0715 €
Sweden Variable Income 0.0530 0.0644 0.0509 0.0788 0.0697 0.0946 0.0681 0.0685 €
Germany Income 0.0850 0.0850 0.0850 0.0850 0.0850 0.0850 0.0850 0.0850 €
France Income 0.0838 0.0838 0.0838 0.0838 0.0838 0.0838 0.0838 0.0838 €
Spain Fixed Income 0.0658 0.0689 0.0732 0.0757 0.0782 0.0775 0.0791 0.0741 €
Figure 11 Price per kWh Variability at 75 Percent Production
Table 9 Prices per kWh Variability at 75 Percent Production Results of Actual Production Increased 50 Percent
The below results are based on the actual production of the Swedish wind park with a 50 percent increase.
Total Income
The below graph shows the comparative income from each of the subsidy methods using the actual production amounts with a 50 percent increase from 2005 through 2011 (Graph and Table by Author): -40% -30% -20% -10% 0% 10% 20% 30% 40% 50% 60% 2005 2006 2007 2008 2009 2010 2011 % Ch an ge fr o m Pr io r Ye ar Year
Price per kWh Variability at 75% Production
Sweden System Actual Sweden System Variable French and German Systems Spain Fixed System
Spain Premium System
2005 2006 2007 2008 2009 2010 2011
Average Variability
Sweden System Actual 0% 12% -23% 42% 4% 12% -25% 19.7%
Sweden System Variable 0% 21% -21% 55% -12% 36% -28% 28.7%
Germany System 0% 0% 0% 0% 0% 0% 0% 0.0%
France System 0% 0% 0% 0% 0% 0% 0% 0.0%
Spain Fixed System 0% 5% 6% 3% 3% -1% 2% 3.4%
Figure 12 Total Income at 150 Percent Production
Table 10 Total Annual Incomes at 150 Percent Production Price per kWh
The below graph shows the comparative price per kWh from each of the subsidy methods using the actual production amounts with a 50 percent increase from 2005 through 2011 (Graph and Table by Author): 700,000 900,000 1,100,000 1,300,000 1,500,000 1,700,000 1,900,000 2,100,000 2,300,000 2005 2006 2007 2008 2009 2010 2011 To tal A n n u al Pay m e n t (E u ro s) Year
Total Income at 150% Production
Sweden Actual Income Sweden Variable Income Germany Income France Income Spain Fixed Income Spain Premium Income
2005 2006 2007 2008 2009 2010 2011 Total
Sweden Actual Income 1,311,073 1,426,103 1,281,841 1,889,610 1,641,425 1,793,610 1,677,432 11,021,093 €
Sweden Variable Income 1,105,011 1,303,120 1,204,052 1,934,948 1,431,699 1,898,852 1,715,395 10,593,077 €
Germany Income 1,772,095 1,720,972 2,009,652 2,088,426 1,746,722 1,411,378 1,376,141 12,125,385 €
France Income 1,747,077 1,696,676 1,981,280 2,058,942 1,722,063 1,035,151 1,298,371 11,539,560 €
Spain Fixed Income 1,372,709 1,395,627 1,731,327 1,859,460 1,606,635 1,555,044 1,991,819 11,512,621 €
Figure 13 Price per kWh at 150 Percent Production
Table 11 Prices per kWh at 150 Percent Production Price Variability
The below graph shows the comparative variability from each of the subsidy methods using the actual production amounts with a 50 percent increase from 2005 through 2011 (Graph and Table by Author): 0.0400 0.0500 0.0600 0.0700 0.0800 0.0900 0.1000 2005 2006 2007 2008 2009 2010 2011 Eu ro s p e r kWh Year
Price per kWh at 150% Production
Sweden Actual Income Sweden Variable Income Germany Income France Income Spain Fixed Income Spain Premium Income
2005 2006 2007 2008 2009 2010 2011 Average
Sweden Actual Income 0.0629 0.0704 0.0542 0.0769 0.0799 0.0894 0.0666 0.0715 €
Sweden Variable Income 0.0530 0.0644 0.0509 0.0788 0.0697 0.0946 0.0681 0.0685 €
Germany Income 0.0850 0.0850 0.0850 0.0850 0.0850 0.0703 0.0546 0.0786 €
France Income 0.0838 0.0838 0.0838 0.0838 0.0838 0.0516 0.0516 0.0746 €
Spain Fixed Income 0.0658 0.0689 0.0732 0.0757 0.0782 0.0775 0.0791 0.0741 €
Figure 14 Prices per kWh Variability at 150 Percent Production
Table 12 Prices per kWh Variability at 150 Percent Production German and French Payment Changes
This section examines the changes in payment rates related to the tariff declines in the German and French subsidy systems at the three different levels of production
Payment Differences between Production Levels
The below graph shows the comparative differences in the German and French subsidy methods for the prices per kWh using the actual production as well as the 150 percent production for 2005 through 2011 (Graph and Table by Author):
-60% -40% -20% 0% 20% 40% 60% 2005 2006 2007 2008 2009 2010 2011 % Ch an ge fr o m Pr io r Ye ar Year
Price per kWh Variability at 150% Production
Sweden System Actual Sweden System Variable Germany System France System Spain Fixed System Spain Premium System
2005 2006 2007 2008 2009 2010 2011
Average Variability
Sweden System Actual 0% 12% -23% 42% 4% 12% -25% 19.7%
Sweden System Variable 0% 21% -21% 55% -12% 36% -28% 28.7%
Germany System 0% 0% 0% 0% 0% -17% -22% 6.6%
France System 0% 0% 0% 0% 0% -38% 0% 6.4%
Spain Fixed System 0% 5% 6% 3% 3% -1% 2% 3.4%
Figure 15 German and French Tariff Drop at Actual to 150 Percent Production
Table 13 German and French Tariff Drop at Actual to 150 Percent Production German Extend Introductory Tariff Periods Comparison
The below graph shows the number of months the introductory tariff period was extended in the German system based on the three production levels (Graph by Author).
-50% -40% -30% -20% -10% 0% 10% 2005 2006 2007 2008 2009 2010 2011 Per ce n t Ch an ge in Pay m e n t p e r kWh Year
German and French Tariff Drop at Actual to 150%
Production
German Percent Difference French Percent Difference
2005 2006 2007 2008 2009 2010 2011
Germany Actual Production 0.0850 0.0850 0.0850 0.0850 0.0850 0.0850 0.0850 Germany 150% Production 0.0850 0.0850 0.0850 0.0850 0.0850 0.0703 0.0546
German Percent Difference 0% 0% 0% 0% 0% -17% -36%
French Actual Production 0.0838 0.0838 0.0838 0.0838 0.0838 0.0838 0.0838 French 150% Production 0.0838 0.0838 0.0838 0.0838 0.0838 0.0516 0.0516
Figure 16 German Additional Introductory Tariff Months at Different Production Levels Rates of Return and Net Present Values
The internal rate of return (IRR) formula is used by a business to determine the efficiency of a projects use of a business’s money. If the project returns an IRR greater than the company’s cost of capital it should be considered, if it does not it should be discarded. The net present value (NPV) on the other hand measures only the amount a project will return to the company at a set cost of capital. If the project returns an amount greater than zero euro it should be considered, but if it returns a negative value it should not be undertaken. Both of these formulas use the time value of money concept, where future payments are discounted back to the present. More simply put, the amounts received in year one are considered to be more valuable than a payment of an equal amount in following years. The value of one euro paid to the company will decrease every additional year it is separated from the present.
The below tables show the relative internal rates of return and net present values for each country’s system under the three different production levels during the first seven years of production using a cost of capital of 10 percent and an initial investment of five million euro. No operations and maintenance costs are included (Tables by Author).
Actual Production Levels:
Table 14 NPV and IRR at Actual Production
0 20 40 60 80 100 120 140 1 2 3 4 5 6 7 8 9 M o n th s Turbine Number
German Additional Introductory Tariff Months at Different
Production Levels
100% Months 75% Months 150% Months
2005 2006 2007 2008 2009 2010 2011 NPV IRR
Sweden Actual Income 874,049 950,735 854,561 1,259,740 1,094,283 1,195,740 1,118,288 11,071 € 10%
Sweden Variable Income 736,674 868,747 802,702 1,289,966 954,466 1,265,901 1,143,597 -234,116 € 9%
Germany Income 1,181,397 1,147,315 1,339,768 1,392,284 1,164,482 1,137,447 1,427,213 1,077,224 € 16%
France Income 1,148,412 1,115,282 1,302,361 1,353,411 1,131,969 1,105,690 1,387,365 907,547 € 15%
Spain Fixed Income 928,210 937,474 1,167,057 1,252,826 1,085,837 1,060,188 1,335,530 309,129 € 12%
75 Percent Production Levels:
Table 15 NPV and IRR at 75 percent Production
150 Percent Production Levels:
Table 16 NPV and IRR at 150 Percent Production Estimated Future Returns for 20 Year Period
This section will review the future estimated payments to the park up to year 20 under each subsidy system using a series of averages and estimates. No estimate will be done for the Swedish Actual income as it would follow the Swedish Variable income values as no future purchase agreements will be estimated.
For the systems where support ends after 15 years the park is assumed to have continued to operate and sell its production at the average market price until the end of year 20.
Total Income for Project Life of 20 Years Using both Estimated and Actual Data
The below charts show the total income from each of the subsidy methods using the real and estimated actual production income amounts, the real and estimated 75 percent production income amounts and the real and estimated 150 percent production income amounts from 2005 through 2024 (Tables by Author).
Actual Production Income Estimated for 20 Years:
2005 2006 2007 2008 2009 2010 2011 NPV IRR
Sweden Actual Income 655,536 713,051 640,920 944,805 820,713 896,805 838,716 -1,241,697 € 2%
Sweden Variable Income 552,505 651,560 602,026 967,474 715,850 949,426 857,697 -1,425,587 € 1%
Germany Income 886,047 860,486 1,004,826 1,044,213 873,361 853,085 1,070,410 -442,082 € 7%
France Income 873,539 848,338 990,640 1,029,471 861,031 841,042 1,055,298 -506,429 € 7%
Spain Fixed Income 686,354 697,814 865,663 929,730 803,318 777,522 995,909 -1,065,185 € 3%
Spain Premium Income 735,922 899,188 851,390 992,547 784,056 841,430 1,002,887 -793,822 € 5%
2005 2006 2007 2008 2009 2010 2011 NPV IRR
Sweden Actual Income 1,311,073 1,426,103 1,281,841 1,889,610 1,641,425 1,793,610 1,677,432 2,516,606 € 23%
Sweden Variable Income 1,105,011 1,303,120 1,204,052 1,934,948 1,431,699 1,898,852 1,715,395 2,148,826 € 21%
Germany Income 1,772,095 1,720,972 2,009,652 2,088,426 1,746,722 1,411,378 1,376,141 3,557,031 € 30%
France Income 1,747,077 1,696,676 1,981,280 2,058,942 1,722,063 1,035,151 1,298,371 3,205,164 € 29%
Spain Fixed Income 1,372,709 1,395,627 1,731,327 1,859,460 1,606,635 1,555,044 1,991,819 2,869,630 € 25%