Bioremediation and Leachate Treatment KALMAR, SWEDEN, November 25-27, 2003
STUDIES ON BIODEGRADATION OF
ORGANIC WASTE IN UASB REACTOR
C. B. Majumder, Anil Kr. Mathur, Vedprakash Kapse Indian Institute of Technology Roorkee, IndiaABSTRACT
The industrialization in the developing countries causes severe problems in collection, treatment and disposal of organic effluents. The situation leads to public health and environmental problem. Therefore, various high rate anaerobic treatments has been emerged as a variable alternative for the treatment of many industrial and domestic wastewater containing organic wastes. In this study high rate Upflow Anaerobic Sludge Blanket (UASB) reactor has been critically analyzed, discussed and designed as the solution of above problem. According to that a UASB reactor has been fabricated for laboratory study. The UASB system appeared to be economically cost effective as compared to other systems. This paper also focuses on the principle of startup, operational performance, chemical oxygen demand (COD) removal efficiency, methane production rate, and specific methanogenic activity in the UASB reactor. In the present study, reactor was started initially with mixture of molasses and glucose (50% each) solution with organic loading rate (OLR) 0.933 g COD/L day. Thereafter, OLR is being increased in steps. After 15 days of startup of reactor, molasses solution was applied. The temperature (35e° C), pH (6.8±0.4), and nutrients requirement were maintained. In this study COD: N: P ratio were maintained at 300: IO: l by adding urea for nitrogen and potassium di-hydrogen phosphate for phosphorus. For a change of OLR up to 13.33g COD/L day, all above-mentioned parameter were studied. The removal efficiency and gas production rate depend on activity of granules. A typical organic degrading granule is composed of micro-colonies of Methanothrix and several syntropic micro -colonies. KEYWORDS:
UASB, Biodegradation, Wastewater treatment
1 INTRODUCTION
The concept of Upflow Anaerobic Sludge Blanket (UASB) reactor was developed in 1970s by Lettinga and his co-worker in Netherlands. The key to the process was the discovery that anaerobic sludge inherently has superior flocculation and settling
KALMAR ECO-TECH'03 Bioremediation and Leachate Treatment KALMAR, SWEDEN, November 25-27, 2003
characteristic. Thus, a high solids retention time (at high loading rate) can be achieved, with the separation of gas from the solid sludge (Lettinga et al., 1980). UASB reactor is the most popular high rate as well as medium and low rate reactor for anaerobic treatment of wastewater throughout the world. It is one of the reactor types with high loading capacity. The main advantage of UASB reactor over other reactors is lower initial cost, low operational and maintenance cost, low energy consumption, generation of biogas, small land area required, high efficiency, no noise produce etc. It differs from other processes by the simplicity of its design. UASB process is a combination of physical and biological processes.
The UASB reactor is divided into three distinct zones, namely sludge bed, sludge blanket, and gas solid separator (GSS). The wastewater is initially fed into bottom of the reactor by insuring that the microbial population is uniformly distributed into the incoming flow across the entire cross-sectional area of the reactor in order to promote efficient substrate utilization. The wastewater entering the reactor passes through the sludge bed zone. The sludge bed zone is most active zone of the reactor, so most of the organic waste (70 to 80%) is stabilized in this zone. The high concentration in this zones were mainly due to the development of a high granules sludge (consisting of active biomass or bacteria), which has superior settling properties (Lettinga and Zeeuw, 1980). The sludge bed zone has been described as a perfectly mixed region (Heertjes et al., 1979), which can actually be divided into smaller sub regions. The first sub region encountered in the sludge bed is the area around the influent ports, which is considered to be a perfectly mixed region. Gas production by the biological sludge results in gas bubbles, which produces mixing throughout the bed and eventually eliminate any initial dead space region. The next zone, sludge blanket zone is considered ideally mixed and consists of highly flocculent particle. During the study it is found that the sludge blanket is a combination of ideal mixer and settler in a plug flow region. There is no need of mechanical stirring because the gas produced cause sufficient mixing. In the sludge blanket, the residual organic are converted into gases, though not necessary at the same rate as in the sludge bed. The sludge blanket also acts as barrier against the further upward moment of biomass lifted by inflow feed and by the uprising of the gas bubbles. The gas solid separator (GSS) is the top most part of the UASB reactor.
2 EXPERIMENT AL SETUP
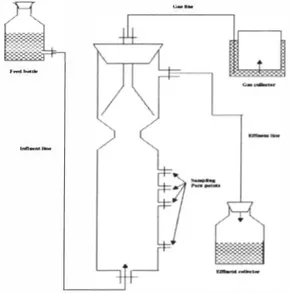
A lab scale UASB reactor, made of glass was fabricated by City Enterprises Ltd, Ambala, India (figure 1). A circular reactor has been designed for 2 liter capacity per day with the volume of 0. 75 liter. The region of influent, eflluent and gas collection point have the 8 mm diameter. In the reactor, there are four-pore point with 5 mm diameter, each for collection of sample - one for the sludge and rests for wastewater. The total height of the reactor is 35 cm and internal diameter is 5.7 cm. The UASB reactor was equipped at the top with a reverse funnel phase separator. This is fitted at the top of the reactor with the help of rubber cork for separation of solid, liquid and gas. The diameter of inclination is 52 mm with inclination angle 45e° . The gas produced in the reactor is collected in the variable volume system. The whole experimental setup has been placed in the incubation chamber for maintaining the temperature at 35e° C.
Bioremediation and Leachate Treatment KALMAR, SWEDEN, November 25-27, 2003 3 MATERIALS
3.1 Seed sludge
The successful operation ofUASB reactor needs the seed. In this study, the mixed culture is used as seed. The anaerobic digested sewage sludge was obtained from the Sewage Treatment Plant Kankhal, Hardwar India and a small amount of granules sludge was obtained from Environmental Engineering Laboratory, Department of Civil Engineering, IIT, Roorkee.
3.2 Substrate
In the present study, molasses solutions of various loading rate have been used as feed. 3.3 Chemicals
In the present study, chemicals are required for the analysis of influent and effluent solution and also are required to provide nutrients, such as urea (for nitrogen), Potassium di-hydrogen orthophosphate (for phosphorus) and sodium bi-carbonate to maintain pH. Apart from these, for COD analysis other chemicals are required such as sulphfuric acid, mercuric sulphate, silver sulphate, potassium di chromate, ferrous ammonium sulphate, ferroin indicator etc.
3.
KALMAR ECO-TECH'03 Bioremediation and Leachate Treatment KALMAR, SWEDEN, November 25-27, 2003 4 EXPERIMENT AL PROCEDURE
Molasses degrading bacteria are required to be adopted molasses environment. This is much more important in cases where these bacteria are to be used to degrade high concentration of organic waste removal. In the present work, the high COD of molasses solution are to be removed in the designed UASB reactor. Therefore, acclimatization is necessary to adopt this environment. The acclimatization of mixed culture has been performed in the UASB reactor. This was done by transferring seed (mixed culture) into the reactor. Then the reactor was fed with the solution of molasses and glucose (50% each). The solution was prepared with the tab water with equal quantity of molasses and glucose. The experiment had been started with COD concentration 350 mg/L with maintained flow rate and hydraulic retention time (HRT) of 9 hr. Initially, startup period temperature and nutrients must be maintained. In this study temperature was maintained at 35± 5° C and urea and potassium di-phosphate were added to maintained COD:N:P (macro-nutrients) ratio of 300:40: 1. Initially sufficient nutrients are required in the feed for the growth of microorganisms and temperature, pH, flow rate and volatile acids concentration are also maintained. When the steady state is reached for 350 mg/L COD, COD is changed to 500 mg/I. At this point, the reactor was switch over to only molasses solution as feed. After this, the OLR was increased gradually upto 13.33 g COD/L day and studied various parameters such as %COD removal, gas production rate, methane composition etc.
5 EXPERIMENT AL ANALYSIS
During startup, the reactor performance and sludge behavior were monitored. The temperature in the incubation chamber and the feed rate to the reactor were maintained at 35±5° C and at 2 U days respectively. The following analyses were performed for the
monitoring of the lab scale plant. The frequencies were chosen to get a wide appreciation of the behavior of the system over the entire experimental period, as well as in response to the workload that could be handled for the study.
Table 1: Analysis of various parameters on frequency basis
S.No. Parameters Freauencv
1. Temperature Daily, momentaneous, on spot
2. pH (influent, effluent)
4.
Daily, momentaneous, on spot COD (influent, effluent) Daily, momentaneous, on spot
TSS, VSS Weekly
5. Gas production Daily
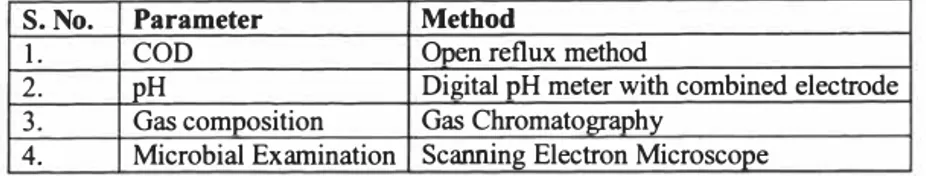
For the analysis of the influent and effluent, the standard method APHA (1989) were followed. The gas production was measured using a variable volume method. Total suspended solids and volatile solids were determined according to the standard method. The standard methods, adopted were shown in table 2.
Bioremediation and Leachate Treatment KALMAR, SWEDEN, November 25-27, 2003
Table 2: Analytical techniques adopted for the determination of various parameters
S.No. Parameter Method
l. COD Ooen reflux method
2. pH Digital pH meter with combined electrode 3. Gas composition Gas Chromatography
4. Microbial Examination Scanning Electron Microscope 6 RESULTS AND DISCUSSION
The perfonnance of reactor, in terms of COD removal efficiency, effiuent concentrations, VSS concentration, and methane production rate was continuously improving with operation. The pH range of the effiuent from the reactor was in the range of 5.5 to 6.3. Due to occasional period of clogging in the pipeline and voltage fluctuation, it is impossible to keep the reactor in continuous operation over the entire period of experiment. This shows a major impact on the regular pattern of the gas production and COD removal efficiency.
6.1 STARTUP OF UASB REACTOR
Initially, the UASB reactor was seeded with raw sewage sludge obtained from anaerobic reactor operating on municipal wastewater. First, the reactor was fed with the solution of molasses and glucose (50% each). The solution was prepared with equal quantity of molasses and glucose. After, 15 days of startup the reactor was fed only molasses solution. During startup period, the temperature was maintained at 35 ± 4e° C. The OLR was increased in several steps. In each increased steps all parameters were analyzed such as COD removal efficiency, gas production rate, pH, influent and effluent COD. At the end of each increased step in OLR, sludge concentration and VSS were analyzed by standard method.
6.2 COD REMOVAL EFFICIENCY
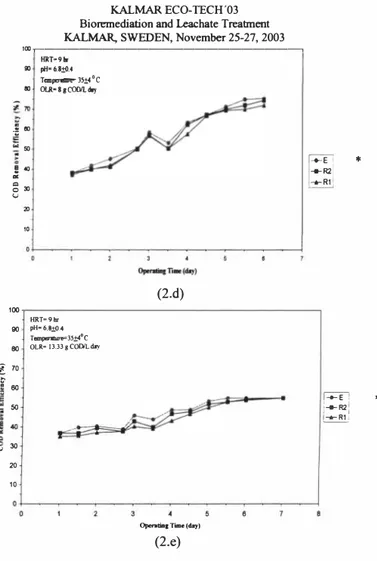
The COD removal efficiency of a UASB reactor was mainly depend on the COD loading rate, and was not sensitive to either hydraulic retention time (HRT) or the wastewater COD level alone. In this study, the COD loading rate had been increased by increasing the COD level in wastewater. Because the reactor was seeded the partially granulated sludge, sludge in the reactor was readily fonn granular during startup. The COD removal was calculated from the soluble COD in effiuent and from the total COD in the wastewater. The COD removal efficiency of the reactor is illustrated in figure (2.a) to figure (2.e). The figures represented COD removal efficiency vs. time at different OLR. Figure (2.a) shows, initially the COD removal efficiency were low. But with the progress of experiment, the COD removal efficiency gradually kept increasing. The COD removal was increased from 20% to 90% in 8 day. When steady state was achieved, OLR was increased to 1.33 g COD/I day. After changing the COD removal efficiency was drastically reduced to about 38% at 9 hr HRT. Then COD removal efficiency was
pH•6.li(l.4
KALMAR ECO-TECH '03 Bioremediation and Leachate Treatment KALMAR, SWEDEN, November 25-27, 2003
100�---�
HRT•91r
..
pH-6.� ...T...,.._-JS;t4 ° C
..
a.R• o.9'Jl I ant. dilJi..
..
70l
'°8 "'
"' 10---
5 (2.a) ,oo�---�..
HRT•9t. pH-6.l-+0.4 Teq,erann- J� • C..
cx..R-l.1l1CCOr'Lday 20 10 O+---''
10 �n..1-,) (2.b) ,oo�---HRT-9111' 90 Taapetalln'"3'±4 ° C aa ou .. •1C01M..ct.:r 20 10 5 10 -'-<(..,) (2.c) • E- Effluent, RI- Sampling point I, R2- Sampling point 2•
•
•
�
.
..,
� � ,o p/1•6.l�.4 OJ OUl•lgCOO/Ld,y 10Bioremediation and Leachate Treatment KALMAR, SWEDEN, November 25-27, 2003 1'Xlr---, HRT•91, Temperamrc-l.S.t4 ° C :
.,
·;;..
.,
= =.,
u.,
10 (2.d) 100 HRT•9hr 90 pH•6.8,±(>.4 Tempm.aure-3.S±4 ° COLR• 13.33 g COD'L day
90 l 70 � 60 50 30 '-' 20 * -+-E ... R2) 1 -+-R1 *
Opentia1 Time (day)
(2.e)
�.
�·
!::+---+--�
KALMAR ECO-TECH '03 Bioremediation and Leachate Treatment KALMAR, SWEDEN, November 25-27, 2003
•
.g'° 0 U•-=•
Cll UD "' E!• u �·.�---.--.--.--.---0--.--.--.--�-�5Figure 4: Sludge concentration vs. time
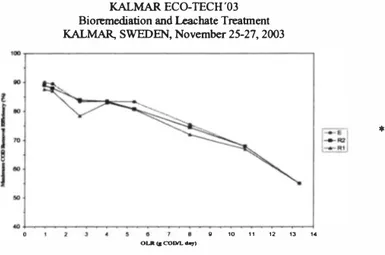
increased with time in 9 days. The figures from (2.a) to (2.e) show the same trend. In all figures, it has been obtained that when OLR was changed, the COD removal efficiency was drastically reduced, but after time passed, the COD removal efficiency was increased in steps. The figure (3) shows that with the increased in OLR then the maximum COD removal efficiency was decreased. The COD removal efficiency was decreased from 90% at OLR 0.933 g COD/L day to 55% at OLR 13.33 g COD/L day. But the gas production rate was increased in each step increased in OLR. However, having achieved the limited objectives of studies of UASB reactor performance, the operation was terminated at on OLR of 13.33 g COD/L day. The relative decreased in efficiency at several points was due to abnormal buildup of VF A within the reactor and voltage fluctuation.
Iii 10 11 12 13 1-4
OLA(IICODl'l...,.I
Figure 3: COD Removal Efficiency vs OLR Jm,,....---,
Bioremediation and Leachate Treatment KALMAR, SWEDEN, November 25-27, 2003 6.3 SLUDGE CONCENTRATION
The sludge concentration is the most important factor for the evaluation of performance of reactor. The sludge concentration in the reactor defined as on the basis of total solid (TS) and volatile suspended solid (VSS). Figure (4) shows the average sludge concentration against time. It is found that at startup period the sludge concentration was decreased up to 30 days. After this, the sludge concentration was increased gradually.
6.4 SLUDGE LOADING RATE
Sludge loading rate (SLR) is another important variables effecting the granulation time in UASB reactor. The SLR can be defined as the rate of food (COD) supplied daily to the system per quantity of active mass in the reactor. Figure (5) shows the sludge loading rate corresponding to different OLR. It shows that SLR gradually increased with steps increased in OLR. It shows a minimum value of 0.0177 g COD/g VSS day at an OLR 0.933 g COD/L day to a maximum value of0.2326 g COD/g VSS day at an OLR 13.33 g COD/ L day. It means the sludge load in the reactor was increased with time at increased OLR.
6.5 GAS PRODUCTION RATE
The gas production rate is one of the key parameter for evaluation of performance of reactor. Because COD removed is due to methane production. In literature, it shows that initially gas production rate is low, because of sludge bed expended in the startup. Figure (6) shows the gas production rate with changed steps in OLR. The gas production initially is low at low OLR. But when OLR is increased, the gas production rate increased gradually. Figure (6) shows that the gas production rate was increased maximum at 13.4 g COD/L day. However, after this, there is a gradual decrease in the gas production rate and at this OLR, average methane concentration was observed 60%. The methane production was found to be low in the initial stages. But later on, the methane content was increased upto 70% at increased OLR. Figure (6) show methane gas yield at various OLR.
KALMAR ECO-TECH'03 Bioremediation and Leachate Treatment KALMAR, SWEDEN, November 25-27, 2003
Figure 5: Sludge Loading Rate vs. OLR
08 015 07 C .gQ6S ] 06 al 055 � as d,045 .!l 04 ex 03S .9 ru .g025
£
02 gjo15 O 01 oo; 0 0 4 KJ II 12 13 14 ISFigure 6: Gas production rate vs, OLR
52
,.,_
____________________________
__,0 ]) D ()
Bioremediation and Leachate Treatment
KALMAR, SWEDEN, November 25-27, 2003
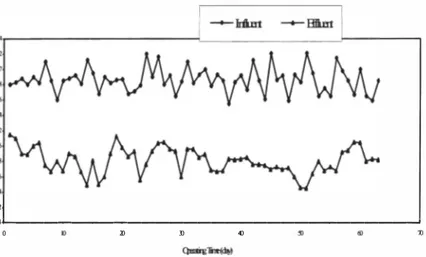
6.6 pH LEVELS
For successfully operation, the control of influent pH is also equally important. The optimum pH of influent molasses solution is between 6.5-7.0. Increased in pH value would cause increase in VF A. The variation of pH levels of influent and effluent are shown in figure (7) against days. The figure (7) shows variation of pH daily basis but mostly pH near to the neutral levels was maintained. Because small change in pH caused change in gas production rate.
6.7 MICROSTRUCTURE OF GRANULES
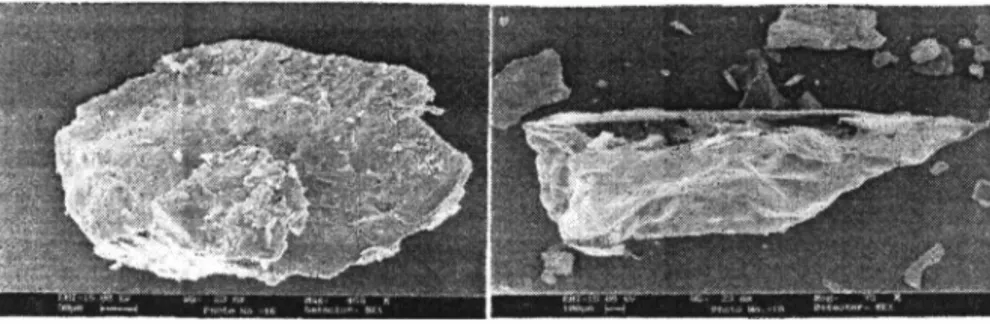
Microbial structure of granules depends upon the granulation process and startup of reactor. On the other hand, the granulation processes are depended on type of seed, type of feed and quantity of calcium present in the influent. Apart from these, there are many other factors, which effect the development of granules. A scanning electron microscope (SEM) of black granules is presented in figure (8). It shows the SEM micrograph of a
hollow black granules. It is suspected that a hollow core within the granules was the reason for poor settling. Figure (9) shows a large magnified SEM of the bisect specimen.
The surface shows the large number of micro-organism density packed in the interior of granules.
Figure 8 a. A scanning electron microscope (SEM) of a black granule b. SEM micrograph of a hollow black granule
KALMAR ECO-TECH '03 Bioremediation and Leachate Treatment KALMAR, SWEDEN, November 25-27, 2003
7 CONCLUSIONS
The achievement of effective COD removal at high rates in present study was probably due to the readily biodegradable nature of molasses, the balance nutrients, the systematic acclimation strategy during startup, and the buildup of GSS separator, which efficiently retains sludge granules in the reactor.
• The shock loading in the reactor must be avoided. Therefore, OLR was maintained in steps of 1 g COD/L day. The COD removal efficiency 80-90% was easily achieved with the UASB process. But when the OLR is changed then the COD was drastically decreased by 40% and then increased.
• Gas production rate and its composition and effiuent pH, COD, and VF A presented more sensitive responses to various shocks among the various parameters, if gas production rate and composition are stable. The pH and VF A can be considered to clearly characterize the reactor status if the gas production rate and composition are not stable. Therefore, a more effective and convenient method needed to control all parameter to characterize in the obtained system.
• For successful operation of the system, the temperature could be maintained between 30-40° C. A low temperature (<10° C) and a high temperature {>50° C) affect the performance of reactor.
8 REFERENCES:
[I.] Ahn, Y. H., K. S. Min, and R. E. Speece, (2001), Pre-acidification in anaerobic sludge bed process treating Brewery wastewater Water Res., 35(18), pp. 4267-4276. [2.] Annachhatre, A. P., and P. L. Amatya, (2000).UASB treatment of Tropica Starch
wastewater, J. Environ. Engrg., ASCE, 126 (12), pp. 1 149-1152
[3.] Cecchi. F., P. G. Traverso, J. Mata-Alvarez, F.Medici, and G. Fazzini, (1990). A new approach to the kinetic study anaerobic digestion of the organic fraction of municipal solid waste, Biomass, 23, pp. 79-102.
[4.] De Zeeuw, W., G. Lettinga, (1985). Granular Sludge In UASB -Reactors granular anaerobic sludge microbiology and technology, Pudoc, Wageningen. Netherlands, pp. 132-145
[5.] Fang, H. H. P., H. K. Chui, Y. Y. Li, and T. Chen, (1994). Performance and granule characteristic ofUASB process treating wastewater with hydrolyzed proteins, Water Sci. Tech., 30. pp. 55-63.
[6.] Fang, H. H. P., G. Liu, J. Zhu, B. Cai, and G. Gu, (1990). Treatment of brewery effiuent by UASB process J. Environ. Engrg., ASCE, 116 (3), pp. 454-460.
[7.] Hulshoff Pol, L., K. Heijnekamp, and G. Lettinga, (1988). The selection pressure as a driving force behind the granulation of in anaerobic sludge Granular Anaerobic Sludge, Microbial and Technology, pp. 153-161.
[8.] Kosaric, N., R. Blaszczyk, L. Orphan, J. Valladares, (1990)e. The Characteristics of Granules from UpflowAnaerobic Sludge Blanket Reactors, Water Res .. 24(12), pp. 1473-1477
[9.] Lettinga, G., L. W. Hulshoff Pol, W. M. Welgant, W. de Zeew, A. Rinzema, D. C. Grin, R. E. Roersama, and S. W. Hobrna, (1984). High-rate Anaerobic wastewater Treatment Using the UASB Reactor under a Wide Range of Temperature Condition,
Biotech, & Bioengg. 49(3) pp
Bioremediation and Leachate Treatment KALMAR, SWEDEN, November 25-27, 2003
Biotechnol Gent. Engrg, Rev,, 2, pp, 253-258,
[10,] Lettingae, G., R. Roersma, P. Grin, W. de Zeeuw, L. Hulshoff Pol, L. van Velson, S.
Homba, (1981 ). Anaerobic Treatment vf sewage and low strength wastewater, Anaerobic Digestion, pp. 271-291
[11.] Lettinga, G,, S. Koma, W. de Zeeuw, L. Hulshoff Pol, P. de Jong, D. Grin, and R« Roursma, (1983), Design Operation and economy ofanaerobic treatment, Water Sci. Technol..e15(8/9).epp. 177-196.
[12.] Lettinga, G., A. F. M. van Velesh. A. E. Homba, I. W. Deeuw, and A. Kalpwijk, ( 1980). Use of (he Up flow sludge reactor concept for biological wastewater treatment especially for anaerobic treatment, Biotech. Bioeng., 22, pp. 699-744. [ 1 3.] Lettinga, G., and L. Hulshaff Pol, (1991). UASB Process design for various types,
Wastewater Water Sci. TechnoL, 24(8), pp. 87-107.
[14.] Schmidt, E,, and B. K. Ahring, (1996). Granular sludge formation in UASB reactors, [15,] Shen, C. F., N, Kosaric, and R, Blaszcyk, (1993). The effect of selected heavy
Metals (Ni, Co and Fe) on UASB reactors, Water Res., pp. 25-33,
[ 16.] Speece, R. E., ( 1983 ). Anaerobic Biotechnology for Industrial waste treatment, Environ. Sci. TechnoL, 17, pp. 41-64.
[17.] Stronach, S. M., M. C. Diaz-Baez, T. Rudd, and J. H. Lester, (1987). Factors effecting biomass attachment during startup and operation of anaerobic fluidized bed, Biotech. Bioeng., 30, pp. 61 1-620
[ 1 8.] Thiele. J. H,, W. M. Wu, and J. G. Zeikus, (1990). Engineering high rate
biomethanation systems, design of improved syntrophic catalysts, Biolech. Bioeng., 30, pp. 611-620
[ 19.] Van Loosdrecht, M. C. M., and A. J.eB. Zehnder, (1990). Energetic of bacterial adhesion Experientoa, 46 , pp. 817-822
[20.] WPCF., (1987). Anaerobic Sludge Digestion., Manual of Practice No. 1 9 Second Ed. Water Pollution Control Federation. Alexandria, VA.
[21.) Yan, Y. G., and J. H. Tay, (1996) .. Brewery wastewater treatment in UASB reactor at ambient temperature J. Environ. Engrg., ASCE, 122 (6), pp. 550-553
[22.) Young, J.C,, and P. L. McCarty, (1996). The anaerobic filter for waste treatment, J. Water Pollut. Control. Fed., 41, pp. Rl60-Rl 73
[23.) Yu, H. Q., H.eJ. Tay, H. H.eP. Fang, (2000). The Roles of Calcium in Sludge Granulation During UASB Reactor Start-up, Water Res .. 35(4), pp. 1052-1060