ELEMENTAL COMPOSITION OF C, N AND P IN
SINGLE CELLS OF THREE FILAMENTOUS
CYANOBACTERIA USING NMP (NUCLEAR
MICROPROBE) AND TRADITIONAL
TECHNIQUES
Eva Pérez Blanco
1Chatarina Karlsson
1Jan Pallon
2Edna Granéli
11
LnUCEEMiS – Marine Ecology, School of Natural Sciences,
Linnaeus University, Sweden
2Department of Nuclear Physics, Lund Institute of Technology,
University of Lund, Sweden
ABSTRACT
Intracellular contents of carbon, nitrogen and phosphorus in phytoplankton cells are traditionally measured using concentrates containing thousands to millions of cells. In this study we have used a Nuclear MicroProbe (NMP) as an approach for the determination of C, N and P concentrations in single filaments of three cyanobacteria species: Anabaena sp., Nodularia spumigena and
Aphanizomenon flos-aquae var. klebahnii isolated from Baltic Sea water. Estimations of C, N and
P content per cell have been calculated and compared with the concentrations found with traditional bulk methods. No significant differences regarding the C, N and P cellular content were found between the two methods for each of the species tested. From our results we conclude that the use of NMP can be a useful tool for studying the elemental contents in single phytoplankton cells occurring among several thousands of other cells of different species in field samples.
KEYWORDS
Baltic Sea, elemental cellular content, nitrogen-fixing cyanobacteria, nuclear microprobe, nutrients.
1 INTRODUCTION
Cellular nutrient concentrations and ratios are used to determine the state of the cells, that is if their growth is limited by one or several nutrients. Traditionally, the intracellular macronutrients (carbon (C), nitrogen (N) and phosphorus (P)) are analysed from a cell concentrate. In other occasions, the inorganic N and P available in the water are analysed. Measurements of dissolved
nutrients in the water may also give an indication of the nutrient status of the phytoplankton cells. However, the internal nutrient status in the cells is more important and a more reliable measurement to estimate nutrient sufficiency or deficiency in phytoplankton cells, than the nutrient concentrations in the medium, as many species do accumulate higher amounts of the deficient nutrient when this is offered in higher amounts, the so called “luxury uptake” [1]. Ultimately these factors affect different phytoplankton species growth rates in a positive or negative way [1, 2]. When the availability of nitrogen or phosphorus control algal growth, a near maximal growth rate would be reflected in high C:N:P ratios near the Redfield ratio [16]. The Redfield ratio C:N:P of 106:16:1 (by atoms), which is related to mixed phytoplankton cells growing in the open oceans [10], has been the base in numerous experiments to determine if the cells are N and P sufficient or deficient. However, laboratory studies have shown that species-specific C:N:P ratios may vary significantly from the Redfield ratio [12]. Therefore, determination of the elemental ratios of cellular nutrient concentrations give a better indication of nutrient limitation in algal cells than the quantification of the level of nutrients in the medium [6]. The NMP refers to several techniques that can be used for qualitative or quantitative analysis. Some of these techniques have been used in life sciences studies for a number of years now [10]. In this study, high-energy protons were used to estimate the intracellular composition of C, N and P in single cyanobacteria filaments. The NMP techniques used here were Particle Induced X-ray Emission (PIXE) to quantify P, proton Backscattering Spectrometry (BS) for C and N and Scanning Transmission Ion Microscopy (STIM) to estimate the areal mass density of the sample (mg cm-2). The principles of the NMP techniques can be read elsewhere [15, 7].
The species examined in this study were the brackish-water filamentous cyanobacteria Anabaena
sp., Nodularia spumigena and Aphanizomenon flos-aquae var. klebahnii. They are all common
components of the phytoplankton community in the Baltic Sea and have the ability to reduce N2
to NH4+, which can be very advantageous over other species, when other sources of inorganic
nitrogen become unavailable [13]. The most abundant species in the yearly recurrent cyanobacterial blooms in the Baltic Sea are the non-toxic Aphanizomenon flos-aquae and the hepatotoxic Nodularia spumigena [18]. Anabaena sp., also hepatotoxic, is also present, but usually represents less than 10% of the total community cell numbers [4]. The aim of this study was to investigate how comparable the NMP techniques are towards traditional bulk techniques with respect to the C, N and P cellular content of three cyanobacteria species. Also, information on the nutrient variability within individual filaments in the population is given.
2 MATERIAL AND METHODS 2.1 Algal strains
The three cyanobacteria species used in this study were isolated from Baltic Sea waters and kept at the Kalmar Algae Collection (KAC, Linnaeus University, Kalmar, Sweden). The three species were: Anabaena sp. (KAC 6) isolated in Askö in the Stockholm archipelago in 1997, Nodularia
spumigena (KAC 10) and Aphanizomenon flos-aquae var. klebahnii (KAC 15), both isolated
from the Kalmarsound. For simplification, we will refer to species KAC 15 as A. flos-aquae from now on. All three species were grown in 500 ml batch cultures with f/2 medium, 7 psu, 16°C, under 240 μE m-2 s-1 irradiation with a 16:8 hours light:dark cycle. Once cultures were in
exponential phase samples were taken for particulate C, N and P analyses using the NMP and traditional bulk methods.
2.2 Nuclear Microprobe analysis
The samples analysed by the NMP method were prepared as in [5], but no vacuum was applied during filtrations. A total of 14-16 filaments of each species were analysed with PIXE, BS and STIM. Results of C, N and P cellular content were converted to pmol cell-1. The Microprobe was calibrated according to [8] to allow the calculation of elemental content measured with these techniques.
2.3 Elemental analyses using bulk methods
For C, N and P analyses using bulk methods, 4x50 ml (2 for C and N and 2 for P) of each culture were filtered through a pre-combusted (450°C, 2 hours) Whatman GF/C glas fiber filter. The particulate C and N on the filters were analysed using a CN-analyser (NA 1500 NC, FISONS Instruments). The particulate P analyses were performed according to the method described by [14]. Finally each sample was analysed using PO4 reagents for nutrient analysis [19] and
measured in a spectrophotometer (CADAS 100, DR LANGE) at 882 nm.
2.4 Cell quantification
Cell counts for the estimation of nutrient contents in pmol cell-1 for the bulk methods were carried out according to the Utermöhl method [17]. Samples were taken at the same time as those for elemental analysis, and preserved with acidic Lugol’s solution. Prior to sedimentation, the filaments were sonicated (Misonix Sonicator XL2020) for 30 seconds in order to break them into shorter lengths. A minimum of 400 filaments of each species were counted using an inverted microscope. The filaments were measured and cell numbers determined by dividing the total counted length by the length of one cell. These measurements were used to calculate the element content per cell obtained with both NMP and bulk methods.
2.5 Statistical analyses
The Mann-Whitney U test was used to calculate the statistical difference between the two techniques for each element and the significance level was set at 0.05. Elemental content and ratios of the three strains were compared using Kruskal-Wallis test (p < 0.05). All statistical analysis were carried out using the computer program SPSS 19.
3 RESULTS AND DISCUSSION
Cell densities at the same occasions when samples where collected for analyses of the different elements were as follows: Anabaena sp. 5.9 x 10⁵ cells ml-1, N. spumigena 8.3 x 10⁵ cells ml-1 and A. flos-aquae var. klebahnii 14.4 x 10⁵ cells ml-1.
The carbon content obtained in this study differed from those estimated by [3], (measurement of cells and use of a stoichiometric formula), for Anabaena sp (0.33 pmol C cell-1) and for A.
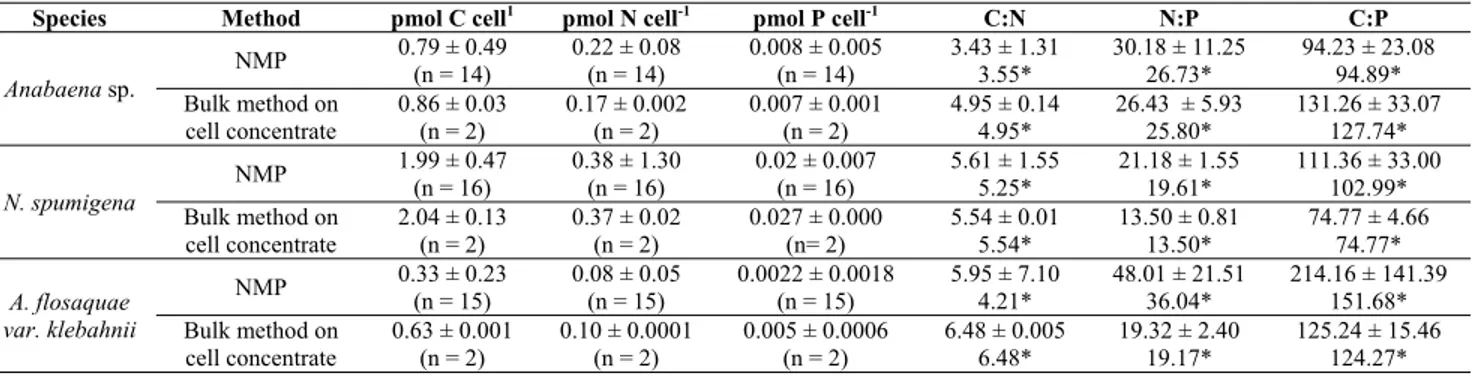
Table 1: C, N and P contents and ratios (mean ± SD) obtained using the NMP and bulk methods. Number f measurements are in parentheses. For the NMP, n refers to filaments and then content per cell was calculated.
Species Method pmol C cell1 pmol N cell-1 pmol P cell-1 C:N N:P C:P
Anabaena sp. NMP 0.79 ± 0.49 (n = 14) 0.22 ± 0.08 (n = 14) 0.008 ± 0.005 (n = 14) 3.43 ± 1.31 3.55* 30.18 ± 11.25 26.73* 94.23 ± 23.08 94.89* Bulk method on cell concentrate 0.86 ± 0.03 (n = 2) 0.17 ± 0.002 (n = 2) 0.007 ± 0.001 (n = 2) 4.95 ± 0.14 4.95* 26.43 ± 5.93 25.80* 131.26 ± 33.07 127.74* N. spumigena NMP 1.99 ± 0.47 (n = 16) 0.38 ± 1.30 (n = 16) 0.02 ± 0.007 (n = 16) 5.61 ± 1.55 5.25* 21.18 ± 1.55 19.61* 111.36 ± 33.00 102.99* Bulk method on cell concentrate 2.04 ± 0.13 (n = 2) 0.37 ± 0.02 (n = 2) 0.027 ± 0.000 (n= 2) 5.54 ± 0.01 5.54* 13.50 ± 0.81 13.50* 74.77 ± 4.66 74.77* A. flosaquae var. klebahnii NMP 0.33 ± 0.23 (n = 15) 0.08 ± 0.05 (n = 15) 0.0022 ± 0.0018 (n = 15) 5.95 ± 7.10 4.21* 48.01 ± 21.51 36.04* 214.16 ± 141.39 151.68* Bulk method on cell concentrate 0.63 ± 0.001 (n = 2) 0.10 ± 0.0001 (n = 2) 0.005 ± 0.0006 (n = 2) 6.48 ± 0.005 6.48* 19.32 ± 2.40 19.17* 125.24 ± 15.46 124.27*
* Ratios calculated as ratios of mean elemental contents per cell instead of the mean of elemental ratios.
However, a C content at least 4 times higher have also been reported for N. spumigena [9]. For all three species the elemental content measured with NMP showed higher variability than the bulk methods (Table 1). For Anabaena sp. the NMP techniques generated lower C:N and C:P ratios compared to those from the bulk methods (Table 1). The elemental contents were also comparable in the case of N. spumigena with calculated C:N ratios similar for the two methods, but with higher N:P and C:P ratios when determined by the NMP techniques, as expected from the lower P content obtained with this technique (Table 1). In the case of A. flos-aquae, all C, N and P contents measured with the NMP were lower than those obtained using bulk methods, which is also reflected in the nutrient ratios (Table 1). However, there was no significant differences between neither the C, N and P content obtained using bulk methods and the NMP, nor between the C:N, N:P and C:P ratios obtained with each one of the analytical methods (p<0.05). The filaments analysed here were growing exponentially in nutrient replete cultures and should therefore show the optimum nutrient content in the cells. Even though, we observed high variability between the element content per cell from different filaments when using the NMP techniques. This is partly due to the much lower number of cells that can be analysed using this method, but also because it allowed us to obtain the actual content on individual filaments, showing also the variability within the population. However, elemental content at determined conditions cannot be taken as the only reference for one species. It is been observed that with decreasing temperatures, the C, N and P content of Scenedesmus sp. and of Asterionella formosa, increased under nutrient sufficient conditions [11].
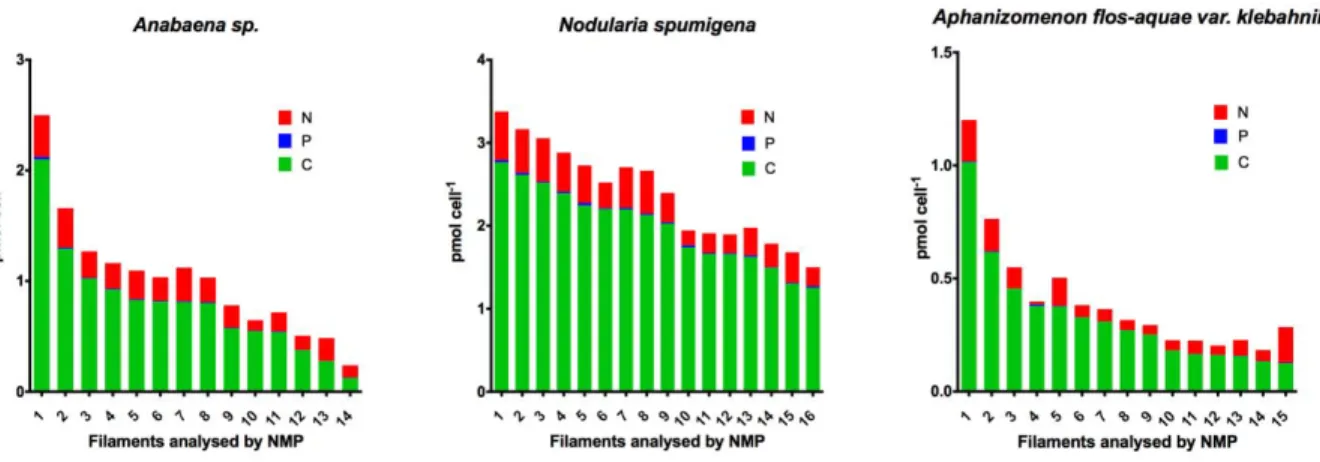
If comparing the three species, differences in their C, N and P cellular content were observed (Figure 1). N. spumigena showed the highest contents per cell of all three elements, whereas A.
flos-aquae showed the lowest. There was a statistical significant difference on the C, N and P
content between the three species (p<0.05). When looking at the C:N, N:P and C:P ratios, all three species seemed close enough to the Redfield ratios (Table 1). However, there was also a significant difference on the ratios of each species. All three species were N replete and only
Aphanizomenon flos-aquae seemed P depleted according to the Redfield ratios, although all
showed N:P ratios above 16, probably due to an excess in N, more than to P depletion. However, Wallström [20] found that an N:P ratio of 10:1 in the water corresponded to favourable
conditions for nitrogen-fixing algae, whereas a lower ratio, opposite to our case, would indicate phosphorus excess. Wallström studied was carried out with Aphanizomenon flos-aquae, species whose growth was less stimulated by phosphorus input than that of Nodularia and Anabaena [21]. These observations, as well as the differences observed in the cellular nutrient content in this study, might show different requirements for each of these species, as well as differences in their efficiency for nutrient uptake. For instance, N. spumigena is a superior competitor at low phosphorus concentrations than A. flos-aquae, because it is more efficient at utilising organic sources and a better grower on intracellular stores [18]. This is in agreement with the high phosphorus content found in N. spumigena in comparison with those found in Anabaena sp. and
A. flos-aquae, since all were growing under the same conditions.
Figure 1. C, N and P content (pmol cell-1) found in each of the filaments analysed by NMP for the three species studied: Anabaena sp., N. spumigena and A. flos-aquae.
5 CONCLUSIONS
The NMP is a potentially useful tool to measure phytoplankton nutrient status using field samples. Not only it is comparable with traditional bulk methods, but it is species-specific and will show the variability within a given population competing with other phytoplankton species in the actual chemical environment they are growing in.
ACKNOWLEDGEMENTS
The authors would like to thank Christina Esplund for her technical support. This work was financed by the EU NUTOX project, contract MAS3-CT97-0103, and by the Swedish Natural Science Research Council (VR), both projects contract holder E. Granéli.
REFERENCES
[1] Droop, M. R., 1973. "Nutrient limitation on osmotropic protista." American Zoologist 13(1): 209-214.
[2] Droop, M. R., 1974. "Nutrient status of algal cells in continuous culture." Journal of the
[3] Edler, L., 1977. Phytoplankton and primary production in the Sound. PhD thesis. University of Göteborg, Sweden.
[4] Engström-Öst, J., Repka, S., Mikkonen, M., 2011. Interactions between plankton and cyanobacterium Anabaena with focus on salinity, growth and toxin production. Harmful
Algae 10, 530-535.
[5] Gisselson, L.-A., Graneli, E., Pallon, J., 2001. Variation in Cellular Nutrient Status within a Population of Dinophysis norvegica (Dinophyceae) Growing in Situ: Single-Cell Elemental Analysis by Use of a Nuclear Microprobe. Limnology and Oceanography 46, 1237-1242. [6] Holm, N. P., Armstrong, D. E., 1981. Effects of Si-P concentration ratios and nutrient
limitation on the cellular composition and morphology of Asterionella formosa (Bacillariophyceae). Journal of Phycology 17(4): 420-424.
[7] Llabador, Y., Moretto, P., 1998. Applications of nuclear microprobes in the life sciences: an efficient analytical technique for research in biology and medicine. World Scientific
Publishing Co. Pte. Ltd. Singapore.
[8] Pallon, J., Elfman, M., Kristiansson, P., Malmqvist, K., Granéli, E., Sellborn, A., Karlsson, C., 1999. Elemental analysis of single phytoplankton cells using the Lund nuclear microprobe. Nuclear Instruments and Methods in Physics Research Section B: Beam
Interactions with Materials and Atoms 158, 312-316.
[9] Panosso, R., Graneli, E., 2000. Effects of dissolved organic matter on the growth of
Nodularia spumigena (Cyanophyceae) cultivated under N or P deficiency. Marine Biology
136, 331-336.
[10] Redfield, A. C., Ketchum, B., Richards, F., 1963. The influence of organisms on the composition of seawater. In The Sea (Hill, M. N., ed.), pp. 26-77. Wiley, New York.
[11] Rhee, G. Y., Gotham, I. J., 1981. The effect of environmental-factors on phytoplankton growth – temperature and the interactions of temperature with nutrient limitation.
Limnology and Oceanography 26, 635-648.
[12] Sakshaug, E., Olsen, Y., 1986. Nutrient status of phytoplankton blooms in Norwegian waters and algal strategies for nutrient competition. Canadian Journal of Fisheries and
Aquatic Sciences 43, 389-396.
[13] Smith, V. H., 1983. Low Nitrogen to Phosphorus Ratios Favor Dominance by Blue-Green Algae in Lake Phytoplankton. Science 221(4611): 669-671.
[14] Solorzano, L., Sharp, J. H. 1980. Determination of Total Dissolved Phosphorus and Particulate Phosphorus in Natural Waters. Limnology and Oceanography 25, 754-758. [15] Tapper, U. A. S., Malmqvist, K. G. 1991. Analysis, imaging, and modification of
microscopic specimens with accelerator. Analytical Chemistry 63, A715-A725.
[16] Tett, P., Heaney, S. I., Droop, M. R., 1985. The Redfield ratio and phytoplankton growth-rate. Journal of the Marine Biological Association of the United Kingdom 65, 487-504. [17] Utermöhl, H., 1958. Zur Vervollkomrnnung ver quantitativen Phytoplankton-Methodic.
Mitteilungen Internationale Vereinigung für Theoretische und Angewandte Limnologie 9,
1-38 (in German).
[18] Vahtera, E., Laamanen, M., Rintala, J. M., 2007. Use of different phosphorus sources by the bloom-forming cyanobacteria Aphanizomenon flos-aquae and Nodularia spumigena.
Aquatic Microbial Ecology 46, 225-237.
[19] Valderrama, J. C., 1995. Methods of Nutrient Analysis. In Manual on Harmful Marine
Microalgae (Hallegraeff, G. M., Anderson, D. M., Cembella, A. D., eds.), pp. 251-268. IOC and guides, UNESCO.
[20] Wallström, K., 1988. The occurrence of Aphanizomenon flos-aquae Cyanophyceae in a nutrient gradient in the Baltic. Kieler Meeresforschungen Sonderheft, 210-220.
[21] Wasmund, N., Nausch, G., Voss, M., 2012. Upwelling events may cause cyanobacteria blooms in the Baltic Sea. Journal of Marine Systems 90, 67-76.