ANALYSIS OF WASTE SORTING POPULATION
IN LATVIA BY USING SYSTEM DYNAMICS
MODELING
Elina Dace
Alise Berzina
Gatis Bazbauers
Riga Technical University, Latvia
ABSTRACT
Municipal waste can be sorted by using recycling waste container system, deposit system or other mechanisms. Three basic kinds of municipal waste – plastic, glass and paper/cardboard are collected in Latvia by using waste container system. The major part of it is utilized packaging – PET and glass bottles, cardboard boxes etc. It is necessary to ensure sorted material collection to provide recycling; however, the extent of sorting mostly depends on the willingness and possibilities of population to sort the waste. Therefore, willingness of population and possibilities of waste sorting, as well as the preconditions, which need to be fulfilled for motivating the non-sorting population to start sorting, are analyzed in the paper by using system dynamics modeling.
System dynamics is a modeling methodology, which permits an analyst to represent graphically and mathematically the interactions governing the dynamic behavior of complex socio-economic systems. The purpose of a system dynamics intervention is to identify, how structure and decision policies generate system behavior identified as problematic, so that structural and policy oriented solutions can be identified and implemented. In this paper, system dynamics modeling is used to understand and reflect the existing situation of packaging waste sorting and its motivating factors in order to develop the projections till year 2030 under conditions of the existing policies, i.e. the reference system. Then, economical and political instruments, which make improvements comparing to the reference system and solve the problem related to low sorting efficiency of population in Latvia, are studied by using the model.
KEYWORDS
Containers availability; Modeling; Natural resource tax; System dynamics; Waste sorting
1 INTRODUCTION
Municipal waste sorting system in Latvia was started in year 2001. Since then waste sorting containers have become more available to people living in cities. Besides that state government has introduced a natural resource tax for waste depositing in landfills, which
waste sorting population is rather small in Latvia and what are the factors involving people into sorting, the study by using system dynamics modeling was conducted.
2 SYSTEM DYNAMICS MODELING
System dynamics is a modeling methodology, which permits an analyst to represent graphically and mathematically the interactions governing the dynamic behavior of complex socio-economic systems [1]. The purpose of a system dynamics intervention is to identify, how structure and decision policies generate system behavior identified as problematic, so that structural and policy oriented solutions can be identified and implemented [2].
By using system dynamics methodology a model was developed in the computer program Powersim Constructor which was created by the Norwegian company “Powersim Software AS” (http://www.powersim.com/). Simulations are made for the period from the year 1998 until the year 2030 to be able to imitate the historic data and to predict future development under various scenarios by considering interactions between different factors, as well as changing the values of the main factors influencing efficiency of waste sorting.
3 PACKAGING WASTE MANAGEMENT IN LATVIA 3. 1 The existing situation
Centralization of waste dumps was considered to be the main task of waste management system of Latvia at the end of 1990’s and the beginning of this century, therefore a policy, where 500 small scale dumps were supposed to be replaced by 11 big scale landfill sites, was enforced [3]. In year 2000 an organization “Latvian Green Dot”, which is a member of the global Green Dot association “Packaging Recovery Organization Europe s.p.r.l.” was established, starting the implementation and development of waste sorting system in Latvia in 2001. Since then number of containers for separate collection of packaging waste has gradually increased reaching more than 7000 in 2008. The containers are of different sizes and configurations, and are mostly placed in the residential districts, companies and shopping centers. Also about 25 special sites for separate waste disposal have been set up in residential areas [4]. However, pollution caused by the increasing amount of waste which is annually generated is one of the most important environmental problems in Latvia – the amount of waste which is landfilled annually has doubled since 1998 (see Figure 1) and it continues to increase slowly in spite of the fact that the regeneration rate has increased from about 18% in 1998 to 41% in 2007 (regeneration by definition includes recycling and incineration with energy recovery) [5]. Therefore, it can be clearly seen that reuse, sorting and regeneration rates of the packaging waste are insufficient.
Population surveys show that almost 90% of the population is aware of the possibility of sorting the waste, but only 50% take action [6]. Latvia has legislative acts which set certain regeneration targets for packaging waste but the trends of waste accumulation clearly show that the existing policies cannot reduce the incremental rate of packaging waste agglomeration in landfill in order to stop the rate at least at the existing level. Latest statistical information shows that the regeneration target of 50% was not reached in the year 2007 (only 41% of packaging waste was regenerated) [5, 7].
Figure 1. Changes in generated packaging waste amount in Latvia [5, 8, 9]
Mostly there are containers available for separate paper and plastic waste, and less – for glass packaging. The sorted packaging waste after collection and pre-recycling (re-sorting, pressing) is sent to recycling plants in Latvia or abroad.
In Latvia PET bottles and other polymer (plastic) packaging, as well as paper packaging is recycled, since there are recycling plants for these packaging materials. Whereas there is no recycling plant for glass packaging waste in Latvia, therefore all the collected glass waste is transported for recycling outside Latvia. Quite often this factor creates a situation where glass packaging containers are not emptied, and it might be not a motivating factor for people sorting their household waste.
3.2 Availability of waste sorting containers
At the beginning of this year (2010) Institute of Energy Systems and Environment, Riga Technical University, made an inquiry on distances people are willing to make for disposing off their sorted houshold waste in the special containers or sites.
It was found in the study that total majority would not cover distance longer than one kilometer. Out of them 4/5 hold a view that the containers have to be placed next to their house. These results show that it may not be enough to inform people about the necessity and usefulness of waste sorting and recycling, and that a great influence on waste sorting effieciency is made by placing the containers near the houses.
In order to promote waste sorting, in our system dynamics model these results set a target of container availability as 1 (or 100%), which means that all people have containers next to their house. This target has to be accomplished in 20 years (2010 – 2030). Basing on the existing data of container availability, the initial value of population’s fraction, which has waste sorting containars available, was assumed to be 0.55. The rate, at which sorting is made available to people is calculated by Equation 1.
where:
R – rate, at which fraction of people, who have not containers available becomes a fraction of people, who have containers available, fraction/year;
T – target of population’s fraction with availability of containers; A – population’s fraction, which has waste sorting containars available; t – time to reach the target, years.
If to look at the results of this model (see Figure 2), it can be seen, that by year 2030 almost all the people (91%) will have waste sorting containers available.
It has been decided to introduce deposit system for glass bottles starting from year 2011, and for PET bottles – from year 2012. It has not been included in the model; therefore it does not influence the rate of waste sorting containers’ availability.
3.3 Natural resource tax for waste depositing in landfills
In 2006 state government of Latvia introduced into legislation a natural resource tax for waste depositing in landfills. Starting from year 2009 this tax has been gradually increased from about 1.00 EUR/t to 10.00 EUR/t in year 2012 (see Figure 3). It has not been decided yet, whether the tax rate will stay at the 2012-level or will it increase. However, it has been decided that after year 2012 it is going to be based on filling up of landfills or annual amount of waste deposited in landfills. This tax is not applicable to separately collected waste which goes to recycling plant. Therefore, it together with waste management costs influences only tariffs of unsorted waste collection and deposition in landfills.
3.4 Waste collection and deposition tariffs
In Latvia tariffs for waste deposition in landfills differ – these tariffs range from circa 15 to 28 EUR/t. In 2009 the average tariff in landfills of Latvia was around 22 EUR/t. In most landfills changes in tariffs for next years are not set, however it can be predicted, that tariffs will raise since investments in landfill construction have to be regained. Tariff raising will also be influenced by increase of natural resource tax.
Waste deposition tariffs differ significantly from collection tariffs which are directly felt by inhabitants. In Latvia waste collection tariffs are set by waste management companies, and in legislative acts there are no restrictions or maximum value regarding waste collection tariffs. The afore mentioned reason explains the major differences in tariffs – from 0.30 up to 10.00 EUR/month per inhabitant, however these differences are also dependent on whether one lives in apartment house or private house. Apartment house inhabitants have constant tariff per inhabitant per month, whereas tariffs for private house inhabitants are dependent on waste container size and take-away frequency.
2 000 2 010 2 020 2 030 0,0 0,2 0,4 0,6 0,8 1,0
Figure 2. Results of modeling waste sorting container availability till year 2030
Figure 3. Natural resource tax rates for disposal of waste legislated in the Natural Resources Tax Law (solid line) and assumed (dotted line) [10]
In the model natural resource tax (NRT) and landfills’ income (Ilandfill) together form waste
deposition tariff (Tdep), whereas it together with income of waste management companies
(IWMC) forms collection tariff (Tcol):
NRT I Tdep = landfill + (2) dep WMC col I T T = + (3)
Since natural resource tax rates gradually increase, waste collection tariffs also increase. In the model the existing natural resource tax rates till year 2012 are set by legislation. Afterwards they have been calculated depending on landfill filling, i.e. amount of deposited waste. It means that the more substantial is landfill filling, the more significant is influence on natural resource tax rates and further on waste deposition and collection tariffs. Projections of waste management tariffs show that in year 2030 the average deposition tariff will be about 58 EUR/t, whereas collection tariff – about 230 EUR/t, whish in average is 3.8 EUR/month per inhabitant. It is by 66% more than it is now.
• Whether inhabitant is motivated to sort by environmental or economical issues.
Depending on combination of the criteria, there are four different population groups formed: • “Sorting environmentalists” – inhabitants which sort waste and which are motivated by
non-economical considerations, i.e. inhabitants which sort waste because they are concerned with the state of surrounding environment, depletion of natural resources and suchlike factors, regardless of whether they get any economical benefit out of it or not, • “Sorting economists” – inhabitants which sort waste and which are motivated by
economical considerations, i.e. inhabitants which take part in waste sorting only if it is economically gainful for them,
Figure 4. Schema of transitions between population groups
• “Non-sorting environmentalists” – inhabitants who normally think of environmental aspects, nonetheless for some reason (e.g. not available waste sorting containers) have not started waste sorting yet. In Latvia lot of such inhabitants could be in rural settlements, where waste management system has not developed sufficiently yet,
• “Non-sorting population” – all other inhabitants which are irrelevant to the three above mentioned groups, i.e. mostly those inhabitants which do not sort waste even if they have such possibility (sorting containers are available) because they are unmotivated by environmental considerations, whereas economical incentives are not effective enough to raise interest in change of habits and waste sorting.
In the model inhabitants from all four population groups can pass from one group to another, as it is schematically shown in Figure 4. In the model an assumption was made that transitions from non-sorting environmentalists to sorting environmentalists are influenced by availability of separate waste collection containers, whereas transitions from non-sorters to sorting economists – by financial instruments, i.e. natural resource tax. The hypothesis of this study is that by raising natural resource tax for waste disposing in landfills, the population of sorting economists would rise since it is directly influenced by collection and deposition tariffs of unsorted waste.
The influence of waste collection tariff’s increase on non-sorting population has been described by normal distribution function. It describes lot of processes in the nature. In the model it has been chosen because of the reason that major part of economically motivated population will sort waste at average waste collection tariffs, whereas relatively small part is motivated by smaller or larger tariffs than the average value. If waste collection tariff is low (the minimum is 7 EUR/inh/year), there will be little number of sorting economists. By increasing the tariff, number of sorting economists will rapidly grow, however there still will be part which needs much higher tariff to start waste sorting. Results of the afore mentioned inquiry showed that 75% of non-sorting population would be motivated to start waste sorting if the existing tariffs would grow by up to 100%. The rest 25% would need the tariff growth
by 200%. Figure 5 shows the influence (effect) of waste collection tariff on economically motivated population. It has been calculated by using normal distribution function.
Year Effect 2 000 2 010 2 020 2 030 0,0 0,1 0,2 0,3 0,4 0,5
Figure 5. Effect of waste collection tariff on economically motivated population
A n nu al am o u n t o f w a s te, t /y ea r 2 000 2 010 2 020 2 030 50 100 150
Figure 6. Annual amount of generated packaging waste in base scenario and scenario A It can be seen from the graph that at the beginning when waste collection tariff is low, there is no or slight motivation for starting waste sorting. However, tariff increase causes motivation growth. Rapid effect on growth can be observed after year 2020, whereas levelling of the effect can not be seen till year 2030. It means that by that time still the waste collection tariffs in Latvia may not be high enough to motivate non-sorting population to start waste sorting. In that case other influencing factors should be evaluated.
5 RESULTS
There were two scenarios developed – base scenario and scenario A. The base scenario states that annnual amount of created waste is growing all the modeling period, i.e. from 1998 till
increase of materials by, for example, implementing ecodesign strategy in packaging production, thus reducing amount of packaging materials per product unit, and then continues to grow. Figure 6 ilustrates differences between the two scenarios regarding amount of annually generated packaging waste.
In scenario A, by decreasing the amount of annually generated waste, the landfill filling rate also decreases. Since it influences natural resource tax rates, then also waste collection and deposition tariffs are influenced (see Figure 7).
EU R /i n h /y e a r 2 000 2 010 2 020 2 030 10 15 20 25
Figure 7. Annual waste management costs in base scenario and scenario A
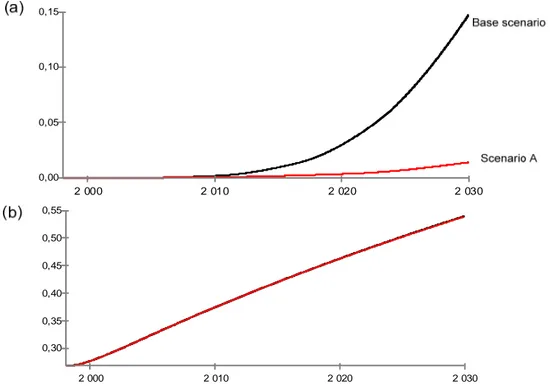
2 000 2 010 2 020 2 030 0,00 0,05 0,10 0,15 2 000 2 010 2 020 2 030 0,30 0,35 0,40 0,45 0,50 0,55
Figure 8. Fraction of waste sorting population in base scenario and scenario A: “sorting economists” (a) and “sorting environmentalists” (b)
Figure 7 shows that in case of scenario A annual waste management costs per inhabitant are lower than in base scenario due to slower increase of natural resource tax rate because of
lower amounts of annually generated waste. In result of decrease of waste management costs a motivation to sort household waste is decreesing as well, therefore in scenario A fraction of economically motivated population is significantly smaller than in the base scenario (see Figure 8 (a)).
In the model, group of sorting environmentalists are also influenced by landfill filling, but as it can be seen from Figure 8 (b) the landfill filling rates of both scenarios have not caused any differences. Figure 9 shows that total proportion of population which sorts household waste is higher in the base scenario. It also shows that total fraction of sorting population grows due to increase of population fraction which has waste sorting containers available.
2 000 2 010 2 020 2 030 0,2 0,4 0,6 0,8 1,0
Figure 9. Total fraction of waste sorting population, and fraction of population with waste sorting containers available
6 CONCLUSIONS
Results of the study indicate that by reduction of the amount of waste deposited annually in landfills due to various factors (ecodesign in product design stage, consumption decrease, waste sorting and recycling), the increase of natural resource tax rates will slow down or even stop since the tax is going to be calculated depending on landfill filling starting from year 2012. Lower tax and reduced amounts of waste will lower the waste management costs (collection and deposition tariffs) and thus also the motivation of economically motivated population to sort waste. At the same time major role in effective waste sorting plays availability of containers, as well as instructing people on how to sort household waste correctly. If containers are available to proportionaly higher number of people, the total waste sorting population grows faster just because of the ability to do it. That can also promote transition from “non-sorting population” to “non-sorting environmentalists” and further on to “sorting environmentalists”. In that case economical factors are of low importance.
On a government level waste management should be regulated by stating that setting up of waste sorting containers is mandatory measure for raising involvement of population in waste sorting actions. Waste management companies should provide waste sorting containers to each household they have a contract with. At the same time, determination of natural resource tax for depositing of waste in landfills should not be bounded to the landfill filling rate but
ACKNOWLEDGEMENTS
The study presented in this paper was possible due to the project “System thinking integration in environmental policy” (Nr. W7579) which was financed by European Economic Area and Norwegian Government Financial Instrument and the Republic of Latvia.
REFERENCES
[1] Vizayakumar, K., 1995. Environmental policy analysis: System dynamics approach (Chapter 20), V.K. Agnihotri, Public policy analysis and design, Concept Publishing Company: New Dehli, 311–329.
[2] Saleh, M., Oliva, R., Kampmann, C.E. & Davidsen, P.I., 2010. A comprehensive analytical approach for policy analysis of system dynamics models, European Journal of Operational Research. 203, 673–683.
[3] Kuplais G., Blumberga D., Dace E., 2010. System analysis for integration of landfill energy production in regional energy supply, Waste Management and the Environment V, WIT Press: Great Britain, 21 – 30.
[4] Latvijas Zalais punkts. Annual Report, 2006. Latvijas Zalais punkts: Riga, pp. 40. [5] Statistical report of generated packaging and amount of recovered resources in Latvia
according to resolution 2005/270/EKby European Commision, 2008. LISC: Riga. [6] Case study report on consumption patterns for inhabitants in cities of Valmiera (LV)
and Viljandi (EE), 2006. Baltic Environmental Forum.
[7] Regulations No 65 issued by the Cabinet of Ministers: Regulations Regarding Recovery Percentage Volume (Proportion) and Time Periods of All Packaging Waste, Procedures for the Registration and Submission of Reports and Model Forms Thereof, Requirements Which a Commercial Company Must Fulfil in Order for It to Be Registered as a Packaging Manager, Examples of the Application of the Packaging Definition Criteria and Exceptions in Relation to the Heavy Metal Content in Packaging. Latvijas Vestnesis, No 15 (3591), 16 January 2007.
[8] Pārskats par saražotā, importētā un izlietotā iepakojuma veidiem un resursu atgūšanas apjomu 2003. – 2007.gadā [Report of generated, imported and used packaging and amount of recovered resources in years 2003 – 2007] (In Latvian), 2003-2007. Latvian Environment, Geology and Meteorology Centre: Riga.
[9] Izlietotā iepakojuma apsaimniekošana [Management of packaging waste] (In Latvian), 2003. Latvijas Zalais punkts & ZAAO, ltd.: Riga.
![Figure 1. Changes in generated packaging waste amount in Latvia [5, 8, 9]](https://thumb-eu.123doks.com/thumbv2/5dokorg/3686541.45600/3.892.243.638.140.402/figure-changes-generated-packaging-waste-latvia.webp)
![Figure 3. Natural resource tax rates for disposal of waste legislated in the Natural Resources Tax Law (solid line) and assumed (dotted line) [10]](https://thumb-eu.123doks.com/thumbv2/5dokorg/3686541.45600/5.892.234.650.114.292/figure-natural-resource-disposal-legislated-natural-resources-assumed.webp)