http://www.diva-portal.org
Postprint
This is the accepted version of a paper published in Journal of Housing Economics. This paper has been peer-reviewed but does not include the final publisher proof-corrections or journal pagination.
Citation for the original published paper (version of record): Karpestam, P., Johansson, S. (2019)
Interest-only-mortgages and housing market fluctuations in Denmark
Journal of Housing Economics, 46: 101627
https://doi.org/10.1016/j.jhe.2019.03.004
Access to the published version may require subscription. N.B. When citing this work, cite the original published paper.
Permanent link to this version:
Abstract
Low repayment rates on mortgages have probably contributed to increased macroeconomic imbalances for several countries in recent years. The objective of this paper is to analyze how the introduction of interest-only-mortgages in 2003 affected the Danish housing market. Using quarterly data between 2001 and 2013, we analyze the long- and short-run relationships between mortgage repayments and three dependent variables: real house prices; the number of property sales; and mortgage debts in relation to disposable income. We find that including mortgage repayments in nominal housing payments improves the
econometric fit when predicting house prices and mortgages in relation to disposable incomes in both the long run and the short run, but not when modeling sales. Also, the conventional user cost variable either turn out insignificant or with the ”wrong” (i.e. positive) sign, while nominal housing payment, including
mortgage repayments, are significantly negative. However, some regression results are sensitive to specification and there are some indications of reversed causality issues. We therefore perform complementary event studies. The results of the event studies suggest that real house prices and the mortgage debt ratio increased considerably faster than otherwise expected between the introduction of introduction of interest-only-mortgages and the start of the financial crisis in 2007. Results are similar when using the results from our long- and short-run regressions to simulate the effects of introduction interest-only-mortgages. Our most conservative estimates suggest that the introduction of interest-only-mortgages raised real house prices and the mortgage debt ratio by about twenty and ten percent between 2003 and 2013, respectively. Our results raise questions of whether households base their decisions on real or nominal variables, actual costs, or cash flows, and if introduction of interest-only-mortgages have promoted housing affordability or have rather contributed to increased house prices and household debts.
Keywords: debts; house prices; mortgages; repayments; Denmark
1 Introduction
Conventional house price models do not include mortgage repayments among the explanatory variables (see e.g. Madsen, 2012; Thom, 1983). During the past 20 years, inflation-adjusted house prices and the stock of mortgage debts have increased rapidly in several countries. Several new financial innovations, such as interest-only mortgages and reduced mortgage repayment rates, were introduced before the outburst of the financial crisis in 2007 (Scanlon et al., 2008; European Central Bank, 2009). Many scholars have
emphasized that generous mortgage conditions may have contributed to increased macroeconomic
imbalances in several countries, including Australia, Belgium, Canada, Denmark, England, France, Greece, Iceland, Ireland, the Netherlands, Portugal, Spain, Italy, Sweden, and the US. It has been pointed out that mortgage conditions can affect housing markets considerably (André, 2010; Dam et al., 2011; Frisell and Yazdi, 2010; Muellbauer, 2012; Muellbauer et al., 2015; IMF, 2012; Mian and Sufi, 2010; 2012; Duca et al., 2011; Case, 2008). In addition, recent research indicates that periods with high debt levels and/or rapid growth of household debts are often succeeded by falling aggregate demand (IMF, 2012; Bornhorst and Ruiz-Arranz, 2013; Jordà et al., 2013; Mian and Sufi, 2010; 2012; Mian et al., 2013; Cecchetti et al., 2011). Furthermore, after 2007/2008, falling house prices were accompanied by tightening mortgage standards in several countries (see e.g. Scanlon et al., 2011; Duca et al., 2011; IMF, 2012; European Central Bank,1 2015,
p. 58). For example, Canada, Sweden and the Netherlands have recently sharpened regulations regarding mortgage amortization schemes (Schembri, 2014; De Vries and Burrows, 2013; Financial Supervisory Authority, 2017). Since then, a small but growing number of studies have been conducted on the effects of mortgage repayment rates on housing markets.
Cocco (2013) employed a panel of about 3 600 households in the UK between 1991 and 2008 and found that households are more likely to take interest-only mortgages the higher their level of education and expected future income, which implies that being able to temporarily abstain from mortgage repayments can facilitate consumption smoothing. Hull (2015) evaluated the upcoming mortgage repayment regulation in Sweden and predicted a small but negative effect on household debts.2 Forlati and Lambertini (2014) employed a
dynamic stochastic general equilibrium model and concluded that reduced mortgage repayments reduce the welfare of credit-constrained households in the long run because they inflate house prices and force
households to reduce their consumption and/or to work longer hours. Johansson et al. (2014) formulated a theoretical short-run model, building on the work by McQuinn and O’Reilly (2007), in which housing expenditures are assumed to be a constant fraction of households’ disposable income. They found that the effects of reduced mortgage repayments on house prices depend on other credit conditions such as the mortgage interest rate level, the loan-to-value (LTV) ratio, and whether households choose linear amortizations or annuity mortgages. Damen et al. (2016) developed a model in which house buyers are borrowing-constrained and house prices depend on house buyers’ overall ability to pay (ATP). They
discovered a co-integrating relationship between house prices and ATP for eight countries between 1980 and 2008. The results strongly indicated that ATP changes Granger cause house prices for all countries, while the researchers “only” found support for Granger causality from house prices to ATP for three countries.
Furthermore, the estimated elasticity of house prices from a change in ATP is close to one that suggests that, for example, increased interest rate deduction will translate into higher house prices with full effect, and will not promote housing affordability in the long run. Dam et al. (2011) employed Danish data to estimate an empirical house price model, assuming that mortgage borrowers made no repayments during the first year after buying, after interest-only mortgage loans were introduced in 2003. They concluded that including first-year payments—with mortgage repayments set to zero—improved their model, and that the introduction of deferred amortization mortgages can explain about 5 percent of the 38 percent increase in real house prices between 1999 and 2010. Recently, Allen et al. (2017) used a microsimulation model of mortgage demand in Canada. The Canadian government loosened the mortgage insurance qualifying rules between 2006 and 2007 by increasing the maximum allowable amortization period from 40 to 25 years and by increasing the maximum allowable LTV from 95 to 100 percent. In order to secure the long-term stability of the mortgage market mortgage lending rules where tightened 2008-2012 (Schembri, 2014). A key finding in Allen et al. 1 The bank lending survey (BLS) of the European Central Bank suggests that mortgage standards tightened for the European area in general, starting at the end of 2007.
2 Starting in June 2016, new mortgage borrowers with LTV ratios from 70–85 percent and from 50–70 percent must repay 2 percent and 1 percent of their mortgage each year, respectively.
(2017) is that households are more constrained by wealth constraints than monthly cash flows. However, Allen et al. (2017) also found that the average house buyer does not use lower amortization requirements to reduce their monthly mortgage expenses. Moreover, their microsimulation findings suggest that lower/tighter amortization requirements increased/decreased mortgage demand among first time house buyers. Madsen (2012) employed a panel of 18 OECD countries for the period from 1973–2008 and developed a model in which house prices are affected by nominal mortgage payments. He found that including nominal mortgage payment improved the econometric fit, while the conventional user cost variable turned out to be
insignificant and/or having the “wrong” (i.e. positive) sign. However, even though Madsen (2012) merged repayment rates with other nominal housing payments in his theoretical model, he was unable to include repayment rates when testing the model empirically, presumably due to lack of data. Similarly, Damen et al. (2016) “construct weights for the different mortgage types based on country reports or academic articles and interpolate for unknown periods.”3 This is in line with our observations that the ability to empirically assess
how housing markets are affected by changing mortgage repayment rates is limited by a lack of data at the aggregated level. In fact, we are not aware of any study that has employed actual repayment rates and empirically estimated their effects on housing markets at the aggregated level in recent years. Moreover, until now, most studies have been concerned with the effects on house prices, and do not examine the effects on sales, which are typically more volatile and responsive to changes in housing demand than are prices (see Figures 1–2 in Section 2). Studies on the effects of repayment rates on household debts are also rare. Thus, our understanding of how changes in cash flows for existing as well as potential home owners affect housing markets and the economy, even when real user costs are constant, is incomplete.
The objective of this paper is to analyze how the introduction of interest-only mortgages in 2003 affected the Danish housing market. We employ data from 2001–2013 and estimate ordinary least squares (OLS)
regressions to analyze how nominal mortgage payments (including actual mortgage repayments to mortgage credit institutes, (MCIs), which grant the majority of all mortgages) relate to a set of three dependent
variables: (1) real house prices, (2) the number of property sales, and (3) household mortgage debts in relation to disposable incomes. We proceed as follows: First, we compare statistical information criteria to investigate whether including mortgage repayments in nominal housing payments improves the econometric fit of our OLS regressions. Second, we test whether repayments are statistically different from the remaining nominal housing payments. Third, we follow Madsen (2012) and include a measure of real user costs alongside nominal mortgage payments as explanatory variables, in order to investigate which variable is more important in explaining the movements of the dependent variables. Our study is also related to Damen et al. (2016) who found a stronger relationship between house buyers’ overall ability to pay and house prices than between real user costs and house prices for seven out of eight countries. Our analysis can contribute to an increased understanding regarding whether (1) agents make decisions about housing consumption based on real (user) costs or on nominal mortgage payments/costs; and (2) whether mortgage repayments (which are a kind of expenditure but not a cost) belong to the set of housing expenditures that affect the behavior of housing consumers.
We model the long run and estimate the relationships between the dependent and explanatory variables in level form and then estimate the short-run determinants by employing error-correction models. The second step might provide insights into the reaction speeds of the dependent variables with respect to changes in housing payments. We use our regression results to simulate the effects of the introduction of mortgage-only loans in 2003 and the dynamic impact of a permanent one-time shock of nominal housing payments.
Furthermore, we complement our conventional regressions and perform event studies because we cannot guarantee causal effects of changes in repayment rates on the dependent variables. The purpose of our event study is to investigate whether our dependent variables developed in a non-normal fashion in connection to the introduction of interest-only-mortgages.
The rest of this paper is organized as follows: Sections 2 and 3 describe recent housing market developments in Denmark and explain why we should pay attention to mortgage repayments. Section 4 describes the model. Empirical results are in Section 5, and Section 6 concludes the paper.
2
Background
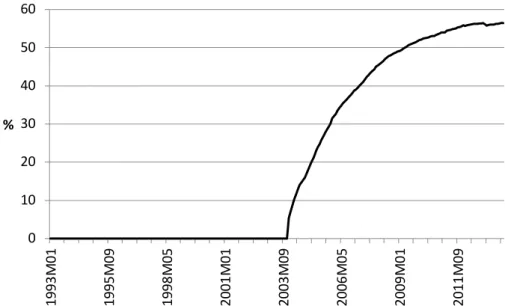
Figures 1 and 2 show how real house prices, the number of property sales, and the total mortgage debts in relation to disposable income developed between 1994 and 2013. House prices and household debts increased dramatically before the financial crisis in 2007/2008. In addition, the number of property sales peaked around 2006, although these did not increase as dramatically as did the prices and debts prior to the crisis. The introduction of interest-only mortgages in 2003 was succeeded by accelerating growth rates of house prices and household mortgage debts (Figures 1 and 2). Between the first quarter in 2003 and the third quarter in 2007, the ratio of total mortgages to disposable income grew from 1.29 to about 1.86. Real house prices increased by 54 percent during the same period and, as seen in Figure 3, the portion of deferred amortization mortgages out of all mortgages granted by MCIs (we exclude banks because they do not offer deferred mortgages) increased from zero to almost 50 percent between 2003 and 2007.4 However, after
2007/2008, house prices and the number of property sales decreased and the growth rate of mortgage debts slowed down.
Figure 1. House prices and property sales, 1994-2013.
Source: Statistics Denmark. House prices have been deflated using the consumer price index (CPI) and are in 2013 prices.
4 According to Jakob Kongsgaard Olsson at Realkreditrådet (2016-05-20), mortgages with deferred amortization for 30 years were introduced in 2007. These mortgages only apply to loans with a maximum LTV ratio of 75 percent and have been used sparsely.
0 5000 10000 15000 20000 25000 30000 35000 0 500000 1000000 1500000 2000000 2500000 1994 M 03 1996 M 03 1998 M 03 2000 M 03 2002 M 03 2004 M 03 2006 M 03 2008 M 03 2010 M 03 2012 M 03 Sales Real house prices (DKK)
Figure 2. Households mortgage debts in relation to disposable income, 1994-2013.
Source: Statistics Denmark and authors’ calculations.
Traditionally, Danish households have financed the lion’s share of a house purchase by borrowing from an MCI. Before 2003, mortgages granted by MCIs were normally designed as 30 year annuity loans, and borrowers paid a fixed amount to their creditors each month. The essential feature of an annuity mortgage is keeping the annual nominal mortgage expenditure (including interest rates and repayments) fixed over the entire duration of the loan; this means that the repayments will successively increase in value as the loan approaches maturity because the accumulated repayments result in reduced interest rate payments. In
Denmark, mortgages granted by MCIs have a maximum LTV ratio of 80 percent; households either use their own savings or borrow from a bank to come up with the remaining 20 percent (Scanlon et al., 2011).5 To the
best of our knowledge, there are no formal requirements on repayments on bank mortgages6 but they have
traditionally been repaid within 10 years to 30 years7and their associated lending rates are normally substantially higher8 than those offered by MCIs, which may explain why the majority of mortgages are
granted by MCIs. However, choosing an interest-only-mortgage is a voluntary agreement between the MCI and the customer.
A number of reforms have been introduced during the past 20 years. In 1996, MCIs started to issue
mortgages with adjustable interest rates. The housing tax was frozen in 2002. In October 2003, regulations were changed and MCIs were then allowed to issue “interest-only mortgages.” Starting in October 2003, a mortgage can be exempted from repayments for a period of up to 10 years, after which the mortgage can be refinanced/renegotiated (Bocian et al., 2014).9 There is a break in the data after 2013. However, according to
the new data series, the share of interest-only-mortgages issued by MCIs have decreased from about 56 % to about 48 % percent between 2013 and 2017, which indicates that MCI borrowers have started to repay their
5 As of November 1, 2015, borrowers are only allowed to borrow up to 15 percent from banks, and 5 percent down payment is required. Source: Email correspondence with Jakob Kongsgaard Olsson at Realkreditraadet.
6 Source: Email correspondence with Rune Egstrup at Danmarks Nationalbank (2013-02-07), Banks offer a variety of mortgage products which makes it hard to say something in general. And according to Jørn Andersen at Finanstilsynet (email correspondence 2017-12-20) “Lending requirements reflected the individual credit policies of the individual banks”.
7 Source: Email correspondence with Jakob Kongsgaard Olsson at Realkreditraadet.
8 On average, the interest rates offered by MCIs and banks were 4.2 and 6.1 percent, respectively, between 2003 and 2013. Source: Statistics Denmark and the authors’ calculations.
9 According to Bocian et al. (2014), borrowers have three options when renegotiating their loans: (i) amortize within the remaining maturity, that is, within 20 years; (ii) refinance the loan to a 30 year annuity mortgage; or (iii) refinance the loan to a new interest-only mortgage with a maximum LTV of 80 percent.
0 0,5 1 1,5 2 2,5 1994 M 03 1996 M 03 1998 M 03 2000 M 03 2002 M 03 2004 M 03 2006 M 03 2008 M 03 2010 M 03 2012 M 03 Mortgage debts/ disposable income
mortgages at a faster rate since 201310. Yet, a substantial share (48 %) are still classified as
interest-only-mortgages.
Interest-only mortgages were partially introduced to make housing more affordable (Økonomi- og
Erhvervsministeriet, 2003). For example, they permit other more expensive loans to be repaid at a faster rate, which should positively affect housing investments and retirement savings. Furthermore, changing life circumstances, such as a divorce or losing a job, may require individual-level adjustments that are more easily realized if one can choose to temporarily abstain from amortizing (Realkreditrådet, 2011a). There is a possibility that deferred amortizations on MCI mortgages have resulted in larger repayments on bank mortgages.11 However, as can be seen in Figure 2, the majority of mortgages are granted by MCIs; thus, it is
not probable than an increased repayment rate on bank loans has been able to fully compensate for reduced installments on MCI mortgages.12 Consequently, as the repayment rate on MCI mortgages has declined, it is
likely that the repayment rate on the total mortgage stock has decreased as well.
Figure 3 shows how the portion of interest-only mortgages granted by MCIs increased after 2003, and Figure 4 shows the average repayment rates on MCI mortgages.
Figure 3. The portion of deferred mortgages granted by mortgage credit institutes (MCIs)
Source: Statistics Denmark and the authors’ calculations.
10 Source: Statistics Denmark and the authors’ calculations.
11 In a survey by Realkreditraadet (2011a), 30 percent of respondents stated that they used the cash flow from a deferred amortization mortgage to repay other debts (Realkreditraadet, 2011a).
12 For example, assuming the same home buyer before and after 2003: A home buyer choosing to defer amortizations on his MCI mortgage would need to increase the repayment rate on a bank loan from 5 percent to about 18 percent, assuming that he reduces the repayment rate on MCI mortgages from 3.3 to zero percent, in order to maintain the same repayment rate before and after the reform. (This assumes an LTV of 100 percent, with 80 percent coming from MCIs and 20 percent from banks.) Source: Authors’ calculations.
0 10 20 30 40 50 60 1993 M 01 1995 M 09 1998 M 05 2001 M 01 2003 M 09 2006 M 05 2009 M 01 2011 M 09 %
Figure 4. Repayment rates and after tax mortgage interest rates on loans granted by MCIs.
Source: Statistics Denmark and the authors’ calculations.
Falling mortgage interest rates during the 2000s (Figure 4) probably stimulated Danish households to defer amortizations on their mortgages. We lack data regarding the extent to which the reduced repayment rates were due either to new homeowners choosing not to amortize or to existing homeowners choosing to
refinance their loans. The Danish mortgage system has no prepayment penalty and a borrower can benefit by refinancing a mortgage. “Mortgage rescheduling” is common and will reset the maturity to full length.13 According to Madsen and Rasmussen (2013), a widely used ruled of thumb is that a borrower should refinance a mortgage if the interest rate falls by 2 percentage points. In the mid-2000s, mortgage refinancing increased (Madsen and Rasmussen, 2013), which may be the result of many home owners choosing to defer amortizations. Figure 5 shows that, until mid-2006, the increase of the value of deferred mortgages was larger than the value of new mortgages or the net increase of total mortgages. This development was reversed in 2008, after which new mortgages started to exceed the increase of deferred amortization mortgages. By the end of 2012, the value of the total mortgage stock started to increase faster than the total value of deferred mortgages. Overall, Figure 5 indicates that the majority of new mortgages and a large portion of refinanced mortgages after 2003 were, in fact, deferred amortization mortgages.
13 Jakob Kongsgaard Olsson at Realkreditrådet, email, 2016-05-20. 0,00 0,50 1,00 1,50 2,00 2,50 3,00 3,50 4,00 4,50 200 2M12 200 3M12 200 4M12 200 5M12 200 6M12 200 7M12 200 8M12 200 9M12 201 0M12 201 1M12 201 2M12
Repayments, total mortgages granted by MCIs Repayments, annuity mortgages granted by MCIs
Figure 5. Deferred amortization mortgages in relation to flows of mortgages
Source: Statistics Denmark and the authors’ calculations.
3
Why should we care about mortgage repayments?
Mortgage repayment rates will affect the housing market if they affect the total mortgage stock, which means that they must affect credit supply and/or credit demand. Dam et al. (2011) and Madsen (2012) discuss a number of reasons why one should expect mortgage repayment to affect the housing market: (1) Liquidity-constrained households are not able to smooth consumption over time, which means that they may use reduced repayments rates as a way of borrowing more. (2) Households are short-sighted, and focus strongly on first-year payments, which means that they do not acknowledge that amortizing less today indicates higher interest rate payments later; in addition, they ignore the possibility that future interest rates may rise. (3) When home owners can refinance their loans and defer amortizations, it may reduce the housing supply because lower nominal housing payments/costs reduce the incentive to sell. (4) House buyers (and/or lenders) are irrational and suffer from money illusion, which means that they attach a greater weight to nominal expenditures than they do to real costs.
In addition to the studies mentioned in Section 1, which focus specifically on repayment rates, some additional evidence provides reason to suspect that repayment rates affect the housing market (see Madsen (2012) for a more detailed review). Miles (2003), Rozbach (2004), and Shefrin and Thaler (1988) find evidence of short-sighted and irrational consumers who focus strongly on initial repayment rates, and of consumers adhering to “mental accounting14.” Several studies have also confirmed the existence of
money/inflation illusion and the fact that consumers do not fully understand inflation (see e.g. Brunnermeier and Juliard, 2008; OECD, 2005; Shiller, 1996). However, in a Danish context, Realkreditrådet (2011b) claims that creditors demand that borrowers must always be able to serve a 30 year annuity mortgage, regardless of what amortization scheme they choose. If true, this implies that deferred amortizations can only affect the housing market if they affect credit demand. In addition, a survey performed by Realkreditrådet (2011c) suggests that the effects of changed repayment rates on credit demand may be weak as well. Of the respondents who chose to defer amortizations, 15 percent agreed with the statement that they had taken a larger mortgage because of reduced nominal housing expenditures. However, a low self-reported willingness to take on larger debts does not rule out the scenario that reduced repayment rates might have pushed house prices upward and forced house buyers to borrow more. A house buyer who perceives herself as a price taker may not realize that she is forced to bid a higher price than she would have if interest-only mortgages had not 14 The concept was first proposed by Richard Thaler and refers to the subjective process through which individuals base their decisions to consume or to save.
0,0 0,5 1,0 1,5 2,0 2,5 3,0 3,5 200 3M12 200 5M12 200 7M12 200 9M12 201 1M12
Shar
e
of
m
or
tg
ag
e
flo
w
Δ Deferred amortization mortgages / Δ Total mortgage stock
Δ Deferred amortization mortgages / New and refinanced mortgages Δ Deferred amortization mortgages / New mortgages
been introduced in the first place. This is because other potential buyers may use the opportunity to reduce their repayment rates in order to be able to offer a higher price, which may particularly be the case when there are many buyers in relation to the number of sellers. Hence, the behavior of a small percentage of all potential house buyers may have a very large impact on the macroeconomic outcome (see e.g. Piazessi and Schneider, 2009). An objective of this paper is to generate an increased understanding regarding these matters.
4
Methodology
4.1. Error Correction Models
In line with previous research (see e.g. de Wit et al., 2013; Hort, 2000), we model real house prices and the number of property sales as a function of set of common fundamental variables. In addition, we model mortgage debts in relation to disposable income with a basic set of common explanatory variables. There are several reasons why we should expect that property sales, house prices, and mortgage debts are related, some of which are discussed in de Wit et al. (2013). For example: (1) Higher prices and more sales increase the value of newly granted mortgages (the average LTV ratio of housing market entrants should exceed the average LTV ratio of sellers, which means that more sales should have a positive impact on the value of total mortgages). (2) An increased demand, such as reduced mortgage costs allowing new buyers to enter the housing market, can result in both higher prices and more sales. (3) Asymmetric information, where supply information is publicly available but information about the demand side is not, means that an increase in the number of buyers may have an immediate impact on the number of sales, while prices adjust gradually. This is because sellers need time to adjust their reservation prices when knowledge about current housing demand is limited. (4) Increased housing demand, for example due to increased incomes, allows existing
homeowners to upgrade to a “better” house; this means that sales and prices are determined simultaneously by a set of common variables. (5) In addition, loss aversion among homeowners may explain why there might be a positive price-volume correlation when housing demand is falling, and why the number of sales will decrease before the prices do. Altogether, these five aspects imply that a set of common factors determine prices, sales, and mortgage debts. The majority of studies that have looked into the correlation between sales and prices have found that changes in sales precede price changes in countries such as Sweden (Hort, 2000), Hawaii (Miller and Sklarz, 1986), and the UK (Andrew and Meen, 2003), whereas price adjustments are slower. Studies also typically find that sales are more strongly affected by a shock to
fundamentals than are prices (see e.g. Clayton et al., 2010). However, contradictory findings also exist. Stein (1995) finds that price changes precede changes in sales in the US. Follain and Velz (1995) find a negative relationship between sales and price employing a system of four equations. We are not aware of any study that has simultaneously analyzed property sales and house prices in Denmark. However, as seen in Figure 1, between 2005 and 2008, the number of property sales started to fall before the house prices did, and the relative decline in the number of property sales was stronger than the fall in housing prices, which is in line with the results of most previous studies.
We estimate six equations. Equations 1-3 estimate how real house prices, the number of real property sales, and mortgage debts in relation to disposable incomes covary with the explanatory variables in the long run. Equations 4-6 are first difference and are thus estimated to nvestigate how the dependent variables correlate with the explanatory variables in the short run. Consequently, equations 1-3 include all variables in level form, implying that the estimated relationships may be spurious if some variables contain unit roots and if they are not co-integrated (Yule, 1926; Granger and Newbold, 1974; Harris and Sollis, 2005), although it is important to note that causal relationships may exist even if there is no support for co-integration (see e.g. Burzynska et al., 2016). Equations 4-6 involves estimating error-correction models; consequently, all variables are transformed to first differences, and we add the lagged residuals from the “level regressions” to the set of explanatory variables (Engle and Granger, 1987; Harris and Sollis, 2005). This second step can yield insights into the reaction speeds of the dependent variables due to changes in housing expenditures. Altogether, we estimate six equations:
Pt = X1Β1 + ε1t (1)
DEBTSt = X3Β3 + ε3t (3)
∆Pt = ∆XΒ4 + ε4t + ϒ4 ε1t-1 (4)
∆TRt = ∆X1Β5 +ε5t + ϒ5 ε2t-1 (5)
∆DEBTSt = ∆X3Β6 + ε6t + ϒ5 ε3t-1 (6)
where t indicates time period. We use quarterly data between the third quarter in 2001 and the third quarter in 2013 because repayments to MCIs are available for that period. Our main objective is to analyze how repayment rates, which are included in total housing expenditures, affect real house prices (Pt), the number
of property sales (Tt) and the total mortgages in relation to disposable incomes (DEBTSt). X1–X6 are n·mi
matrices of explanatory variables (where n is the number of time periods and mi is the number of explanatory variables of equation i). Β1–Β6 are the m·1 row vectors with the associated parameter estimates of the
explanatory variables in Equations 1–6. ε1–ε6 are the residuals. Equations 4–6 are error-correction models and represent the short run, which means that they have lagged residuals from Equations 1–3 (ε1t–1–ε3t–1) on
the right-hand side, in order to control for the speed at which the dependent variables revert back to the long-run equilibrium.
In line with conventional studies, where house prices in a steady state are derived from the condition that the marginal cost of housing equals the value that the housing services provide (see e.g. Poterba, 1984; Hort, 1998; Dam et al., 2011; Oikarinen, 2009), we include real user costs as one of the explanatory variables. However, due to the objective of this paper, we need to consider expenditures that are not costs, although conventional house price models are primarily concerned with the associated costs of living. Consequently, we follow Madsen (2012) and include measures of nominal housing payments along with our measure of user costs. In comparison with Madsen (2012), our paper contributes by including mortgage repayments in nominal housing payments when estimating the empirical regression.
There are some essential differences between real user costs and nominal housing payments: (1) Real user costs are usually defined as the sum of interest rates (net of tax), the property tax, depreciation, and operating costs minus the expected house price appreciation and expected (consumer price) inflation, whereas nominal housing payments exclude expectations. (2) The two variables can include different measures of the interest rate. The full cost of capital should include the opportunity of the cost of investing in one unit of capital; consequently, we follow Dam et al. (2011) and include the interest rate on 30 year mortgage bonds in real user costs.15 In contrast, we include an approximation of the average interest rate on mortgages of all
durations (net of tax) in our measure of nominal housing payments.16 This also means that we are deducting
the capital tax from the user costs, but taking the mortgage interest rate deductions from nominal housing payments (see Table 1). (3) Mortgage repayments can/should be included in nominal housing payments but not in real user costs (as repayments are not costs).
Some elements of real user costs and nominal housing payments are unknown and must be approximated: (1) Data on mortgage repayments to MCIs is available between 2001 and 2013. However, there is no data on repayments to banks. Therefore, we calculate two measures on mortgage repayment rates (REPAY1 and REPAY2). Mortgage repayments to MCIs only includes planned repayment rates on mortgages granted by MCIs. These include repayments on new mortgages and old mortgages, which means that our estimated relationship between repayments may capture both supply-side, and demand side effects. For instance, reduced repayments on old mortgages (through refinancing) may result in higher house prices through a reduced supply while reduced repayments on new mortgages is expected to raise household demand. In the second measure (REPAY2), we have used available information to approximate bank repayments, which we have merged with repayments to MCIs (Table 1). To see which measure is preferable, we estimate Equations 1–6 for both measures, and compare their respective information criteria. However, although the lack of data on bank repayments might result in some bias of the parameter estimate, recall from Figure 2 that the majority of all mortgages are granted by MCIs. (2) We lack reliable data on expectations; thus, we assume that expected house price appreciation and expected inflation follow an autoregressive process with 4
15 Our series refer to bonds granted by MCIs.
16 However, we also performed a sensitivity check and included the average mortgage interest rate in both nominal housing payments and user costs when running the regressions; there was virtually no impact on the results.
lags (see Table 1), which we estimate using OLS regressions. Although theory often assumes that agents possess rational expectations with perfect foresight (see e.g. Hort, 1998), it has often been acknowledged that expectations are probably better described as backward-looking (see e.g. Dipasquale and Wheaton, 1994; André, 2010; Muellbauer, 2012). (3) Depreciation and operating costs are typically assumed to be a constant fraction of the value of the house (see e.g. Hort, 1998; Oikarinen, 2012); similar to Dam et al. (2011), we set this constant to zero. (4) Data on the average mortgage interest rate (in nominal housing payments) is only available from 2003, but we need values from 2001 in order to be able to use estimate regressions for the full period for which mortgage repayments to MCIs are available. We approximate the mortgage interest rate by regressing the average mortgage interest rate on the rate of interests on 30 year real credit bonds and unit mortgage bonds (see Figure 6 to compare the predicted value with the actual value).
We mainly include common control variables. In standard models (see e.g. Hort, 1998), house prices are often expressed as a function of per capita incomes, population, and housing supply (approximated with the housing stock). As suggested by Dam et al. (2011), we include total disposable incomes (which are a function of per capita incomes and population) in relation to the housing stock (Y/Dwell). This reduces collinearity issues, as population is highly correlated with the housing stock and total disposable incomes relate to both per capita incomes and population. Consequently, the obtained parameter estimate associated with Y/Dwell shows the estimated impact of an income increase on housing prices without any supply response. Furthermore, we include periodical time trends (PREQ22008 [Equations 1 and 3] and
POSTQ32005 [Equation 2]) because visual observations suggest that trend effects may exist for some sub periods (see Figures 1–3). We also include the percentage gross increase of the existing housing stock through new construction (NEW) because new construction is included in average housing prices and in the number of property sales. NEW refers to completed dwellings. We expect a positive correlation between new construction and all the dependent variables. We elaborate between including current and lagged values of NEW. Also, in Equation 3, we include the share of homeowners (OWN) of the total population, as an increased portion of homeowners should increase the number of households that need mortgages. We include lags of dependent variables (Pt-1, TRt-1, DEBTt-1), which may push dynamic terms out of the
residual and reduce problems with autocorrelation, particularly in a finite sample such as ours. It is
recommended to choose a generous lag length (see e.g. Harris and Sollis, 2005). However, choosing many lags reduces the number of degrees of freedom and we have few observations. Thus, we employ a
parsimonious approach and start with one lag and add extra lags one at a time until the information criteria do not improve. Thus, we employ one lag in Equations 1 and 3, and two lags in Equation 2. Furthermore, we employ only one lag of the dependent variables in Equations 4–6.17 All variables are defined in Table 1.
Including lagged dependent variables means that we are estimating dynamic models. An implication of including lagged dependent variables is that the long-run relationships between the remaining explanatory variables and the independent variables are not given by the parameter estimates of the associated variables. For instance, the long-run relationship between repayments and some dependent variable equals β1/(1 – β2),
where β1 and β2 are, respectively, the estimated regression coefficients for repayments and the lagged
dependent variable itself18. This is important to remember when comparing regression coefficients from
different estimations where lagged dependent variables have been both included and excluded.
17 If we employ more than one lag in Equations 4–6, we find that any shock that causes the dependent variables to deviate from the long-run equilibrium also causes the dependent variables to never converge toward the long-run equilibrium again. Instead, oscillations around the long-run level amplify over time, which is not the case when only one lag is included. If we include only one lag, oscillations gradually become smaller and eventually converge at the long-run level. See for example Figures 10–12.
18. For more complex dynamic processes with more than one lag, the long-run relationship becomes ∑ ϒi/(1-∑ α i), where i represents lag order. See e.g. Harris and Sollis (2005).
Table 1. Definition of variables
Variable Description
P The natural logarithm of average real house prices in period t.
Deflated with the CPI. Base period = 2013. Housing prices are computed as the weighted average of sales prices for houses, apartments, and weekend cottages.
T The natural logarithm of the number of total real property sales,
including sales of houses, apartments, and weekend cottages. DEBTS The natural logarithm of household mortgage debts in relation to
disposable incomes.
t Property tax.
REPAY1 Annual planned repayments rates on all current mortgages granted by MCIs. Unplanned repayments e.g. repayments of paying off ones loans during sales are not included.
REPAY2 Approximated annual repayment rate on the current total mortgage stock. For a motivation of our assumptions, see discussion in Section 2. Total repayment rate=(Bank Repayments + MCI Repayments)/(Total bank mortgages + Total MCI mortgages). We assume an LTV equal to 100 percent, that house owners borrow 80 percent from MCIs and the remaining 20 percent from banks, and that 30 percent of the interest-only MCI mortgage stock is used to repay bank loans faster (i.e. in 10 years (see discussion in Section 2)). Remaining bank loans are assumed to be repaid in 20 years. Thus, we approximate the value of total bank repayments with the following formula: Value interest-only-MCI
mortgages×0.3×0.25×0.1 + (Total bank mortgages – value interest-only MCI mortgages×0.3×0.25)×0.05.
s Interest rate deductions on mortgage loans.
Capital tax Tax on capital gains.
r Weighted approximated average mortgage interest rate on all
mortgages (including both new and old mortgages and mortgages granted by banks and MCIs). Because we lack data on the mortgage interest rate for the full period (2001–2013), it has been approximated by regressing on 30 year real credit bonds and unit mortgage bonds (which are both available for a longer time period) for the period 2003–2013. We then replaced actual values with the predicted values for the full period.
r30 Interest rate on 30 year mortgage bonds granted by mortgage
credit institutes.
HEA1 Total housing payments measure 1: r×(1 – s) + t + REPAY1.
HEA2 Total housing payments measure 2: 1 r×(1 – s) + t + REPAY2.
HE Housing payments excluding mortgage repayments = r∙(1 – s) + t
EXP The sum of approximated expected annual inflation and expected
annual house price appreciation.
UC Real user cost: r30×(1 – Capital tax) + t-exp
Y/Dwell The natural logarithm of household disposable incomes deflated by the CPI in relation to the total housing stock. The housing stock has been interpolated from annual data.
PREQ22008 Time trend variable, set to zero after the first quarter in 2008. POSTQ32005 Time trend variable, set to zero before the fourth quarter in 2005. NEW Relative gross increase of housing stock through new construction
= ln(new dwellings + old dwellingst-1) – ln(old dwellingst-1)
OWN The share of homeowners in the Danish population.
Q1 Dummy variable indicating the first quarter of the year.
Q3 Dummy variable indicating the third quarter of the year.
Variables used in robustness check
∆PUS Annual real house price growth in the US. First difference of the natural logarithm of real house prices in the U.S.
∆PDen Annual real house price growth in Denmark. First difference of the natural logarithm of real house prices in the U.S.
OTHER DEBTS The natural logarithm of household non-mortgage debts in relation to disposable incomes.
Source: Statistics Denmark. Danmarks Nationalbank, the Danish Customs and Tax Administration and OECD.
4.2. Dealing with endogenity
Because we lack suitable instrument variables for mortgage repayments, our analysis in 5.1 does not guarantee causal effects of repayments on our dependent variables. Endogeneity can arise (amongst other things) due to reversed causality or omitted variables. Several studies have established a two-way relationship between credit and house prices (see Anundsen and Jensen, 2013; Brissimis, and Vlassopoulos, 2009; Fitzpatrick and McQuinn, 2007). Consequently, there may be a two-way relationship between house prices and factors that affect credit demand and/or credit supply. For instance, increased house prices means that new homeowners must take on larger debts and that the increased financial burden may result in lower repayment rates. Furthermore, existing homeowners may have lower incentives to repay their debts as their wealth is increasing. However, the opposite effect may also emerge if households feel urged to repay at a faster rate as their debts are increasing. We therefore apply the Toda and Yamamota (1995) variant of the Granger non-causality on our level regressions and the traditional Granger causality test on our difference regressions. The modified Wald test proposed by Toda and Yamamota addresses issues about non-stationarity and cointegration between series, which are ignored by the ordinary granger causality test. We report the results from these tests in appendix 1. In our level regressions, the tests suggest that the causalities are working in the “right” direction i.e. that nominal housing payments granger cause our dependent variables but not the other way around in our level regressions. This is in line with the results in Damen et al. (2016) who found that that ATP (ability to pay) changes Granger cause house prices for all eight countries in their study, while the researchers “only” found support for Granger causality from house prices to ATP for three countries. However, when estimating the difference regressions, we find some indications that mortgage debts and property sales granger cause nominal housing payments (and repayments), while we still find that “causality” goes in the “right” direction when modeling house prices.
To skirt the potential endogeneity problem we complement our regressions described in section 4.1 and perform “event studies”. The objective of an event study is to identify whether there have been abnormal developments of some variable after a particular event e.g. whether stock returns have been unusually low or high due to news announcements. We use an event study to investigate whether there was an abnormal development of our three dependent variables after the introduction of interest-only-mortgages in the final quarter of 2003. The basic idea behind an event study is simple and straightforward; obtain estimates of the “normal/expected developments” of your variable of interest (e.g. change of house prices) and compare to the actual developments for some period in connection to the event. Then obtain the difference between actual and expected developments and test whether this difference is significantly different from zero19.
Usually, one obtains estimates of the normal/expected developments using linear regression analysis based on data for some time period before the event, leaving a window before and after the event, and then obtaining out-of-sample predictions of the “normal” development for some period in connection to the event.
19 We use the procedure explained in Kothari and Warner (2007). The test-statistic is obtained by dividing the sum of abnormal developments by the estimated standard error of normal returns. The test statistic is assumed to follow a unit normal distribution. The performed procedure is available on request.
5
Empirical results
5.1 Regression results
We have estimated both level regressions and difference regressions. First differences, however, usually exhibit more variation and may therefore suffer less from collinearity issues than level regressions. In this section, we focus on the results from the difference regressions (Equations 4–6), while results from the level regressions (equations 1-3) are shortly commented. Regressions results from the level regressions are in table A7 in the appendix. As explained in section 4.1., we added the error correction term (lagged residuals) that was obtained from the level regressions (long-run regressions) in order to control for the speed of adjustment towards the long-run equilibrium. An error-correction model which incorporates the long-run equilibrium into the difference regressions relies on a cointegrating relationship between the the independent and dependent variables. If they are not cointegrated, any relationship between non-stationary variables may be spurious (Harris and Sollis, 2005). We have performed Augmented Dickey-Fuller and Phillips-Perron tests for non-stationarity and co-integration. Results indicate that our level variables are non-stationary but that that the residuals from our level regressions are stationary, supporting cointegration. Consequently, we can proceed and estimate error correction models. The results from testing stationarity and cointegration tests are in the appendix (tables A3 and A7, appendix).
We estimate our difference regressions in four stages. In each stage, we compare the information criterion of regressions where repayments are merged with ((∆HEA1t) and separated from nominal housing payments
∆HE1t- We then compare the econometric fit of each regression and test whether the regression coefficient
for ∆REPAY1 t–1 equals that of ∆HE1t-1 in order to get indications of whether repayments should be included
in other nominal housing payments. These comparisons can provide insight regarding (1) whether agents make decisions about housing consumption based on real (user) costs or on nominal mortgage payments/costs; and (2) whether mortgage repayments (which are a kind of payment but not a cost) belong to the set of nominal expenditures that affect the behavior of housing consumers.
In the first stage, we regress the dependent variable on the repayment rate (∆REPAY1t–1) and on nominal
housing payments (∆HEA1t, ∆HE1t-1) only. In the second stage, we add a number of conventional control
variables and the third step includes the error correction term obtained from the level regressions. In the final stage, we add to the control variables some additional proxies for sentiments among debt investors (lagged real house price growth the past year in the US, in Denmark and the ratio of other loans to disposable income). House prices as well as mortgage debts increased at an astonishing pace between 2003 and 2008 and this development was not only limited to Denmark. While generous mortgage conditions and new financial innovations may have contributed this development, there may be other contributing factors. Other loans besides mortgages have increased (see figure A1 in the appendix), although at a slower pace than mortgages. Regression results from modeling house prices, the number of property sales and the mortgage debt ratio are in tables 2-4.
The repayment variable ∆REPAYt-1 is mainly insignificant and is, unexpectedly, positive, when modelling
property sales, However, when modelling real house prices and mortgage debts, we find that nominal housing payments (∆HEAt-1 and ∆HEt-1) are significant and negative in all regressions and that merging
repayments with nominal housing payments improves the econometric fit. Also, we are unable to reject the hypotheses that ∆HEt-1 = ∆REPAYt-1. Thus, the results favor including repayments in nominal housing
payments and do not support treating it as separate variable. However, when modelling property sales, we do not find that including repayment as a separate variable or merging them with other nominal housing payments generate a better fit, although we are still not able to reject that HEt-1 = ∆REPAYt-1. Combined
with the fact that ∆REPAYt-1 is positive, and insignificant, the results provide no evidence that repayments
affect property sales.
The regression coefficients for ∆HEt-1 and ∆HEAt-1 support a faster instant reaction of sales due to changes
in nominal housing expenditures than of prices and mortgage debts . This is in line with most previous research findings that property sales react more instantly and strongly to a shock than prices. However, results only support that a shock to repayments, channeled through lowering nominal housing, will have an
impact on house prices and the mortgage debt ratio, but not on the number of sales. The results from the level regressions (table A7 in the appendix) follow the same patterns as our difference regressions and including repayments in nominal housing payments improve the econometric fit when modelling real house prices and mortgage debts. And, like in the difference regressions, we cannot reject that the regression coefficents of HEt-1 = REPAYt-1.. Comparing the level regressions to the difference regressions, we can see
that REPAYt-1 and nominal housing payments display a considerably stronger relationship with prices in the
difference regressions (we also see this pattern for the mortgage debt ratio, although the difference is much smaller). This suggest that house prices may overreact as a response to economics shocks before adjusting towards the long-run equilibrium.
In line with intuition, if mortgage repayments affect house prices (and consequently mortgage debts) but not the number of house sales, this implies that the introduction of interest-only mortgages should have primarily affected the behavior of house bidders, and not the number of bidders in relation to the number of sellers. One possible explanation is that potential house buyers might focus strongly on nominal mortgage payments when deciding how much they are willing to pay for a house, but that they are always able to obtain a mortgage, regardless of the availability of different amortization schemes. This is in line with the discussion in Section 2, where we mentioned that MCIs always demand that a borrower must be able to repay a
mortgage through 30 year annuity payments (regardless of the chosen repayment rate). In addition, although the amortization scheme might affect what potential house buyers are willing to pay, it may not necessarily affect their decision to buy (as it most certainly should not affect their underlying need for housing). Hence, the possibility of deferring amortizations may have imposed positive effects on credit demand, but not necessarily on credit supply. If so, this may also explain why merging ∆REPAYt-1 with ∆HEt-1 does not
improve the econometric fit when modeling real property sales because other nominal housing payments (such as the level of interest rates) are known to affect the behavior of creditors and consequently affect credit supply as well.20
An additional finding that should be specifically mentioned is that the regression coefficients of real user costs (∆UCt–1) are insignificant in all regressions and/or have the “wrong (i.e. positive) sign, indicating that
home owners make decisions based on nominal variables as opposed to real ones. These results follow the same pattern when regressions are estimated in level form (see table A7 in the appendix). These results are also in line with the findings of Madsen (2012). However, for the sake of academic honesty, we should also mention that this particular result may reflect a lack of consistent measures of expected inflation and expected house price appreciation, which are two variables that are included in the definition of real user costs.
In general, control variables are not significant, but have expected signs when they are. The independent variables are positively and significantly correlated with their own lags in each regression and the error-correction terms are robustly negative for all dependent variables, indicating a strong tendency of reverting to the long-run equilibrium and that that error correction models should be used. That some control variables are insignificant does not necessarily mean that they are not important, recall that we have few observations. Also, a lack short-run relationships does not rule out the explanatory variables matter in general equilibrium. In fact, control variables display higher statistical significance in our level regressions (table A7 in the appendix).
Some results are sensitive to the inclusion of control variables, particularly when modelling the mortgage debt ratio. For example, ∆HEA1t–1,, change from -3.45 to -1.47 when the baseline controls are included (step
2). The repayment variable (REPAYt-1) appears sensitive to specification but is rarely significant anyway.
These findings may indicate multicollinerity and/or problems with endogeneity. Combined with the fact that our granger causality test suggested that that mortgage debts and property sales granger cause nominal housing payments (and repayments) give us reasons to address causality issues. Regression results are more, but not completely robust when modeling prices. The regression coefficient for ∆HEA1t–1 vary between
-8.49 and -5.86, and the difference corresponds to about one standard error.
20 For example, according to monetary policy theory, creditors will perceive an increased risk associated with lending to private individuals and consequently they will buy more bonds instead.
We find no indication that adding extra control variables (stage 4) improve the econometric fit when modelling house prices and mortgage debts. However, the regression coefficients for nominal housing payments and repayments display slightly weaker relationships with the dependent variables and standard errors increase. And, when modelling property sales, the estimated coefficents for ∆HEAt–1 and ∆HEt–1
change considerably and information criterion suggest that the extra controls improve the regression. But results still suggest that repayment should be included in nominal housing payments when explain house prices and mortgage debts, but not when modelling sales.
In sum, there are indications that including mortgage repayments in nominal housing payments can improve our models, particularly matter for house prices and mortgage debs and that house buyers may act on nominal variables rather than real ones. However, causal effects cannot be guaranteed.
Table 2. Modelling real house prices (difference regressions)
Dependent variable: First difference of of logarithm of number of real house prices (∆P)
No controls Baseline controls Baseline controls + error correction term Extra controls
∆Yt/Dwellt 0.00496 (0.526) 0.0663 (0.540) 0.100 (0.535) 0.11 (0.415) (0.42) 0.14 0.11 (0.42) 0.135 (0.475) 0.210 (0.476) 0.161 (0.475) ∆HEA1t–1 -8.487*** (2.277) -8.263*** (2.252) –6.21*** (1.82) -5.855** (2.441) ∆HEt–1 -7.873*** (2.500) -7.753*** (2.472) -7.925** (2.452) -7.737*** (2.430) –6.18*** (1.935) –6.08*** (1.93) -5.314** (2.498) -5.704** (2.506) ∆REPAY1t–1 -18.40 (12.65) -19.72 (13.78 ) -17.18 (12.51) –7.78 (7.214) -13.27 (11.09) ∆UCt–1 -0.0676 (0.101) -0.0500 (0.104) -0.0741 (0.104) –0.09 (0.08) –0.08 (0.081) –0.1 (0.082) ∆PREQ22008 0.000639 (0.00043 9) 0.000551 (0.000450 ) 0.000668 (0.000454) 0.0008** (2.32) 0.0007 (0.0004) 0.0008** (0.0004) 0.000823** (0.000373) 0.000785** (0.000381) 0.000862** (0.000384) ∆NEW 9.076 (7.384) 9.238 (7.595) 8.725 (7.526) 9.93* (5.83) 10.11* (5.912) 9.87* (5.904) 9.845 (6.032) 10.02 (6.121) 9.544 (6.099) Lagged dependent variable 0.333** (0.130) 0.379** (0.133) 0.342** (0.134) 0.82*** (0.14) 0.88*** (0.139) 0.81*** (0.152) 0.813*** (0.183) 0.883*** (0.180) 0.805*** (0.191) ∆PUSt-1 -0.0408 (0.212) -0.0455 (0.215) -0.00499 (0.216) ∆PDent-1 0.0648 (0.116) 0.0357 (0.118) 0.0729 (0.122) ∆OTHER LOANSt-1 0.0321 (0.166) 0.0853 (0.160) 0.0173 (0.169) EC term –1.02*** (0.20) –1.06*** (0.199) –1.01*** (0.204) -1.041*** (0.212) -1.064*** (0.214) -1.051*** (0.213) Wald test ∆HEt–1= ∆REPAYt–1 P-value - - 0.42 - - - 0.47 – – 0.82 - - 0.5 Durbin-Watson 1.5 1.36 1.5 1.36 2.33 2.27 0.276 1.94 1.87 1.94 1.93 1.89 1.96 BG P-value 0.045 0.024 0.028 0.021 0.1 0.08 0.03 0.24 0.25 0.22 0.26 0.28 0.24 Akaike 0.212 0.157 0.176 0.021 -213.3 -210.6 -210.8 –235.2 –233.84 –233.2 -229.7 -228.3 -228.2 Schwarz -212.1 -208.9 -209.1 -201.8 -202.1 -199.4 -197.7 –222.1 –220.7478 –218.3 -211.0 -209.6 -207.6 Adjusted R2 -210.3 -207.0 -205.3 -199.9 0.301 0.260 0.279 0.564 0.552 0.5541 0.535 0.522 0.527 Obs. 48 48 48 48 48 48 48 48 48 48 48 48 48
Source: Authors’ estimations. *,**, and *** denote significance at the 10, 5 and 1 percent, respectively. The BG P-value is the Breusch-Godfrey P-value of testing the null hypothesis of no autocorrelation, allowing for autocorrelation of the 4th order. The lagged residuals (EC terms) are obtained from regression P2 in Table A7.
Table 3. Modelling property sales (difference regressions)
Dependent variable: first difference of logarithm of number of property sales
No controls Baseline controls Baseline controls + error correction term Extra controls
∆Yt/Dwellt 5.390* (2.906) 4.891* (2.862) 3.895 (2.993) 4.69* (2.724) (2.71) 4.36 4.27 (2.76) 0.473 (2.785) -0.285 (2.724) -0.41 (2.803) ∆HEA1t–1 -11.90 (10.21) -23.07** (9.005) –20.23** (8.471) -33.14*** (9.999) ∆HEt–1 -16.62 (10.72 -17.15 (10.59 ) -26.40*** (8.992) -26.22*** (8.968) –22.37** (8.643) –22.3** (8.755) -36.85*** (9.681) -36.60*** (9.861) ∆REPAY1t–1 81.44 (54.19 ) 78.51 (55.09) 47.68 (43.14) 7.71 (30.579) 9.766 (37.67) ∆UCt–1 0.410 (0.346) 0.412 (0.337) 0.445 (0.338) 0.59* (0.3297) (0.326) 0.58* 0.59* (0.330) 0.847** (0.321) 0.852*** (0.309) 0.853** (0.313) ∆POSTQ32005 0.00262 (0.00176) 0.00298* (0.00167) 0.00343* (0.00172) 0.0018 (0.0017) 0.0023 (0.0016) 0.0024 (0.0018) 0.000555 (0.00153) 0.00117 (0.00144) 0.00128 (0.00152) ∆NEWt–1 -21.47 (26.61) -20.39 (26.04) -19.18 (25.99) –13.84 (24.2996) (24.72) –13.59 –13.56 (25.029) -10.21 (22.21) -9.507 (21.40) -9.336 (21.71) Lagged dependent variable 0.234 (0.184) 0.215 (0.180) 0.212 (0.180) 0.98*** (0.33) 0.92*** (0.337) 0.90** (0.346) 1.009*** (0.348) 0.912** (0.341) 0.898** (0.349) Q3 -0.147*** (0.0376) --0.138*** (0.0372) -0.129*** (0.0379) –0.24*** (0.0514) –0.23*** (0.052) –0.23*** (0.055) -0.281*** (0.0519) -0.262*** (0.0511) -0.258*** (0.0537) Q4 -0.150*** (0.0398) --0.149*** (0.0384) -0.140*** (0.0392) –0.08* (0.0452) –0.09* (0.045) –0.09* (0.045) -0.0840* (0.0424) -0.0880** (0.0410) -0.0880** (0.0415) Q1 0.0848** (0.0416) 0.0815* (0.0407) 0.0729* (0.0413) 0.16*** (0.0477) 0.15*** (0.048) 0.15*** (0.049) 0.0885* (0.0504) 0.0741 (0.0494) 0.0717 (0.0509) ∆PUSt-1 3.108*** (0.844) 3.290*** (0.821) 3.279*** (0.833) ∆PDent-1 -0.285 (0.374) -0.313 (0.361) -0.312 (0.366) ∆OTHER LOANSt-1 -1.028 (0.635) -1.068* (0.593) -1.037 (0.614) EC term –0.99*** (0.379) –0.92*** (0.379) –0.9** (0.392) -1.167*** (0.367) -1.065*** (0.358) -1.044*** (0.372) Wald test ∆HEt–1= ∆REPAYt–1 P-value 0.082 0.1 0.35 0.23 Durbin-Watson 1.9 1.92 1.85 1.83 2.17 2.20 2.17 2.11 2.13 2.13 2.1 2.15 2.13 BG P-value 0.00 0.00 0.00 0.00 0.22 0.25 0.33 0.20 0.21 0.21 0.47 0.5 0.53 Akaike -68.07 -69.10 -69.40 -68.73 -92.88 -95.00 -94.52 –98.79 –99.87 –97.95 -109.1 -112.6 -110.7 Schwarz -66.20 -67.22 -65.65 -66.86 -76.04 78.16 -75.80 –80.07 –81.15 –77.37 -84.73 -88.25 -84.47 Adjusted R2 0.007 0.028 0.054 0.021 0.489 0.511 0.514 0.555 0.565 0.554 0.656 0.680 0.671 Obs. 48 48 48 48 48 48 48 48 48 48 48 48 48
Source: Authors’ estimations. *,**, and *** denote significance at the 10, 5 and 1 percent, respectively. The BG P-value is the Breusch-Godfrey P-value of testing the null hypothesis of no autocorrelation, allowing for autocorrelation of the 4th order. The lagged residuals (EC terms) are obtained from Equation T3 in Table A7.
Table 4. Modelling the mortgage debt ratio (difference regressions)
Dependent variable: first difference of logarithm of mortgage debt ratio (∆DEBTS)
No controls Baseline controls Baseline controls + error correction term Extra controls
∆Yt/Dwellt 0.0701 (0.189) 0.0568 (0.191) 0.0324 (0.197) –0.11 (0.139) (0.143) –0.11 –0.09 (0.142) -0.111 (0.148) -0.106 (0.151) -0.0888 (0.151) ∆HEA1t–1 -3.746*** (1.222) -1.179 (0.767) –1.47*** (0.556) – -1.578** (0.755) ∆HEt–1 -2.480* (1.379) -2.358* (1.270) -1.236 (0.789) -1.265 (0.797) –1.39** (0.579) –1.37** (0.574) -1.397* (0.765) -1.518* (0.770) ∆REPAY1t–1 -19.50*** (6.450) -19.88*** (6.620) 2.672 (4.586) –3.71 (2.846) -4.413 (3.969) ∆UCt–1 0.0495 (0.0312) 0.0505 (0.0311) 0.0531 (0.0317) 0.04 (0.023) (0.023) 0.04 0.03 (0.02) 0.0321 (0.0278) 0.0325 (0.0282) 0.0311 (0.0281) ∆PREQ22008 -0.0000513 -0.0000576 (0.000137) -0.0000695 (0.000140) 0.00006 (0.0001) 0.00005 (0.0001) 0.00007 (0.0001) 0.0000533 (0.000107) 0.0000478 (0.000109) 0.0000696 (0.000111) ∆NEW -0.921 (2.780) -0.812 (2.793) -0.560 (2.851) 3.81* (2.157) (2.19) 3.69* 3.72* (2.17) 3.821* (2.258) 3.756 (2.294) 3.609 (2.290) ∆NEWt–1 -2.635 (2.695) -2.602 (2.694) -2.454 (2.730) 0.18 (2.002) (2.029) 0.08 0.2 (2.012) 0.192 (2.087) 0.0689 (2.113) 0.0558 (2.105) ∆OWNt -0.949 (1.394) -0.890 (1.397) -0.771 (1.424) 0.06 (1.033) 0.16 (1.040) 0.06 (1.033) 0.156 (1.250) 0.0199 (1.261) 0.176 (1.264) Lagged dependent variabl 0.814*** (0.0811) 0.839*** (0.0776) 0.867** (0.0919) 0.96*** (0.063) 0.99*** (0.062) 0.91*** (0.08) 0.973*** (0.0998) 1.015*** (0.0981) 0.956*** (0.111) ∆PUSt-1 -0.0163 (0.0888) -0.0338 (0.0887) 0.000690 (0.0937) ∆PDent-1 -0.00621 (0.0301) -0.00391 (0.0305) -0.00734 (0.0306) ∆OTHER LOANSt-1 -0.0102 (0.0468) 0.000141 (0.0888) -0.0146 (0.0887) EC term –1.03*** (0.172) –1.01*** (0.174) –1.06*** (0.177) -1.061*** (0.200) -1.051*** (0.203) -1.101*** (0.207) Wald test ∆HEt–1= ∆REPAYt–1 P-value - - 0.012 - 0.41 – – 0.43 - - 0.47 Durbin-Watson 0.4 0.25 0.52 0.43 2.55 2.54 2.53 2.04 2.02 2.04 2.04 2.05 2.04 BG P-value 0.00 0.00 0.00 0.00 0.09 0.1 0.11 0.99 0.88 0.91 0.86 0.85 0.87 Akaike -261.5 -256.0 -262.6 -261.2 -310.0 -310.1 -308.5 -339.1 -337.8 -338 -333.3 -332.1 -331.8 Schwarz -259.7 -254.1 -259.0 -259.3 -295.3 -295.4 -292.0 –322.6904 –321.38 –319.6771 -311.4 -310.1 -308.0 Adjusted R2 0.154 0.046 0.192 0.148 0.752 0.753 0.749 0.8709 0.867 0.87 0.860 0.856 0.857 Obs. 46 46 46 46 46 46 46 46 46 46 46 46 46
Source: Authors’ estimations. *,**, and *** denote significance at the 10, 5 and 1 percent, respectively. The BG P-value is the Breusch-Godfrey P-value of testing the null hypothesis of no autocorrelation, allowing for autocorrelation of the 4th order. The lagged residuals (EC terms) are obtained from regression D2 in table A7.
5.2. Event Studies
The results from our regressions indicate that if the introduction of interest-only-mortgages in 2003 contributed to the post millennial surge of house prices and increased mortgage debts, the effect was
channeled through reduced nominal housing payments. However, we lack suitable instrumental variables for repayments and identification is not guaranteed. In this section, we complement the previous analysis in section 5.1 and perform “event studies”. We thus estimate the abnormal developments (i.e. out-of-sample residuals) of our three dependent variables for different periods in connection to the 4th quarter of 2003 and
have tested whether the cumulative abnormal residuals are significantly different from zero. Figures 6-8 plots the residuals from our underlying regressions (where a positive residual means that the actual value exceeds the predicted value). All underlying regressions have been estimated using first differences. When estimating the regressions, we have included our base line controls (see tables 2-4) but dropped time trend variables because they can absorb (partially or completely) effects of events that occur at a specific point in time, thereby undermining the purpose of an event study. Naturally, we excluded mortgage repayments from nominal housing payments, because any variation of the dependent variables that is caused by changing repayment rates should be absorbed by the residual. Also, we exclude the error correction term from the control variables, because any deviation from the long-run equilibrium that is caused by changing repayment rates should be in the residual. We have used the sample period 1994q3-2003q1 when estimating the
regressions that are used to obtain estimates of the “normal” development (i.e. the predicted values).
Estimating the regressions based on some period before the event is the normal procedure in event studies21.
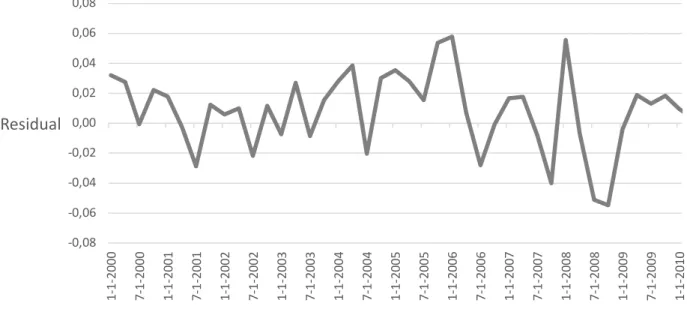
Figures 6-8 plots our estimations the abnormal developments for prices, transactions and mortgage debts from 2000 until 10. Results from testing the significance of “abnormal” developments are in table 5.
Figure 6. Real house prices residuals
Figure 6 reveals that the residuals from our house price regressions were mainly positive between October 2003 until the second quarter in 2007. The accumulated residuals between the first quarter of 2004 and the 2nd quarter of 2007 implies that house prices increased 32.2 percent more than their predicted development,
(using the base period 1994-2003). After 2007, the residuals are more on the negative side, which should be related to the outbreak of the financial crisis in 2007/2008. We see similar patterns for mortgage debts (Figure 12) and residuals are mainly positive from the period around the introduction of interest-only-mortgages until 2007/2008. Patterns are less clear for property sales, which have higher volatility. 21 The results of the estimated regression used to obtain the abnormal development are available upon request.
-0,08 -0,06 -0,04 -0,02 0,00 0,02 0,04 0,06 0,08 1-2000 7- 1-2000 1-2001 7- 1-2001 1-2002 7- 1-2002 1-2003 7- 1-2003 1-2004 7- 1-2004 1-2005 7- 1-2005 1-2006 7- 1-2006 1-2007 7- 1-2007 1-2008 7- 1-2008 1-2009 7- 1-2009 1-2010
Residual
Figure 7. Number of property sales residuals
Figure 8. Mortgage debt ratio residuals -0,40 -0,30 -0,20 -0,10 0,00 0,10 0,20 0,30 1-2000 7- 1-2000 1-2001 7- 1-2001 1-2002 7- 1-2002 1-2003 7- 1-2003 1-2004 7- 1-2004 1-2005 7- 1-2005 1-2006 7- 1-2006 1-2007 7- 1-2007 1-2008 7- 1-2008 1-2009 7- 1-2009 1-2010 7- 1-2010 1-2011 7- 1-2011 1-2012 7- 1-2012 1-2013 7- 1-2013