ACCURACY OF RADAR WATER LEVEL MEASUREMENTS Janice M. Fulford1
Lee W. Ester2 John W. Heaton3
ABSTRACT
Radar water-level sensors are generating a lot of interest among hydrographers because of their ease of installation and low maintenance. However, limited information is available on the accuracy and performance of radar sensors in the field. This paper presents test results from recent field measurements made with radar water-level sensors. Field data collected with two pulse radars, (Design Analysis Associates H-3611 and the Ohmart Vega Puls 62) and one continuous wave frequency modulated radar (Saab Rosemount) during lake drawdown at Horse Mesa Dam, Arizona, are presented and compared against a conventional float-well system. (The use of firm, trade and brand names in this report is for identification purposes only and does not constitute endorsement by the U.S. Government). Measured radar data were analyzed for possible sources of systematic measurement uncertainty (error) including sensor height above water (air gap), air temperature and surface waves.
The Ohmart Vega sensor has a systematic uncertainty from varying air gap. The H-3611 and the Saab Rosemount sensor do not have an obvious systematic uncertainty from varying air gap. None of the radar sensors have an obvious uncertainty from surface waves when compared with the float-well systems. No systematic uncertainty due to temperature or wind speed was noted for any of the radars. Analysis of the field data indicate that the data measured by the H-3611 and the Saab Rosemount are not statistically different from that collected by the float-well system. For the data measured by the Ohmart Vega, a systematic error of about 0.3 ft over a 35-ft change in water level occurred during the field measurements.
INTRODUCTION
Water-level measurements are used by water managers and hydrographers to compute water flow and volumes. The accuracy and performance of stage instrumentation directly affects the quality of these parameters. Instrumentation systems commonly used to measure water level are: (1) a float with shaft encoder in a stilling well (float-well), (2) non-submersible
pressure-transducer bubbler systems, (3) submersible pressure pressure-transducer systems and (4) acoustic systems.
Traditionally, the U.S. Geological Survey has used float-well and pressure sensor systems and the Salt River Project (SRP) has used float-well systems to measure water level. Acoustic systems have not been routinely used because the accuracy of open-air acoustic systems, which are affected by air temperature gradients, does not meet the requirements of the U.S. Geological
1 Hydrologist, U.S. Geological Survey, Building 2101, Stennis Space Center, MS 39529 2 Measurement Services Manager, Salt River Project, Tempe, AZ
Survey and the SRP. Unfortunately, the other systems have orifices in the water that are subject to fouling and damage by debris, sediment and biota. These systems are also costly to install and maintain. Float-well systems require the construction of a stilling well and pressure systems require trenching to bury cables or pressure lines. Maintenance of the orifices can require labor-intensive flushing or clearance of the orifices. Additionally, float-well systems have long tapes and floats that can become tangled or damaged and can be difficult to replace.
Both the U.S. Geological Survey and the SRP are studying radar sensor technology in an effort to reduce installation and maintenance costs of water-level measurement systems. Radar sensors do not need to have contact with the water to measure the water level and do not require the construction of stilling wells or orifice lines. Moreover, because radar is a "non-contact" measurement method, it is not susceptible to having a submerged orifice obstructed, silting of a stilling well or damage by sediment or floating debris. Floating debris or objects in the “line of sight” of the radar may adversely affect water-level measurements. Typically, water-level radars are installed on a stable platform, such as an existing bridge, that positions the radar antenna over the water.
This paper presents test results from recent field measurements made with three different radar water-level sensors. The field data were collected in collaboration between the SRP and the U.S. Geological Survey, Hydrological Instrumentation Facility and the U.S. Geological Survey, Tempe, Arizona office. Data collected by the Design Analysis Associates H-3611, Ohmart Vega Puls 62 and a Saab Rosemount radar during lake drawdown at SRP Horse Mesa Dam, Arizona, are presented and compared against float-well measurements. (The use of firm, trade and brand names in this report is for identification purposes only and does not constitute endorsement by the U.S. Government).
WATER-LEVEL RADAR SENSORS
A radar sensor measures water level by propagating electromagnetic energy with an antenna. Because radar energy reflects and scatters similarly to light, objects in the propagation path reradiate the microwave energy back to the radar antenna. The time it takes for the energy to return to the radar (travel time) is determined with the radar’s integral digital signal processing software. The resulting travel time is used to determine the distance to the object (or water level).
Radar energy spreads with distance like a flashlight beam. Unlike acoustic water-level sensors, the propagation of radar energy is not significantly affected by air temperature or by moderate rainfall (Serafin, 1990). Unfortunately, radar sensors cannot be used to measure water levels thru ice cover, because radar energy does not reliably penetrate ice. Because any object in the “line of sight” of the radar propagation path (or beam path) will reflect energy, an unobstructed path is needed between the antenna and the water surface. Radar sensors must be placed directly over the water surface so that the reradiated energy reflects directly back to the radar antenna. This makes radar sensors ideal for installing on rigid bridges or vertical structures next to water.
Radar systems for water-level measurements were originally designed for industrial tank measurement and adapted for use in open air. The frequencies used for tank radar systems typically range from 10 to 24 gigahertz (GHz). Tank radars are either continuous wave
frequency modulated radars or pulse radars. Because industrial tank radars are used in enclosed structures, not all tank radars are licensed for open air use. Using radar systems in the open air require the radar unit to be licensed by the Federal Communications Commission (FCC) to ensure that the system does not interfere with other transmissions or pose a health hazard. Some radar systems’ frequencies and bandwidths may need site specific FCC licensing for use. Some of the features added to radars used for open air water-level measurements include SDI-12 communications and battery power.
PREVIOUS STUDIES OF WATER-LEVEL RADAR SENSORS
A simple uncertainty analysis of water-level sensors (Fulford and Davies, 2005b) found that radar systems with an accuracy of 0.026 ft are more accurate than uncorrected pressure systems, except at low stages. However, float-well systems were found to have the best accuracy
throughout a large range (30 ft) of water levels. Best measurement accuracy is typically required at low stages. In contrast, radar accuracy typically improves with decreasing distance to water (increasing stage).
Previous U.S. Geological Survey laboratory and field testing (Fulford and Davies, 2005a) of a Design Analysis Associates H-360 continuous wave frequency modulated radar found a measurement accuracy of about 0.03 ft and a systematic measurement uncertainty due to air temperature. Data collected by the H-360 had lower minimum water levels than either float-well system or pressure sensors. This was attributed to the wave troughs focusing the radar energy back at the radar antenna and the wave crests dispersing the energy away from the antenna, resulting in a fictitiously lower water surface. Additionally, frequency analysis of radar measurements at two field sites showed the radar data adversely affected by sampling at a 15-minute interval. The radar in this study was turned on for 2 15-minutes to measure the water level and then turned off until the next measurement was collected, 15 minutes later. The 15-minute sampling interval is traditionally used by the U.S. Geological Survey for water-level
measurements. The 2 minutes of measurement by the radar did not allow the higher frequency wind-driven surface waves to be filtered out by the radar sensor’s signal processing firmware. This resulted in the radar measurements having an uncertainty due to wind-driven surface waves that was not found in either the float-well or pressure sensor systems measurements.
WATER-LEVEL RADAR SENSORS STUDIED
The three radars used to collect the data presented in this report are: Design Analysis Associates (DAA) H-3611, Ohmart Vega Puls 62 and a Saab Rosemount Tank Radar (figure 1). The DAA H-3611 and Ohmart Vega Puls 62 are pulse radars that use a 26 GHz frequency and have FCC approval for open air use. These units have a similar size, about 18 inches long by about 4 inches in diameter. Both of these models are 12 volt battery powered and use SDI-12 and RS232 communications. Power consumption of the units is less than 12 mA. This allows the units to continuously measure the location of the water surface and filter out the effects of small waves
Figure 1. Pictured from left to right, Design Analysis Associates H-3611, Ohmart Vega Puls 62 and Saab Rosemount Tank Radar. Photos are not to scale.
and use battery power. They have an air gap range from 0.17 ft to 72 ft and weigh about 6 lbs. Any SDI-12 compatible data logger can be used to record the measurements. The Saab
Rosemount radar is a continuous wave, frequency modulated radar that uses a 10 GHz frequency. It uses line power and is about 30 by 17 inches and weighs 55 lbs. It has a measurement range of at least 130 ft. Similar to the other radar units, the Saab Rosemount continuously measures the location of the water surface and filters out the effects of small waves.
FIELD MEASUREMENTS
Field data were collected at 15-minute intervals during the drawdown of the lake at Horse Mesa Dam. Water-level data were collected from the Saab Rosemount radar and a SRP shaft encoder attached to the float and logged by SRP’s Lake Level SCADA system. Water-level data were collected from the DAA H-3611 and Ohmart Vega radars and from an additional shaft encoder attached to the SRP float-well system and logged to a U.S. Geological Survey logger. Hourly weather data from a Vaisala WTX 510 and digital camera images taken every 3 hours were recorded to the U.S. Geological Survey logger. Figure 2 shows the installation at the Horse Mesa Dam and was taken by the digital camera attached to the logger. Data from the SRP logger covered the period from October 1, 2006, thru November 2, 2006. Data from the U.S.
Geological Survey logger covered the period from September 13, 2006, thru November 3, 2006. No adjustments to the sensors were made during the measurement period. No floating debris occurred during the measurement period.
Comparison of Radar and Float-Well Data
Comparison of simple statistics: average, standard deviation, minimum and maximum, computed for the collected water-level measurements can indicate whether the radar
measurements are as accurate as the float-well system. Because the resolution of the float-well system water-level measurements is 0.01 ft, statistical differences that are less than or equal to 0.01 ft are not significant. Summary statistics for the data collected by the U.S. Geological Survey logger from September 13, 2006, thru November 3, 2006 are listed in table 1. The measurement period spans about 51 days and 4874 measurements for each sensor. The water level changed about 35 ft during the period. Few obvious outliers were detected in the data. An obvious outlier measurement on September 24 at 3:15 for the DAA H-3611 and Ohmart Vega radars was removed from the data prior to the statistical analysis. The Ohmart Vega radar had an additional outlier measurement on October 5 at 14:00 that was also removed. Birds or other objects temporarily in the line of sight and radio interference sources such as radios, electric motors and power lines could cause outliers in the radar data.
The DAA H-3611 statistics have excellent agreement with the float-well system. The average, standard deviation and maximum values for the DAA H-3611 are within 0.01 ft of the values for the float-well system. The minimum water level is slightly lower than the float well, by -0.04 ft.
Figure 2. Photo of installed radars and stilling well at Horse Mesa Dam, Arizona, by digital camera attached to logger.
Table 1. Summary statistics for water-level data logged from September 13, 2006, 13:30 to November 3, 2006, 8:00 at 15-minute intervals (4874 measurements) during
lake drawdown at Horse Mesa Dam, Arizona.
[1data from U.S. Geological Survey encoder attached to float-well system; ft, feet] Float-well1 DAA H-3611 Ohmart Vega Puls 62
Average (ft) 32.32 32.31 32.52
Standard deviation (ft) 9.91 9.92 9.82
Minimum (ft) 17.33 17.29 17.61
Maximum (ft) 52.39 52.39 52.39
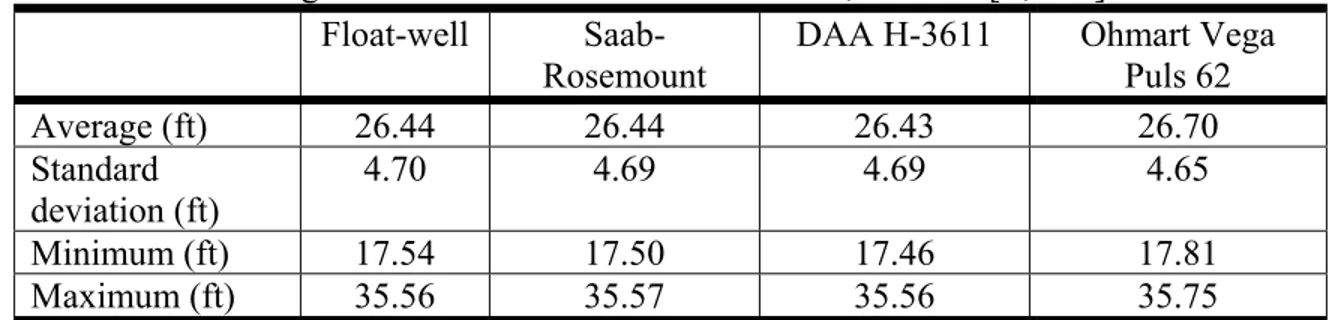
Table 2. Summary statistics for water-level data logged from October 1, 2006, 0:00 to November 2, 2006, 4:30 at 15-minute intervals (3090 measurements)
during lake drawdown at Horse Mesa Dam, Arizona [ft, feet].
Float-well
Saab-Rosemount DAA H-3611 Ohmart Vega Puls 62
Average (ft) 26.44 26.44 26.43 26.70 Standard deviation (ft) 4.70 4.69 4.69 4.65 Minimum (ft) 17.54 17.50 17.46 17.81 Maximum (ft) 35.56 35.57 35.56 35.75
The Ohmart Vega statistics are slightly different from the float well system, +0.20 ft for the average and + 0.09 ft for the standard deviation. The minimum water level is +0.28 ft higher than the float-well system.
Summary statistics for the data collected by the SRP Lake Level SCADA system from October 1, 2006, thru November 2, 2006, are listed in table 2 with statistics for the data collected by the U.S. Geological Survey logger over the same period. The statistics are for 3090 measurements over approximately 32 days. The water level changed about 19 ft during the period.
The Saab Rosemount statistics have excellent agreement with the float-well system. The average, standard deviation and maximum values for the Saab Rosemount are within 0.01 ft of the float-well system. The minimum water level is slightly lower than the float well, -0.04 ft. During this measurement period, the DAA H-3611 statistics have excellent agreement with the float-well system except for the minimum water level, which is slightly lower than the float well, -0.08 ft. The Ohmart Vega radar statistics are slightly different from the float-well system,+ 0.26 ft for the average and -0.05 for the standard deviation. The minimum water level is +0.27 ft higher than the float-well system.
Effects of Air Temperature, Wind Speed and Air Gap
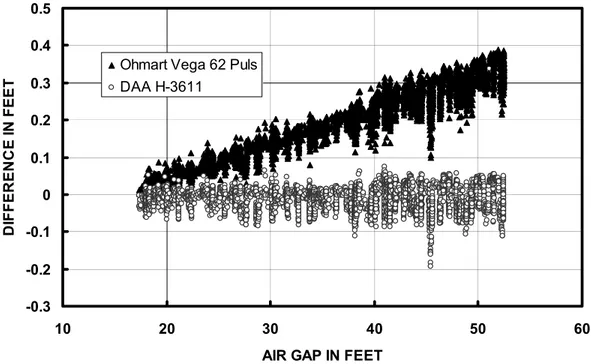
Differences between the radar measurements and the float-well were examined using plots with air temperature, maximum wind speed and air gap distance. No obvious influence of air
not included in the report. Figures 3 and 4 show plots of differences between the float-well measurement and the radar measurement plotted against increasing air gap. During the drawdown period the air gap ranged from about 17 ft to 53 ft.
-0.3 -0.2 -0.1 0 0.1 0.2 0.3 0.4 0.5 10 20 30 40 50 60
AIR GAP IN FEET
DI F F E R E NCE IN F E E T
Ohmart Vega 62 Puls DAA H-3611
Figure 3. Difference between radar and float-well system plotted by air gap.
-0.3 -0.2 -0.1 0 0.1 0.2 0.3 0.4 0.5 10 20 30 40 50 60
AIR GAP IN FEET
D IFFE R E N C E IN FE ET Saab Rosemount
The DAA H-3611 and the Saab Rosemount radar have no obvious trend with air gap. A linear regression of the differences with air gap yielded very low correlation coefficients of 0.001 (DAA H-3611) and 0.016 (Saab Rosemount). The Ohmart Vega radar differences have a linear trend with air gap (figure 3). A linear regression of the differences with air gap yielded a 0.009-ft difference per foot of air gap and a correlation coefficient of 0.847.
The Ohmart Vega systematic difference with the float-well system measurements may be due to a small clock error that prevents accurate timing of the radar pulse travel time. This could also explain the slight differences with the float-well system statistics. The effects of clock error on low stage measurements potentially could be reduced by zeroing (or calibrating) the radar to a reference measurement at a low stage. Measurement error due to clock error would then be larger for the higher stages. The slightly lower minimum water levels measured by the Saab Rosemount and DAA H-3611 may be due to a bias from surface-wave troughs preferentially reflecting energy back to the radar antenna. Controlled laboratory experiments on the effects of wave action on measurement bias might help quantify how significant this effect is and perhaps suggest how to minimize the adverse effects.
Response to Surface Waves
Frequency analysis was used to supplement the simple statistical analysis and to help find the difference between float-well and radar responses to surface waves. The field data for the radars and the float-well system were transformed into frequency data using fast Fourier transform techniques (Bracewell, 2000). Fourier transforms convert time-series data into the frequency domain. The trend and mean in the measured water levels due to the lake drawdown were removed from the measured data prior to the Fourier transform of the data. Fourier analysis requires that the data have no trends and a mean of zero. Because of the effort required to de-trend the data only a subset of the data that varied linearly was transformed. For the float well, DAA H-3611 and the Ohmart Vega, the selected length of record transformed was from September 15 at 15:45 to October 4 at 20:00, about 19.2 days. For the Saab Rosemount the period transformed was from October 14 at 21:30 to October 29 at 17:30, about 14.8 days. For comparison with the Saab Rosemount, the same period was also transformed for the float-well system.
Only the magnitude of the transform data is plotted in figures 5 and 6 as a function of period in hours. A period is the time from crest to crest of a wave and is the inverse of frequency. Because of the sampling interval of 15 minutes, the shortest periodic signal that can be detected from the transformed data is 0.5 hour. The longest periodic signal that can be detected is half the length of the record transformed. For the 19.2-day record length, the longest periodic signal that can be detected is 460.75 hours. For the 15-day record length, the longest periodic signal that can be detected is 356.0 hours.
The magnitude indicates how much energy is present for a water wave of a particular period. A low magnitude indicates little or no waves present at that period. For river systems, most of the energy is at the larger wavelengths with periods of several hours, reflecting hours and days that it
0 50 100 150 200 250 0.1 1 10 100 1000 PERIOD IN HOURS MA G N IT U D E Float-well 0 50 100 150 200 250 0.1 1 10 100 1000 PERIOD IN HOURS MA G N IT U D E DAA H-3611
Figure 5. Plots of Fourier amplitudes of water-level data measured by a float-well system and a DAA H-3611 from September 15 at 15:45 to October 4 at 20:00 during drawdown of lake at
Horse Mesa Dam.
takes for rainfall events to cause the water level in rivers to rise and fall. Wind, however, can produce water waves with periods of 5 minutes or less (Kinsman, 1965). For float-well systems, the stilling well acts to damp out (or filter) the small surface waves that are produced by wind or other small flow disturbances. The resulting water level is closer to the local (in time) average water level and is the measurement that is traditionally used to compute flow.
The transformed data for all radars, DAA H-3611, Ohmart Vega and Saab Rosemount, have excellent agreement with the transformed data for the float-well system. The plots in figure 5 and figure 6 look identical, indicating that the radars filter out the small surface waves similar to the float-well system. The plots also show that the radar systems response to all periodic
0 50 100 150 200 250 0.1 1 10 100 1000 PERIOD IN HOURS M A G N IT UDE
Ohmart Vega Puls 62
0 50 100 150 200 250 0.1 1 10 100 1000 PERIOD IN HOURS M A G N IT UDE Saab Rosemount Float Well
Figure 6. Plots of Fourier amplitudes of water-level data measured by a Ohmart Vega Puls 62 and a Saab Rosemount and float-well system from October 14 at 21:30 to October 29 at 17:30
during drawdown of lake at Horse Mesa Dam.
plot in figure 6 for the Saab Rosemount includes data for the float-well system over the same period. The plot does not have data at the longer periods because the length of record was shorter and the data are for a slightly different period.
SUMMARY
Radar instruments may provide significant advantages over traditional water-level sensors. They require less effort to install than either float-well systems or pressure sensor systems. Radar sensors require less maintenance than traditional water-level sensors because they are not in contact with the water. Field measurements at the Horse Mesa Dam demonstrate that radar
water-level measurements can have similar accuracy as float-well systems over a change in stage of 35 ft and air gaps up to 53 ft.
The DAA H3611 and the Saab Rosemount both have measurement statistics and frequency responses that are not distinguishable from the statistics and frequency response of the float-well system. The only exception is the minimum water level measured, which is lower by -0.04 to -0.08 ft than the minimum measured by the float-well system. The lower minimums may be due to wave troughs preferentially reflecting energy back to the radar antenna, resulting in a
fictitiously, slightly lower water surface. The Saab Rosemount and the DAA H3611 do not have an obvious correlation between air gap and measurement accuracy. The other radar sensor used, Ohmart Vega Puls 62, has slightly different statistics and a similar frequency response to the float-well system over the measurement period. The statistics were different by +0.20 ft for the average and +0.09 ft for the standard deviation over 51 days. The minimum water level is +0.28 ft higher than the float-well system. The slightly different statistics may be due to a small error in timing the radar pulse travel time which resulted in increasing error with increasing air gap.
All of the radars used to collect the data presented in this report continuously measure the location of the water surface and filter out the effects of small waves. This resulted in the radars having a frequency response to water-level changes that is very similar to the float-well system. Radar water-level sensors are an exciting new tool for measuring water levels. The drawbacks of radar sensors are the inability to measure water-level under ice cover or floating debris, the need to have a clear “line of sight”, a small low measurement bias that is likely a function of surface waves, and the need to position the radar antenna directly over the water surface. The data collected during lake drawdown at Horse Mesa shows that there are commercially available radar systems capable of replacing the traditional water-level sensors.
REFERENCES
Bracewell, Ronald N. 2000, The Fourier transformation and its applications: Boston, Mass. McGraw Hill Co., 144 p.
Fulford, Janice M. and Davies, William J. 2005a, March “Radar Water-Level Measurement for Open Channels”, in Proceedings of Third International Conference on Irrigation and Drainage (USCID), San Diego, CA.
Fulford, Janice M. and Davies, William J. 2005b, May “Radar Stage Uncertainty”, in Proceedings of EWRI/ASCE 2005 Conference, Anchorage, AK.
Kinsman, Blair, 1965, Wind Waves: Englewood Cliffs, NJ., Prentice Hall, 676 p.
Serafin, Robert J, 1990, Meteorological Radar, in Radar Handbook, Editor M. Sholnik, Boston MA, McGraw Hill, 23.7-23.8p.