THESIS
AGING RELATED CO-CONTRACTION EFFECTS ON BALANCE RECOVERY USING THE ANKLE STRATEGY
Submitted by
Anthony Mixco
Graduate Degree Program in Bioengineering
In partial fulfillment of the requirements
For the degree of Master of Science
Colorado State University
Fort Collins, Colorado
Copyright by Anthony Roberto Mixco 2010 All Rights Reserved
COLORADO STATE UNIVERSITY
July 12, 2010 WE HEREBY RECOMMEND THAT THE THESIS PREPARED UNDER OUR SUPERVISION BY ANTHONY MIXCO ENTITLED AGING RELATED CO-CONTRACTION EFFECTS ON BALANCE RECOVERY USING THE ANKLE STRATEGY BE ACCEPTED AS FULFILLING IN PART REQUIREMENTS FOR THE DEGREE OF MASTER OF SCIENCE.
Committee on Graduate Work
________________________________________ David Greene
_________________________________________ Advisor: Raoul F. Reiser II
________________________________________ Co-Advisor: Brian Tracy
________________________________________ Department Head: Stuart Tobet
ABSTRACT OF THESIS
AGING RELATED CO-CONTRACTION EFFECTS ON BALANCE RECOVERY USING THE ANKLE STRATEGY
Aging typically leads to an increased risk for falls. Fall risk has been associated with, amongst other variables, a decline in muscle strength and power. An accepted model to assess one’s ability to recover balance is with a perturbation of quiet stance through the release of a horizontal tether pulling at the waist. PURPOSE: To examine ankle muscle co-contraction levels in young and older adults during static held maximum voluntary contraction (MVC), rate of force development (RFD), as well as prior to and during an induced perturbation. METHODS: 18 healthy adult women (9 young: 22.3+3.3 yrs and 9 older: 75.2+4.2 yrs) with no history of falls or injury performed a minimum of 3 trials each of isometric MVC where force was ramped to and held at maximum and RFD where force was built as quickly as possible from rest for both plantar flexion (PF) and dorsiflexion (DF). The perturbation trials were then performed where they recovered balance using the ankle strategy. Surface electromyography (sEMG) data were analyzed to compare co-contraction activity between groups. RESULTS: Height, body weight, and foot length were similar between groups (p>0.05). After normalizing for height, weight, and foot length, there were no differences between groups for muscle strength characteristics for PF and DF isometric trials (p>0.05). sEMG parameters were normalized using the PF MVC for the gastrocnemius (GAS) and soleus (SOL) and the DF MVC for the tibialis anterior (TA). No sEMG
differences were found between groups for PF MVC, PF RFD, and DF RFD for all muscles (p>0.05). DF MVC showed significantly more co-contracting GAS activity for the young (young: 25.8+8.6%, older: 11.8+3.1%), (p=0.001) but not for SOL (young: 37.3+12.2%, older: 34.5+12.8%) or TA activity (young 66.9+9.1, older: 66.31+7.2%), (p>0.05). Perturbation sEMG showed no significant interactions or main effects for GAS and SOL between time and age (p>0.05). TA activity did show a significant interaction (p=0.001). Simple main effects at each time point comparison between the young and older showed significantly more TA activity in the older adults at 300-400ms after load release (young: 23.5+5.8%, older: 38.7+9.4%), (p=0.001) but nowhere else (p>0.098). Additionally the electromechanical delay (EMD) between torque and onset of muscle activity approached significance for the GAS (young: 0.064+0.009%, older: 0.071+0.01%), (p=0.053). CONCLUSIONS: As expected the older adults showed more TA antagonistic co-contraction during balance recovery. Unexpectedly the young adults showed more GAS activity during DF MVC without a significant difference in force output. The approaching significance of GAS EMD also shows evidence of age-related neuromuscular changes taking place. However because of the lack of difference in strength and rate of force development between the two age groups the additional antagonistic torque produced by the older adults may be compromising the balance recovery process. In less physically capable older adults, the differences seen in TA activity and EMD may cause problems in recovering balance from perturbations.
Anthony Mixco Graduate Degree Program in Bioengineering
Colorado State University Fort Collins, CO 80523 Summer 2010
Chapter I: Introduction ... 2
Hypotheses ... 4
Chapter II: Literature Review... 6
Causes of Falls ... 7
Neuromuscular Changes ... 7
Tendinous Changes ... 13
Balance Control and Recovery ... 17
Postural Control ... 17
Co-contraction ... 21
Recovery from small Perturbations: The Ankle Strategy ... 24
Chapter III: Methods and Materials... 28
Participants ... 28
Maximum Voluntary Contraction (MVC) Protocol ... 29
Rate of Force (RFD) Development ... 30
Perturbation ... 30
Data Analysis ... 32
Statistical Analysis ... 37
Chapter IV: Results ... 39
Isometric sEMG trials ... 40
Perturbation Trials ... 42
Repeatability Analysis ... 44
Chapter V: Discussion ... 45
Summary/Conclusions ... 51
Strengths and Weaknesses ... 50
Appendices ... 52
Appendix A ... 52
Appendix B ... 61
Appendix C ... 66
Chapter I: INTRODUCTION
Falls are a major health problem that greatly affects the older adult population (NSC 1998, Masud et al., 2001). As each year passes one third of the older adult
population undergoes a fall (Prudahm et al., 1981, Campbell et al., 1981). Of those that do fall, about two thirds run the chance of falling again (Gabell et al., 1985). When a fall occurs, the result can be quite serious. The seemingly most dangerous consequence of a fall can be hip fracture. Hip fractures are a major health problem as it leads to medical costs totaling up to $19 billion annually (Stevens et al., 2006). The mortality rate following a hip fracture has been shown to be up to 42% following 1 year post surgery, and about 70% of deaths take place 6 months post-fracture (Abrahamsen et al., 2009). Although the occurrence of major injuries is relatively low, 5 to 6% of falls lead to major injury (CDC, Campbell et al., 1981). Falls also bring a secondary psychological effect, the fear of hip fracture. Fear of falling can then become just as detrimental as a fall itself (Ruthig et al., 2007), preventing older adults from performing certain activities, and leading to reduced physical activity and isolation (Abrahamsen et al., 2009).
Falls are induced by a loss of balance that cannot be recovered. Interacting with environmental conditions, which may be controlled to a degree, there are also
neurological, muscular, and tendinous changes that individuals undergo as they age. These changes are partly responsible for the increase in falls. It is known that muscle
and nerve tissue degrade with age. Motorneurons reduce in size and may lose synapses (Webber et al., 2009). Muscle tissue may atrophy and remaining fibers may over time develop diminished contractile speed (Webber et al., 2009). Tendons can lose stiffness becoming, more compliant and less capable of handling high loads (Narici et al., 2008). Although these changes can be slowed with activity and training, it is necessary to understand their effects and the impact on one’s ability to recover balance from falls (Macaluso et al., 2004, Reeves et al., 2004a, Reeves et al., 2004b, Wolfson et al., 1986). By gaining a better understanding of the results of age-related changes, preventative and rehabilitative training can be targeted more appropriately to reverse these changes and lessen the number and severity of falls.
When balance is perturbed, the individual either falls or recovers their balance. Balance maintenance and recovery are fundamental to fall prevention. In the case of small perturbations, the ankle strategy is usually employed (Hwang et al., 2009). This involves the body acting as a rigid inverted pendulum rotating about the ankle. With this response mechanism, the plantar flexors work to recover balance. When these
antagonistic dorsiflexors contract simultaneously, a person’s ability to recover may be compromised. With an antagonist active, additional torque will be required from the agonist muscles (Macaluso et al., 2002). This torque is needed extremely rapidly in order to keep the center of mass of a person over the base of support after a perturbation takes place to prevent a fall.
Antagonistic co-contractions have been shown to take place more in the older adult population than the young (Okada et al., 2001). The co-contraction strategy is thought to act as a method to stabilize a weaker joint (Pijnappels et al., 2006). However, the role that antagonistic co-contraction plays in balance recovery let alone if it occurs is debated. Antagonistic co-contraction has been shown to occur in the older population and thought to affect the movement pattern for balance recovery (Okada et al., 2001). Conversely others have found a lack of antagonistic co-contraction during balance recovery (Chu et al., 2009, Pijnappels et al., 2006). Conflicting findings create a further need to clarify whether antagonistic co-contractions across the ankle joint are
population specific or task specific. The goal of this study was to examine co-contraction of the ankle PF and DF prior to and during an induced perturbation requiring the ankle strategy. Additionally maximal static and rate of force trials were included.
Hypotheses
1. Older adults will produce less torque during isometric plantar flexion (PF) and dorsiflexion (DF) trials both during maximum voluntary contraction (MVC) and rate of force development (RFD).
2. Older adults will exhibit more antagonistic tibialis anterior (TA) co-contraction during isometric PF and DF trials both during MC and RFD.
3. From the perturbation trials, the older adults will produce more antagonistic TA co-contraction during the recovery event.
Chapter II: LITERATURE REVIEW
Falls are a detrimental problem to society, specifically the elderly population. An epidemiological study of falls presented data showing that in a one year period about 30% of people 65 and older experience a fall and roughly 35% of adults 75 years of age and older experience a fall (see Masud et al., 2001 for details). The data were from community dwellers. Since community dwellers may or may not be monitored, there may actually be a higher incidence of falls amongst adults 65 years and older. Falls carry a heavy price tag both financially and physically (Stevens et al., 2006). Consequently, the research that is undertaken in this area is of essential importance. To understand falls, it is necessary to know what age-related factors cause them. Falling is a two part process. First, a stimulus causes a loss of balance. Secondly, there is an inability to recover balance. This chapter will present the research that has been conducted to understand loss of balance and failed recovery, and acknowledging areas that need further
Causes of Falls
Neuromuscular Changes
Aging is inevitable, and the population is getting older (Masud et al., 2001). Therefore falls will become a more looming problem, and as a result have been extensively researched (Tinetti el al 1988, Robbins et al., 1989, Das and Joseph 2005). Much of the research conducted has uncovered two reasons why falls take place:
changes in strength and subsequent changes in power production. Sarcopenia is the loss of muscle mass and strength due to aging (Boron & Bolpaep), defined as having a
muscle mass index that is two standard deviations below the mean for the average age group (Dirks et al., 2005). Forty percent of the population over 80 years old is sarcopenic as are 10-25% of people under 70 years of age (Dirks et al., 2005). Reductions begin around age fifty (Vandervoort et al., 1986, Kallio et al., 2010). The loss of muscle mass comes about primarily from loss of muscle fibers and decreased cross sectional area of the remaining fibers, i.e. atrophy (Barton-Davis et al., 1998, Booth).
The loss of muscle fibers is primarily thought to occur through changes in motorneurons, mainly through death of motorneurons and a reduction in number of Type II, fast-twitch, fibers (Dirks et al., 2005, Caccia et al., 1979). Lack of physical activity is also responsible for a decrease in fibers as it has been shown to increase atrophy of remaining fibers (Barton-Davis et al., 1998). The actual mechanisms for atrophy in aging beyond lack of activity of muscle is still unknown, but it has been postulated that muscle mass loss can arise from: 1) activation of proteolytic pathways in response to oxidative
stress, 2) hormonal adaptations, 3) loss of neurological innervations, 4) mitochondrial dysfunction, or any combination (Lexell et al., 1995, Marcell et al., 2003, Faulkner et al., 1995, Wallace et al., 1992).
Recently another idea has been introduced that looks to answer these questions as well, cellular apoptosis (Combaret et al., 2009, Lexell et al., 1988). Apoptosis is
programmed cell death that is highly regulated. It causes the death of a single cell and not the entire tissue like in necrosis (Boron & Bolpaep 2005, Dirks et al., 2005). Because there are many pathways that activate apoptosis, it is not completely understood which pathways are activated. Currently it has been thought that mitochondrial and
sarcoplasmic reticulum mediated signaling pathways are involved (Combaret et al., 2009, Dirks et al., 2005). Additional to an overall loss of fibers, there is a decrease in the size of individual fibers both in length and area (Grimby et al., 1984, Lexell et al., 1988, Brooke et al., 1969, Morse et al., 2005). Type II fibers generally have a cross sectional area about 20% larger than Type I, slow twitch, fibers when people are 30-40 years of age. At about 80 years of age though, the relative size of Type II fibers drops in size to about half of Type I fibers. With decreases in total muscle area and decreases in fast twitch fiber size, strength declines as a person enters the sixth to eighth decade of life (Morse et al., 2005, Doherty et al., 1993). With respect to fiber length, a decline in length suggests not only losses of sarcomeres in parallel, but also a loss of sarcomeres in series (Hooperet al., 1981, Narici et al., 2003).
A loss of sarcomeres, both in parallel and series, has an impact on the force-length and force-velocity properties of the muscle, compounding the loss of muscular function seen in the older adults. Loss of fibers in a parallel structure affects the maximum force generating potential, directly affecting the strength of the muscle. A reduction of sarcomeres in series has a negative effect on the shortening velocity of the muscle (Peterson and Bronzion 2008, Narici et al., 2003). Besides gross morphological changes to the muscle, changes at the cellular level occur which compound the gross changes. A modification in the amount of actin-myosin cross bridges that can be formed has been correlated to a decline in the specific tension of a muscle (D’Antona et al., 2003), which leads to a lessening of the amount of force per unit of cross sectional area (Doherty et al., 1993, Klitgaard et al., 1990). These morphological changes all contribute to the diminishing of strength, but are not the sole reason.
In addition to affecting strength, the morphological changes presented lead to a decrease in total muscle volume which has been shown to affect power output. A recent study by Thom et al., (2005) examined power output in the triceps surae as affected by age. The results of the study show that in older men there was a reduction of about 50% in power. Upon examining all the factors associated with power, i.e. decrease in muscle force and shortening velocity, the authors found that the reduction in muscle volume was accountable for approximately half of the loss of muscle power. These findings were similar to previous research (See Thom et al., 2005), but were not again found in a second study by the same authors. Thom et al., (2007) found a massive decrease in
power output in comparing young and older subjects, but only about 10% of the loss could be attributed to decrease in muscle volume suggesting that other factors are of significant influence in power loss.
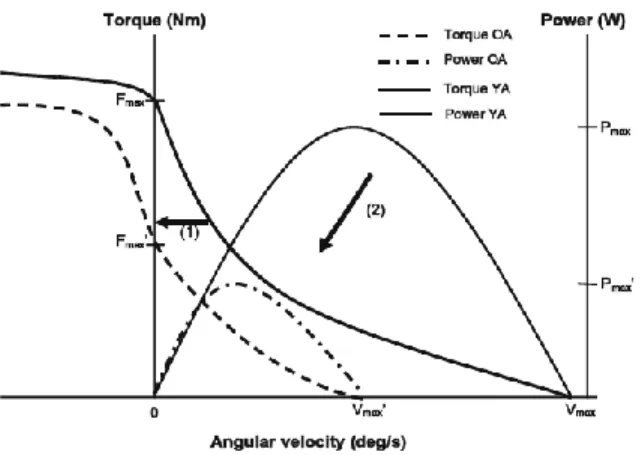
Figure 2.1: Changes in force-velocity and torque-velocity curve from Raj et al., 2010 between old (OA) and young (YA) adults.
As previously noted, physical changes to the sarcomeres arranged in series has a negative effect on shortening velocity. This directly affects the power of the muscle since power is dependent on the force-velocity properties of the muscle (Raj et al., 2010). Reductions in power have been noted with decreases in shortening velocity and increases in age (Narici et al., 2005, Thom et al., 2005, Valour et al., 2003). Although muscle strength has been correlated with functional tasks, power has been found to have a stronger correlation with these same tasks (i.e. rising out of a chair and walking) (See Narici et al., 2005 for detailed overview). Because of this power may be more important for dynamic tasks such as fall recovery (Foldvari et al., 2000, Skelton et al., 1999).
In addition to physical changes in muscle morphology, evidence has been made known that upon entering the sixth to eighth decade of life there are neurological
changes occurring that affect the function of motor units and, in turn, affect the physical properties of muscle (Erim et al., 1999, Kamen et al., 1989, Kamen et al., 1995). Motor units (MU) are the pairing of α-motor neurons and the muscle tissue innervated by it (Boron & Bolpaep 2005). As with muscles, age brings about morphological changes in neurons, which affect their signal transduction abilities. This directly affects the
conduction velocities/frequencies at which the nerves operate. MUs are dependent on the properties of the neural component as this affects the firing rate of the muscular component. These age-related changes have been shown to bring about reduced levels of discharge rates (Roos et al., 1997, Narici et al., 2008). Morphological changes in the neuronal tracts as a result of age are not the only reason for a decrease in discharge rates. Other speculated reasons include a coupling with a decline in speed of contractile properties as a form of feedback, and an increase in the amount of large MUs (Roos et al., 1997).
Because the discharge rate of a MU is the firing frequency of the motor neuron (MN) that innervates the muscle, an increase in the number of large MUs directly affects the discharge rate (Kallio et al., 2010, Roos et al., 1997, Dowling, Kamen et al., 1995, Faulkner et al., 1995, Merletti et al., 2002). The idea of MU remodeling ties in
accordingly with an increase in large MUs and a reduction of discharge rates. A study conducted by Merletti et al., (2002) reiterates the notion of muscle fibers changing their fiber types. This is thought to happen through motor unit remodeling in which a fiber is reinnervated with a slower firing nerve. Type II fibers that become deinnervated can
then become reinnverated through axonal sprouting of neighboring slower nerves (Faulkner et al., 1995, Carmeli et al., 1994, Merletti et al., 1992, Merletti et al., 2002, Webber et al., 2009). Reinnervation spares the Type II fiber from cell death, but when this occurs the MU increases in size as a single motor neuron now innervates more muscle fibers. The fiber then remodels to the type of the MU, most likely from Type II to Type I. Merletti et al., (2002) stated that the use of surface electromyography (sEMG) cannot distinguish exactly which fibers are being recorded. However, through the use of multi-array electrodes to conduct sEMG, conduction velocities can be accurately
determined. Therefore, the authors found that average conduction velocity in young and old subjects were significantly different. With these resulting differences in conduction velocity, it has been determined that differences in spectral variables can contribute to decrease of force/torque production and increased fatigue resistance (Merletti et al., 2002).
Similar notions have been shown in previous studies regarding an increase in fatigue resistance in the older adults (Kamen et al., 1989, Kamen et al., 1995, Webber et al., 2009). Fatigue resistance is the likely consequence of a convergence to higher percentage of Type I fibers within the muscle. These morphological changes in
conjunction with changes in the muscle tissue decrease both rate of force production and the strength of the older adult population. Rate of force production limits reactivity to change and strength limits the magnitude of change in balance that can be reversed.
In addition to affecting strength and rate of force development, difference in fiber type also affects power output. As previously mentioned, power is dependent upon the force-velocity relationship of muscles. The differences between fibers in turn may have an effect on power. A study conducted by Widrick et al., (1996) examined this notion directly through examining the force-velocity and force-power properties of Type I and Type II fibers. The authors examined power as a product of force and velocity. Using this relationship, peak power is then dependent on all the parameters that affect the force-velocity relationship. The results of the study revealed that Type II fibers showed greater shortening velocity and higher peak isometric force. Additionally, there was roughly five to ten times a higher power output for Type II fibers than Type I fibers. Because Type I fibers produce less power, neurological changes in the MUs also leads to a decrease in power also increasing the risk for falls (Widrick et al., 1996).
Tendinous Changes
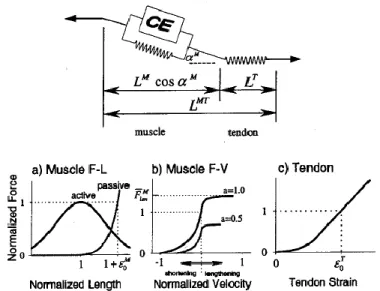
Aging affects muscle fiber and nerve tissue. However, this does not mean connective tissues linking the muscle to the bone are unaffected. Using Hill’s model, connective tissues, i.e. tendons, are represented in the series elastic element as seen in Figure 2.2. The series element is responsible for determining the overall length of the muscle, thus contributing to both the force-length properties and force-velocity properties (Nigg and Herzog 2007).
Figure 2.2: Musculo-tendon contraction mechanics as described by Hill type model. (From Thelen et al., 2003)
Being a key component of a basic muscle function, age-related changes to tendons are important to understand. However, the magnitude of the effect tendinous changes can bring about is limited and inconsistent. Kubo et al., (2003) conducted a study analyzing age-related changes occurring in the quadriceps femoris tendon in women. They were able to find that maximum strain and tendon stiffness decreased with age. Slightly similar results were presented in two separate studies conducted by Karamanidis et al., (2005, 2006). The inconsistencies, though, also begin with these. Karamanidis et al., (2005) presents data showing that stiffness in the quadriceps femoris tendon decreases with age. However maximal strain was not found to be significantly different across age. Simultaneously, maximal strain and stiffness remained unchanged for the Achilles tendon. The second study by the Karamanidis group (2006) found similar results in which the quadriceps femoris tendon stiffness decreased. The same was not found of the Achilles tendon.
These studies confirmed previous thought, as results show age-related mechanical differences, but also bring confusion as to why the Achilles does not
undergo the same changes. However, a study by Onambele et al., (2006) presents itself as being the first to measure in vivo changes in the Achilles. Aging was shown to
produce negative effects on the mechanical properties of the Achilles tendon, which was seen with significant changes in tendon stiffness through changes in Young’s Modulus (Onambele et al., 2006). A study by Kubo et al., (2007) found similar results by finding a decrease in the maximal strain of the Achilles tendon. A third study by
Karamandis et al., (2008) states that the quadriceps femoris tendon loses stiffness, while the Achilles tendon undergoes no significant changes. These conflicting results make it difficult to state that all tendons undergo the same age-related changes. What has been found to be similar across all these studies is a decline in strength of the muscle that is attached to the tendon along with a decline in mechanical properties. From the results of these studies, it can be said with certainty that when a tendon undergoes age-related changes, a loss of muscle strength accompanies it.
This idea has been validated through a study conducted by Chung et al., (2005). Instead of analyzing the physical properties of the Achilles tendon, the study focuses on the reflex system in young adults and older adults. This allowed a different measure of neuromuscular properties through an examination of the Achilles tendon. The study revealed that age-related changes to the tendon affect the reflex properties, which in turn, affect muscle strength and rate of force development. A review by Narici et al.,
(2008) examines the effects of changes in tendons and explains thoroughly the
consequences of a lack of stiffness. Older, less stiff tendons cause 1) a reduction of force through a shortening of the attached sarcomeres; 2) a lack of ability to transmit quickly produced force to bone (Narici et al., 2008). Loss of muscle strength is a prominent factor leading to an increase of falls but not being able to quickly transmit force appears to be just as dangerous.
Additionally to rate of force development and muscle strength, power is also affected by tendon properties. A recent modeling study by Domiere et al., (2007) examines the role of tendon elasticity on muscle force during dynamic tasks. The authors examine tendon elasticity by using two separate models to analyze different dynamics tasks: a rigid and an elastic tendon. During slow controlled tasks tendon elasticity had almost no effect on force production, but during explosive tasks the elastic model produced upwards of 5% more force. Because of the dependence on the speed of the task, it can be hypothesized that tendon elasticity may affect muscle power during dynamic tasks.
This notion was examined recently by Lichtwark and Barclay (2010). They examined the role of tendon compliance on muscle power output and efficiency. They found that more compliant tendons allowed the muscle to generate a greater power output and efficiency as the fiber operated in a more favorable length and velocity during tension. The stiffer tendons forced the muscle fiber to contribute more toward
length changes, limiting power output. Additionally, peak power output was three times larger for compliant tendons than stiffer tendons at the same task frequency. Finally, tendon compliance also affected the activation conditions of the muscle. Compliant tendons allowed for higher power with shorter contractions, bringing less energy into the system improving efficiency. Stiff tendons do not allow for the same conditions.
However power is also dependent upon muscle strength, which decreases with age. Because tendinous changes negatively affect muscle strength, ability to quickly produce force, and muscle power, these changes are also a secondary risk factor which can increase the likelihood of a fall.
Balance Control and Recovery
Postural Control
As discussed in the previous section and well established in the literature, muscle strength, rate of force production, and muscle power decline with age (Grimby et al., 1984, Lexell et al., 1988, Brooke et al., 1969, Morse et al., 2005 Morse et al., 2005, Doherty et al., 1993). The next area to be examined is how these age-related changes are compensated for during stance and the accompanying control of postural stability. Postural control is important to examine not only in light of stance maintenance, but also when recovering and maintaining balance after disruption of quiet stance from a perturbation. By understanding any differences that occur between young and older subjects in simple postural control, the reasoning could then be extrapolated to
differences in mechanisms to recover balance following a perturbation, or at least the conditions that exist at the onset of the perturbation.
Many studies (Shaldon et al., 1963, Rubenstein et al., 1988, Era et al., 2006, Lord et al., 1991, Maylor et al., 1996) have shown that postural sway increases with age. Postural sway can be described as the result of constant feedback being required to overcome the instability present at the ankle joint (Bottaro et al., 2005). Increases in sway may be attributed to reduction in feedback, which can increase falls (Bottaro et al., 2005). Therefore, understanding how the mechanisms of postural control change over age is important. In examining these mechanisms there is an emphasis on
understanding internal changes in muscle pattern activation strategy in addition to absorption of external stimuli via visual, vestibular, and somatosensory pathways. Balance is dependent on sensory feedback as input at least in part controls how the neuromuscular system will react to regain balance (Allum et al., 1985, Allum et al., 1994 Allum et al., 1998 Keshner et al., 1987).
Visual feedback can be considered the most important as it has been shown that removing visual feedback increases postural sway (Teasdale et al., 1992, Praetor et al., 1996). Unless blindness or another severe visual impairment occurs, the older adult population still retains visual feedback in comparison to the younger population. This leads researchers to instead focus on changes in the proprioceptive and vestibular mechanisms (Schmid et al., 2001). A study conducted by Verschueren et al., (2000)
examines the ability of the ankle to sense positional differences and how this changes with age. In the study, the authors examined the ankle because ankle proprioception has been shown by previous studies to add to the problem of balance recovery
(Verschueren et al., 2000). The authors found that with age there is a decreased ability to accurately distinguish ankle joint position during a dynamic activity.
This finding is important as recovering balance from a fall is not a static activity, and in turn, requires voluntary action in combination with reactive elements to
complete the entire recovery. Having a diminished ability to distinguish dynamic changes can slow down the voluntary reaction time. A diminished reaction time was found by Tucker et al., (2008) when examining recovery to a voluntarily induced sway. The authors stated that while this was consistent with the literature (Tucker et al., 2008), this study also showed a decline in reaction time while forcing the body to become fully rigid for postural sway. Additionally, the tasks performed were both static and dynamic. In comparing the two tasks, the dynamic proved to be more challenging to recover balance, most likely due to its complexity.
This finding was also found in a recent study by Liaw et al., (2009). Here, the authors found that as the complexity of a dynamic task was increased, the reaction time slowed, especially for the older adult population. Additionally, it was found that altering the amount of somatosensory cues had undesirable results on the older adult
imbalance in addition to an increase in postural sway. These age-related differences suggest a susceptibility to increased chances of falling. A study conducted by Mackey and Robinovitch (2005) compares the ability to maintain postural steadiness during quiet stance with the ability to recover from a tether release induced perturbation. The study concluded that being able to maintain postural steadiness is not correlated with an ability to recover balance. The authors state that the reason for this may be a difference in control strategy that governs the two individual activities— stance vs. balance recovery.
Laessoe et al., (2007) examined whether young and older individuals use an anticipatory strategy (predictive rather than reactive) to recover from a perturbation versus a compensatory strategy (reactive instead of predictive). This was examined using two different movement strategies; a tilting platform through the frontal plane and horizontal sliding platform through the sagittal plane (see Laessoe et al., 2007). The results found both age groups use a predictive recovery strategy. The key, though, is knowing that a perturbation will be coming such as when stepping on to a moving platform at an airport. Because Mackey and Robinovitch (2005) showed that there is no definite correlation between maintaining postural stance and balance recovery from perturbations, what can be learned from postural sway studies? Although mechanisms for control are different, age-related changes are still relevant. Decrease of reaction time along with a diminished sense of somatosensory inputs does increase risk of losing
balance (Verschueren et al., 2000). However, it appears that assessments involving dynamic recovery of balance may be more relevant to fall prevention research.
Co-contraction
Co-contraction is defined as the simultaneous contraction of agonist and possible antagonist muscles around a joint to hold a position (Mosby Inc). In this study agonistic co-contraction is of greatest concern, i.e. simultaneous contraction of the tibialis anterior (TA) when the gastrocnemius (GAS) and soleus (SOL) are active. Agonistic co-contraction has been studied in different areas (Chambers et al., 2009, Pijnappels et al., 2006, Klien et al., (2001), Kubo et al., 2003, Finley et al., 2007,
Hammond et al., 1988, Okada et al., 2001). To the extent of the older adult population it is concluded that antagonistic co-contraction takes place more in the older adult
population and is responsible for less net force/torque production (Klien et al., 2001, Macaluso et al., 2002, Benjuya et al., 2004). A study by Klien et al., (2001) examines the effects of producible force with age in men during isometric contractions of the arm. This was conducted in order to corroborate previous results that show an increase in activation of antagonist muscles in the knee extensors (Hakkinen et al., 1988, Izquierdo et al., 1999). The results of the study showed an increase in the levels of co-contraction along with an associated decrease of normalized force in the agonistic muscle.
Macaluso et al., (2002) primarily examined the effects of muscle loss and secondarily differences in co-contraction levels between young and older women in isokinetic knee extension. The results of the study found that there was a lower torque
per contractile volume in the older group. Secondarily, this was found to be associated with an increase of co-contraction, as the older group presented an increased amount of co-contraction. The increase in the amount of co-contraction was hypothesized to be the reason behind a decrease in the amount of producible torque in knee extension in older women (Macaluso et al., 2002). However, this hypothesis though has not been revisited by Macaluso et al., (2002). These studies provide evidence for the notion that an increase in co-contraction is associated with a decrease in torque and force.
In addition to a decrease in force and torque production capability, it has been thought that co-contraction could be a control mechanism to maintain postural stability or to recover from perturbations (Cencirini et al., 2010, Benjuya et al., 2004). Benjuya et al., (2004) found the older subjects to use co-contraction around the ankle in order to manage changes in sensory inputs among different testing conditions. This brought the authors to conclude that with deterioration of processing ability, co-contraction of muscle groups becomes a dependent strategy. The reasoning for this is that when opposing muscles across a joint are simultaneously activated, the joint stiffens or locks, becoming more stable (Benjuya et al., 2004, Klien et al., 2001, Allum 2002, Chambers et al., 2009). Even though there is research validating the idea that the older population engage in co-contraction strategies, recently this proven notion has been challenged.
A study conducted by Chu et al., (2009) set out to examine the lower extremity muscle activation patterns and trunk characteristics of stepping and to examine if there
were any differences between middle aged (52.3 + 8.3 years) and young adults (22.1 + 2.6 years). In doing so the authors found that although activation patterns and trunk movements are significantly different between the two age groups, there was no evidence of plantar flexor/dorsiflexor (PF/DF) co-contractions but rather biceps femoris/rectus femoris co-contraction. The authors stated this to be different from previous studies (Polcyn et al., 1998, Halliday et al., 1998), though the earlier studies examined older adults instead of middle aged (See Chu for detailed explanation of studies). Lack of PF/DF co-contraction may show that middle aged adults have not had to completely change muscle control strategies to prevent falls.
An earlier study undertaken by Pijnappels et al., (2006) investigates the muscle activity of young and older adults in response to anticipated perturbations. The authors hypothesized that older adults would show more co-contraction than the young as had been shown in previous literature (PijnappelsA et al., 2005, PijnappelsB et al., 2005, Schillings et al., 2005, Tang et al., 1999). What the authors found, however, was that the younger subjects showed more co-contraction in anticipation of tripping on an obstacle. This then stiffen the joints preventing a fall. As for the older subjects, co-contraction was not seen in the semi-tendinosus and quadriceps muscles as was expected. Instead of a stiffening of the joint, the authors observed that the older adults would rather avoid the obstacle. This then provides insight into a different possible strategy for the older adults, although this strategy is more for an anticipated trip rather than a lesser
as stated prior, it has been found to happen. Although this study did not find co-contraction, it is important to know that this was a perturbation where full body movement was taking place. Balance recovery then required a complex strategy.
To better understand the mechanical effects, Cenciarini et al., (2010) examined young and older subjects’ responses to a perturbation from a control systems
standpoint as a feedback/feed forward model rather than EMG analysis. The authors found that in addition to older subjects showing an increase in stiffness, there is also an increase in the dampening as well. These findings explain that for fast perturbations, the older adults may not be able to respond effectively using this strategy. These findings also verify the results of a similar study (Ishida et al., 2008) which uses a simulation to examine the stiffening of the joint in response to different frequency of perturbation. Ishida et al., (2008) had found that high frequency disturbances would lead to creating an unstable upright stance, which would result in falls. Although these studies make inroads into the possible effects of co-contraction on balance recovery, they do so strictly from a mechanical point of view without examining the neuromuscular effects during the perturbations.
Recovery from small Perturbations: The Ankle Strategy
In studying balance recovery following perturbations, it was found that the body recovers balance differently on the size of the perturbation. Two strategies were
identified in 1985 that lead to recovery of balance: the hip strategy and the ankle strategy (Hwang et al., 2009). The hip strategy incorporates moving the body as a
double segment pendulum at the hip and ankle joints to recover balance following a large perturbation. The ankle strategy revolves around the body acting as single segment pendulum about the ankle joint with the plantar flexors providing the torque required to retain upright stance following a small forward perturbation (Horak et al., 1989, Nasher et al., 1976, Hwang et al., 2009).
As described by Ishida et al., (2008), the model used to simulate perturbations and recovery was that of an inverted pendulum. This model is used to study the ankle strategy. Because the ankle strategy mimics an inverted pendulum, using gait or
multiple stepping is not appropriate. To analyze the kinematics and muscular responses of the ankle strategy, a perturbation must be induced. An accepted method in the literature has been that of a tether-release protocol established by Robinovitch et al., (2002). This protocol involves a subject having a tether attached at the back or waist. The subject leans forward and is held in place by a brake and tether. The tether is then released by an electromagnet inducing a perturbation. This method has been used numerous times in efforts to examine the mechanisms used to recover balance with the ankle strategy (Mackey and Robinovitch 2005, Mackey and Robinovitch 2006, Hsiao 2006, Hsiao et al., 2008, Robonvitch et al., 2002).
In examining balance recovery with the ankle strategy, the importance of underlying factors such as rate of torque development, peak ankle torque, and
more importantly, the ankle strategy has been used to compare young and older adults’ changes to better understand exact methods used to recover from perturbations that will cause a fall (Mackey and Robinovitch 2005, Mackey and Robinovitch 2006, Barrett and Lichtwark, Hwang et al., 2009). As previously mentioned, Mackey and Robinovitch (2005) examined the strategies for postural sway recovery and perturbation induced balance recovery. Using the tether-release protocol and the ankle strategy, they were able to find that the mechanisms where much different compared to postural sway. The presented results impact the clinical setting as it changes how elderly individuals need to be tested in order to properly assess fall risk (Mackey and Robinovitch 2005). A second study by Mackey and Robinovitch (2006) used similar techniques to find that the recovery of balance with the ankle strategy diminishes with age in women. Decreases in peak ankle torque and rate of development of ankle torque were found to be
significantly different between young and elderly. These results reinforce those found by Thelen et al., (1996) in which torque development drops as age increases. Mackey’s results strengthen the notion that along with strength training, agility and balance training is a necessity.
Barrett and Lichtwark (2008) incorporated known age-related neuromuscular changes to simulate balance recovery using the ankle strategy in the musculoskeletal model. Through the simulation, the authors were able to present the effects that age has on balance recovery both singly and combined. The older adult subjects significantly differed in fall risk as a result of the demonstrated changes that occur with aging
(Mackey and Robinovitch 2005, Hsiao 2007, Hsiao and Robinovitch 2008). However, as with the previous co-contraction research, there remains confusion with its role in ankle strategy recovery. Therefore, the goal of this investigation is to examine co-contraction with use of ankle strategy.
Chapter III: METHOD AND MATERIALS Participants
18 healthy women volunteers were selected for the study. A group of nine young women, ages 18 -30 yrs, and nine older, ages 71-83 yrs. Participants were free from any pain or injury, and in order to maintain homogeneity, subjects were sedentary or only moderately active (not exercising vigorously more than three times per week). A health questionnaire was completed to insure that they were free of any neuromuscular or cardiovascular disorders that would exclude them from the study (Appendix A). The group of older subjects underwent a brief medical exam by a physician consistent to one performed prior to allowing a subject to perform a Graded Exercise Test (GXT) for cardiorespiratory function (Appendix B). If the subjects were not cleared for a GXT then they were removed. Additional exclusion criteria: sustaining a neuromuscular injury that had not healed within 4 weeks prior to the collection of data, use of hormone
replacement therapy, pregnancy, regularly smoking, and reporting any balance problems including unexplained falls. The study was approved by the Colorado State University Institutional Review Board and all participants provided written informed consent form (Appendix C).
Figure 3.1: Subject positioning for MVC & RFD trials
Maximum Voluntary Contraction (MVC) Protocol
After measuring height, weight, and ankle to ball of foot length (BOF), subjects performed isometric plantar flexion MVC trials first followed by dorsiflexion MVCs
seated upright with the knee fully extended, ankle in neutral position (Figure 3.1). The foot was strapped to the load cell (Megadyne Inc., LCHD-1K) to keep the ball of foot in place and to allow for dorsiflexion. This position was chosen so the muscle lengths would be similar to
those seen during standing. Disposable bipolar electrodes were placed on the gastrocnemius (GAS), soleus (SOL), and tibialis anterior (TA) to collect the surface electromyogram (sEMG) of muscle activity. Before placing electrodes, skin area of application was prepared by lightly debrading and cleansing with alcohol. Electrodes were placed on the center of the lateral head of the GAS, the center of the lateral exposure of the SOL, and the center of the TA in parallel with the fibers. Upon placement of electrodes and connection of leads, the leg was wrapped using an elastic bandage to lessen the effects of potential movement artifacts. sEMG and load cell signals were collected at 1200 Hz using Noraxon Myosystem 2000 (Scottsdale, AZ) coupled with Vicon Motus 9.1 (Vicon, Centennial, CO). Subjects warmed up muscles by performing the protocol at 25%, 50%, and 75% of their maximum prior to their perceived max effort. Over a three second countdown, the subject was told to ramp up to the required percentage of contraction (25, 50, 75, or
Figure 3.2: Subject positioning for Perturbation Trials with the tethered load pulling posteriorly at the waist
100%), hold the contraction for three seconds, and then relax. Subjects were verbally encouraged during maximum effort trials. A minimum of three max effort trials were performed by each subject. Rest periods between trials were offered to minimize fatigue. Additional trials were executed if performance improved throughout the first three trials.
Rate of Force (RFD) Development
Subjects performed ballistic isometric contractions following the MVC trials with the same setup to estimate rate of force development. Over a three second countdown the subjects were told to remain completely relaxed. The subjects would then plantar flex or dorsiflex in a ballistic motion reaching peak force as quickly as possible, hold for a second, and then release. A minimum of three trials were performed for each subject. Rest periods between trials were offered to minimize fatigue. Additional trials were performed if it was noticed that the subject did not remain completely relaxed prior to initiation of contraction or if performance continued to improve throughout the first
three trials.
Perturbation
Upon completion of MVC and RFD trials, each subject then
underwent balance recovery trials. A tether-release protocol similar to that used by Robinovitch et al., 2002 and Mackey and Robinovitch 2006 was utilized to assess balance recovery
with the ankle strategy (Figure 3.2). A construction safety harness was worn with overhead security attachment to prevent any falls. A separate belt was then worn around the waist in order to attach the horizontal load cable. The cable had an
electromagnet at the end holding the load. The subject leaned forward at the ankle but not excessively, while remaining as relaxed as possible. At an unknown time within a 10 second window, the magnet would release the weight inducing a perturbation. The subjects then recovered balance using a prescribed ankle strategy; remaining rigid between the knees through the neck not taking any steps. They were allowed to raise their heels in order to recover as long as rigid posture was maintained. For uniformity between subjects, the hands were placed at the hips and each subject was barefoot. Four trials were performed using 80% of their maximum recoverable load. The maximum recoverable load was determined through practice trials with increasing loads. Upon failing to recover balance three consecutive times at a given weight, the highest successful recovery was determined to be their maximum recoverable load. The load was increased by 0.5 kg following each successful practice trial.
As with the MVC and RFD trials, sEMG data were collected. Ground reaction forces (GRF) were also sampled under each foot using Bertec 4060 force platforms (Columbus, Ohio). Kinematics of the right side sagittal plane was optically captured with retro-reflective markers placed at the right fifth toe (metatarsal), ankle (lateral
malleolus), heel (calcaneus), knee (lateral femoral epicondyle), hip (greater trochanter of the femur), shoulder (humeral head), and the head (temple). All signals sampled
synchronously through the Motus system described previously. The electromagnet release was triggered by the data collection system, so the exact time of release was known relative to the recovery event.
Data Analysis
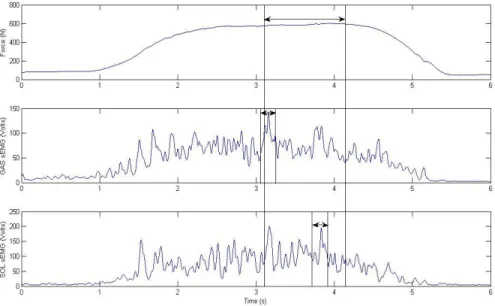
sEMG data were high-pass filtered to remove any movement artifacts, demeaned to remove any DC offset, full wave rectified, and finally low-pass filtered using a recursive 4th-order Butterworth filter at 15hz (see Figure 3.3 middle and bottom). Similarly the 1200 Hz sampled analog data gathered from the load cells and force platforms were also filtered to remove high frequency noise with the same Butterworth filter at 15 Hz. The sagittal plane optical data sampled at 60 Hz was similarly low pass filtered at 15 Hz. Because of the difference in sampling rates, the kinematic data were up interpolated to match the sEMG and force data.
Figure 3.3: Exemplar force, GAS, and SOL activity from a plantar flexion MVC trial with 1 sec region of highest force production and 100ms of highest sEMG activity highlighted. Note: Maximum EMG activity did not have to occur during the 1 sec force window. Dorsiflexsion trials were treated similarly with maximum TA activity being extracted.
From the MVC trials, maximum force was calculated over a 1 second period using a moving average window for both plantar flexion (PFF1smax) and dorsiflexion
(DFF1smax) (Figure 3 top). The averages of the GAS, SOL, and TA sEMG over this 1 second
period were calculated for later assessment of co-contraction (GASPFMVC1s SOLPFMVC1s, TAPFMVC1s & GASDFMVC1s SOLDFMVC1s, TADFMVC1s).
The MVC of each muscle used for normalization purposes was located using a 100ms moving average window (GASPFMVC100ms, SOLPFMVC100ms,TADFMVC100ms)
(Figure 3.3 middle and bottom). Plantar flexion trials determined MVCs for the GAS and the SOL while dorsiflexion determined MVC for the TA. From the RFD trials an average slope of force was calculated over the first 100ms following onset of force production
(PF/DFRFD100) (Figure 3.4 top). Onset of force production was determined by when the
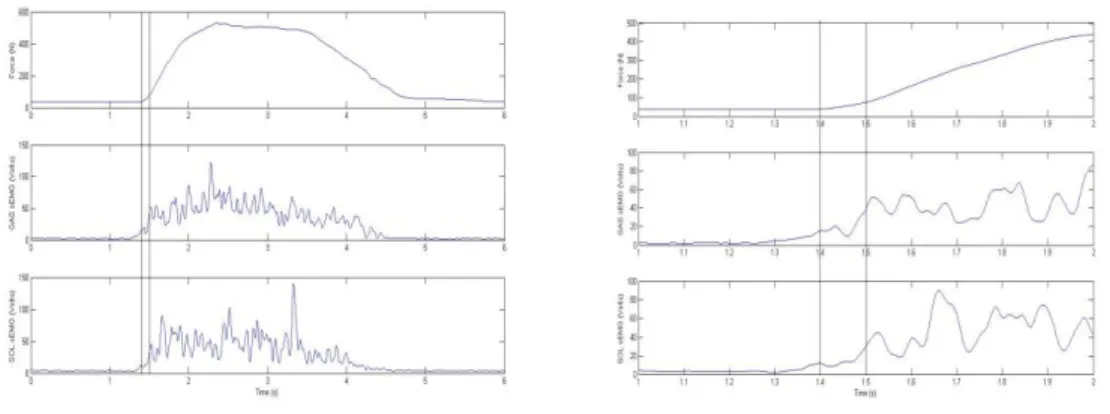
baseline force surpassed baseline force + 5N (Robinovitch et al., 2002). sEMG data were simultaneously averaged for each muscle over this time interval from, plantar flexion or dorsiflexion trials (GASPFRFD100, SOLPFRFD100,TAPFRFD100 & GASDFRFD100, SOLDFRFD100, TADFRFD100, respectively)(Figure 3.4 middle and bottom).
Figure 3.4: (Above left) Exemplar force, GAS, and SOL processed sEMG activity from a plantar flexion RFD trial. Lines represent 100ms window from which maximum RFD100 occurs. (Above right) Closer
examination of 100ms window. Dorsiflexsion trials were treated similarly with TA activity being extracted.
Sagittal plane inverse dynamics was performed on the perturbation trials using the combined GRFs and the foot/ankle kinematics to determine the time varying net ankle torque (Ta):
Ta=Fahrah+Favrav+GRFhy-GRFv x+ Icm*α
where Fah was the horizontal component of ankle reaction force, Fav the vertical
component of the ankle reaction force, GRFh the horizontal GRF, GRFv the vertical GRF, x and y the respective perpendicular moment arms to the center of mass of the foot for
the GRFs, rah and rav the respective perpendicular moment arms to the center of mass of
the foot from the ankle, Icm the moment of inertia about the center of mass of the foot,
and α the rotational acceleration of the foot about the center of mass. Center of mass location, mass, and Icm of the foot were estimated using the modified Dempster
relationships from Winter (2005).
Prior to release of the weight, a 500ms sample was averaged to find the baseline torque (Ti)and initial sEMG activity (GASi, SOLi, TAi.). After weight release, onset of
torque was determined when the torque was greater than Ti + 5N. Onset of sEMG was
determined when activity greater than baseline activity + 5*SD was maintained (Figure 3.5).
Using the onset of torque, additional variables of interest were calculated from the perturbation trials. An RFD estimate over the first 100ms following torque onset (RFDP100), sEMG average over the period of RFDP100, initial torque peak(TIP), and a global maximum torque value (Tmax), ankle torque onset time relative to weight release (Δt)
and finally the electromechanical delay between onset of EMG activity and ankle torque production (GASEMD, SOLEMD). Additionally, lean angles, body center of mass relative to ankle with respect to the vertical, were assessed prior to weight release (θi) and
Figure 3.5: Exemplar ankle torque, GAS, SOL, and TA sEMG activity during a perturbation trial. Lines represent the different bins: 50ms, 1st 100ms, 2nd 100ms, 3rd 100ms.
To analyze muscle activity related to the reaction and recovery of balance from perturbation, sEMG averages were calculated in three 100ms bins for all three muscles starting 100ms after weight release along with a 50ms bin immediately after weight release. The 50ms prior to the first 100ms bin was skipped because this was the region where muscle activation in response to the perturbation begins and was highly variable (Figure 3.5).
With multiple trials were executed for each protocol, the numerical data used for statistical analysis was specifically chosen. From the MVC data, the values chosen for analysis were determined by the largest value of the PFF1smax and DFF1smax as well as the
largest GASPFMVC100, SOLPFMVC100,TADFMVC100. The RFD trials with the largest
PFRFD100 or DFRFD100 were chosen for assessment of this test. From the perturbation
data, the 4 trials at 80% of maximum load were averaged to determine a representative response.
The muscle activities during PFF1smax & DFF1smax, PFRFD100 & DFRFD100 along with
the muscle activity during the five bins of the perturbation trials (prerelease, 1st 50ms, 1st 100ms, 2nd 100ms, 3rd 100ms) were normalized by the 100ms of the highest activity from the MVC trials and converted to a percentage. Additionally the force data collected from the load cell were converted to torque using the subjects BOF length. These
torques along with the torque collected from the perturbation trials were normalized by dividing by the product of height and weight of each subject.
Statistical Analysis
Before any statistical comparisons were performed, the data set were examined for outliers within each variable. All tier 1 outliers (significant) were removed. This typically meant no more than one subject from each group for any given variable. Independent-sample double-sided T-tests were used to compare most variables between young and older adults. To examine the perturbation sEMG, a 2x5 (group x time) repeated measure ANOVA was used for each muscle group. If significance was found in the interaction between groups, appropriate ANOVAs with Bonferroni post hoc tests were performed to explore the differences.
Five subjects from each group came on a second day to repeat the data
day to day repeatability. All statistics were performed in PASW statistics 18 (SPSS, Inc, Chicago IL). Statistical significance was set at p<0.05.
Chapter IV: RESULTS
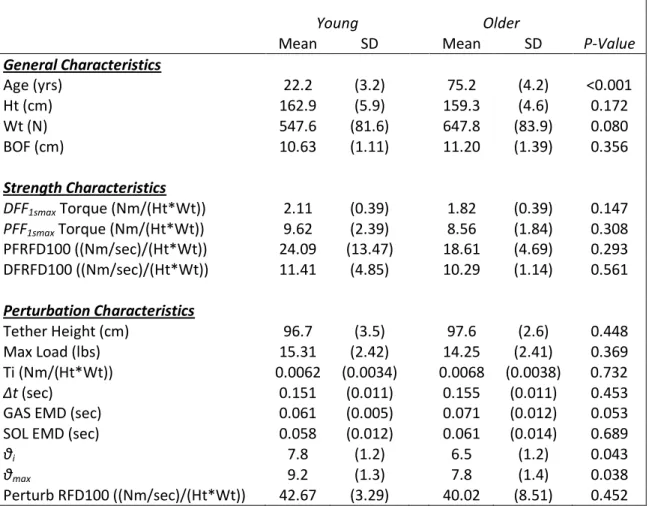
Besides age, there were no differences between the groups in the general
characteristics of height (Ht), weight (Wt), and BOF length (Table 1). It is important to note that while the participants of both groups were classified as sedentary to moderately active based on intensity level, most were quite active walking or cycling on a regular basis.
Table 1: Group comparisons of descriptive variables
Young Older
Mean SD Mean SD P-Value
General Characteristics Age (yrs) 22.2 (3.2) 75.2 (4.2) <0.001 Ht (cm) 162.9 (5.9) 159.3 (4.6) 0.172 Wt (N) 547.6 (81.6) 647.8 (83.9) 0.080 BOF (cm) 10.63 (1.11) 11.20 (1.39) 0.356 Strength Characteristics DFF1smax Torque (Nm/(Ht*Wt)) 2.11 (0.39) 1.82 (0.39) 0.147 PFF1smax Torque (Nm/(Ht*Wt)) 9.62 (2.39) 8.56 (1.84) 0.308 PFRFD100 ((Nm/sec)/(Ht*Wt)) 24.09 (13.47) 18.61 (4.69) 0.293 DFRFD100 ((Nm/sec)/(Ht*Wt)) 11.41 (4.85) 10.29 (1.14) 0.561 Perturbation Characteristics Tether Height (cm) 96.7 (3.5) 97.6 (2.6) 0.448 Max Load (lbs) 15.31 (2.42) 14.25 (2.41) 0.369 Ti (Nm/(Ht*Wt)) 0.0062 (0.0034) 0.0068 (0.0038) 0.732 Δt (sec) 0.151 (0.011) 0.155 (0.011) 0.453
GAS EMD (sec) 0.061 (0.005) 0.071 (0.012) 0.053
SOL EMD (sec) 0.058 (0.012) 0.061 (0.014) 0.689
θi 7.8 (1.2) 6.5 (1.2) 0.043
θmax 9.2 (1.3) 7.8 (1.4) 0.038
Perturb RFD100 ((Nm/sec)/(Ht*Wt)) 42.67 (3.29) 40.02 (8.51) 0.452
Isometric sEMG trials
From the MVC and RFD trials there were statistically significant differences based on age considering the normalized DFF1smax, PFF1smax, PFRFD100 and DFRFD100 parameters (Table 1).
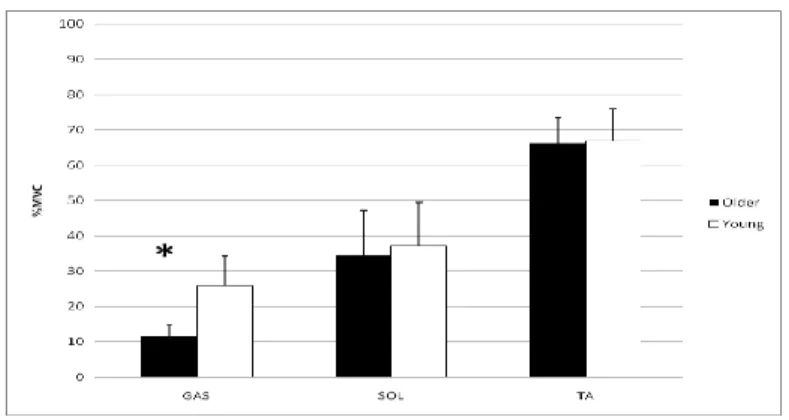
There were no significant differences in the normalized sEMG activity between groups for GAS(p=0 .557), SOL (p=0.610), and the antagonistically co-contracting TA (p=0.725) from the PFMVC trials (Figure 4.1). During the DFMVC trials there was significantly more co-contracting GAS activity in the young (p=0.001), but there were no differences between the SOL activity (p=0.658) or the TA activity (p=0.873) (Fig 4.2).
Figure 4.3: Normalized 1 second averages for GAS, SOL, TA during PFMVC trials.
Figure 4.4: Normalized 1 second averages for GAS, SOL, TA during DFMVC trials. (*p<0.05 between young and older adults)
The normalized RFD100 torque also showed no differences between the groups for PF or
DF (See Table 1). The normalized sEMG values for the GAS, SOL, and TA over PFRFD100
showed no significant differences between groups (p=0.452, p=0.109, p=0.319,
respectively) (Figure 4.3). There were also no significant differences between groups in the GAS, SOL, and TA (p=0.561, p=0.539, p=0.776, respectively) during the DFRFD100
(Figure 4.4).
Figure 4.5: Normalized sEMG for GAS, SOL, TA activity from PFRFD trials.
Perturbation Trials
The sEMG associated with RFDP100 for the GAS, SOL, and TA showed no difference
(p=0.476, p=0.670, p=0.139, respectively). The maximum recoverable load, along with the tether height, showed no difference between groups nor did Ti (Table 1). However, though, the
electromechanical delay (EMD) between the ankle torque onset and muscle activity onset was not significantly different between the SOL it approached significance for the GAS with the young slightly shorter than the older adults (Table 1). The initial and maximum lean angles did show a significant difference between the two groups with the young leaning slightly more forward in both cases (Table 1).
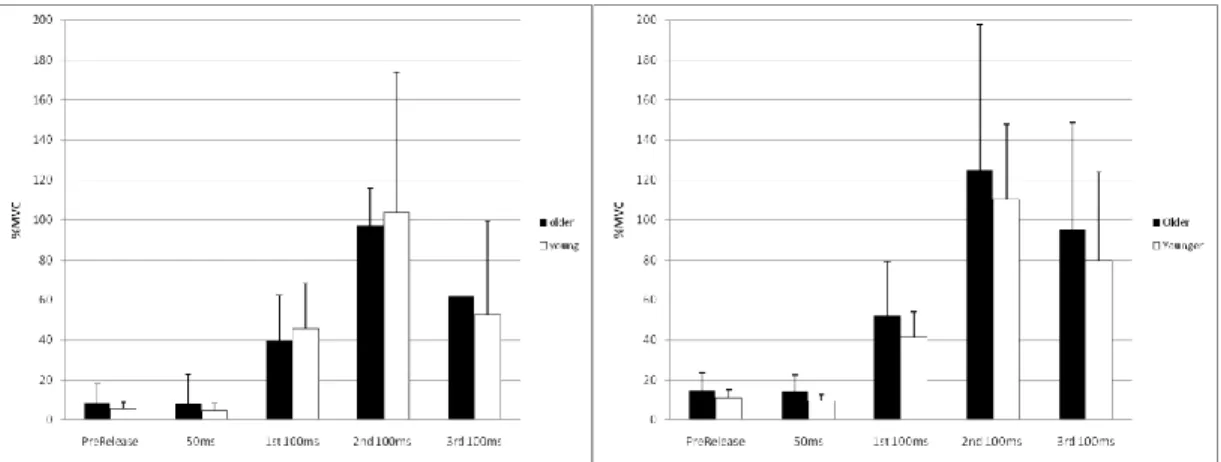
Figure 4.7: RFD sEMG for GAS, SOL, and TA activity from perturbation trials. For the GAS sEMG activity the 2x5 MANOVA analysis revealed no significant interaction between time and age (p=0.646) (Figure 4.6). However, the main effects showed a significant difference between each bin across time (p<0.001), but no difference between age groups (p=0.515). The Bonferroni post hoc performed on the combined groups with respect to time showed that each bin was uniquely different from each other (p<0.001) except for the prerelease values and the 50ms bin (p=1.00).
For the SOL sEMG activity the 2x5 MANOVA analysis showed the same results; no significant interaction (p=0.947) with main effects significant difference between the bins across time (p<0.001) but no difference between age (p=0.434) (Figure 4.7). The Bonferroni post hoc test also showed that each bin was uniquely different from each other (p<0.001) except for the prerelease values and the 50ms bin (p=0.440).
Figure 4.8: GAS activity from perturbation trials Figure 4.9: SOL activity from perturbation trials
Figure 4.10: TA activity from perturb trials. (*p<0.05 between young and older adults)
For the TA sEMG activity the 2x5 ANOVA analysis showed slightly different results. A significant interaction existed between group*time (p<0.001). The simple main effects at each time point comparison between the young and older showed a significant difference for the 3rd 100ms bin (p=0.001) where the older adults had greater
activity but no other (p>0.098). For the young adults, the Bonferroni post hoc test revealed that the bins are not uniquely different from each other (p>0.113). For the older adults, the Bonferroni post hoc test revealed that in comparing the prelease values to all the other bins there was significance at the 1st 100ms (p=0.012) and the 3rd 100ms (p=0.001), where there was a decrease followed by an increase in activity. Only comparison of the 3rd 100ms bin to the other bins showed a significant increase compared to all others (p<0.025).
Repeatability Analysis
The Intraclass correlation analysis showed that there was high repeatability in the measurement of the descriptive variables laid out in Table 1 (Cronbach’s
alpha>0.80). However for the sEMG measurements there was relatively poor
repeatability in all muscles. The sEMG of the GAS showed the highest repeatability for MVC, RFD, and perturbation trials (Cronbach’s alpha=0.617 to 0.883). The sEMG of the SOL and the TA did not show the same level of repeatability (Cronbach’s alpha=-0.035 to 0.634).
Chapter V: DISCUSSION
This project set out to analyze the effects that age has upon ankle strategy driven balance recovery from small perturbations. More specifically, the main interest was in examining the level of activity of antagonistic co-contraction from the TA before and during the balance recovery. Additionally comparisons of strength and muscle activation were examined through the use of isometric MVC and RFD trials to assess their role in the recovery process. The isometric trials were also examined as a possible muscle activity predictor of the recovery behavior.
The use of isometric MVC trials showed that there were no differences in MVC sEMG activity for plantar flexion (Figure 4.1). The lack of torque differences in plantar flexion suggests that there is similar strength in the muscles. This is different from previous findings in which plantar flexion strength was thought to decline with age (Kubo 2006, 35 38 from Kubo 2006). However the difference in the GAS activity during dorsiflexion suggests that younger adults may actually have stronger TA muscles because there was no net torque production difference seen. This lack of decline in DFMVC force has also been shown by Simoneau et al., in which they show no changes in DFMVC torque with age. Simoneau et al., also made mention that their results were contradictory to those of two previous studies (Lanza 2003, van Schaik 1994) which also evaluated DFMVC torque and age with both male and female subjects. However as in
the study conducted by Simoneau et al., all the subjects in this study were of the same sex and produced similar results suggesting that DF strength does not decline with age, but the muscular mechanisms change.
The findings from the RFD trials showed no differences in muscle activation or torque for both plantar flexion and dorsiflexion. This suggests that ability to rapidly produce force also does not decline with age again contradictory to that of the literature. Thelen et al., (1996) found substantial differences in the ability to produce torque between young and older adults as well as declines in MVC. Thelen concluded that the declines found in torque development would also affect balance recovery of older adults.
From the perturbation trials no differences were seen in the maximum
recoverable load, the rate of torque production, or in the muscle activation during that same time period between age groups. This could imply that the age-related
neuromuscular changes have not affected the torque producing capabilities of the muscles. However, the approaching significant difference between the EMD of GAS (See Table 4.1) implies that a decline in neuromuscular pathways may be its initial stages. Again, this goes against the literature which has shown declines by the 6th decade of life (Vandervoort et al., 1986, Kallio et al., 2010). Although no differences were seen during the initial development of torque, the bin analysis revealed more antagonistic TA co-contraction for the older adults. This, therefore, presents that there is a presence of
antagonistic co-contraction which in turn will produce an opposing torque which needs to be overcome in order to appropriately recover balance. The occurrence of more antagonistic co-contraction during the dynamic recovery trials combined with a lack of difference in the isometric trials dissipates the notion that the static trials could predict dynamic muscle activation.
The differences shown between the results of this study and the current
literature in respect to decline of muscular strength and rate of force development may be due to the physical capabilities of the older adults. In descriptive comparisons with the young subjects, the older subjects are similar in height, weight, and ankle to ball of foot length though weight approaches a difference (p=0.80). Although classified as sedentary to moderately active by level of intensity, the group of older adults reported to be active, i.e. walking or cycling on a regular basis. This group was also screened and deemed healthy enough to perform the demanding GXT. The exceptional health of the older adults most likely minimized the differences observed. As stated, the older adults were similar to the young in strength and muscle activation during the isometric trials except for GAS activity during isometric DFMVC in which the younger had a higher slightly level of activity. This could be the result of stronger TA within the young adults then requiring the GAS to produce more torque to compensate. The younger adults could then be activating more motorneuron pools which in turn may explain the increase in activity without any changes in net torque.
The evidence of antagonistic co-contraction in older adults is similar to that found by Klein et al., (2001), Macaluso et al., (2002), and Benjuya et al., (2004) wherein each study presented evidence of antagonistic co-contraction for the respective motions being analyzed (i.e. arm flexion, knee flexion). However the co-contraction presented in this study is strictly that of the TA which was also presented by Benjuya et al., (2004). What is different from previous studies seeking to examine co-contraction (Klein et al., 2001, Macaluso et al., 2002, Benjuya et al., 2004, Chu et al., 2009, Pijnappels et al., 2006) is the use of isometric MVC trials along with the collection of sEMG activity during the respective motion. The use of the isometric MVCs allows for a standard in which all subjects can be compared accordingly.
More importantly in comparison to the literature is the dimension of balance recovery using the ankle strategy. This study used the collection of sEMG during the perturbation trials along with kinetic and kinematic responses to assess changes between groups. Much of the ankle strategy balance recovery literature (Robinovitch 2002, Mackey and Robinovitch 2005, Hsiao 2007, Hsiao and Robinovitch 2008) analyzes the effects of age on balance recovery through the measurements of primarily
kinematic and kinetic responses, i.e. torque generation and recovery angles. The results from the kinematic parameters were similar to that of previous ankle strategy literature, especially when maximum load vs. 80% recoverable load is taken into account. Ankle torque onset times were fairly similar. Prerelease torque values were less as anticipated and rate of torque development was comparable. Lean angles followed the same