The effects of environmental uncertainty conditions on
organisational innovativeness and performance of SMEs.
Blekinge Institute of Technology School of Management
Master programme in Entrepreneurship
Authors: Lana Abdallah Mattias Persson Tutor: Urban Ljungquist, PhD Submission date: 9/6-2014
2
Abstract
Innovativeness is considered to be an important factor for firm’s survival and their ability to compete in today’s market. Therefore, researchers have become more interested in studying innovativeness and its drivers. Studies have also showed that there’s a positive relationship between environmental uncertainty and innovativeness. Organisations are responsive to turbulent environments through innovativeness in order to stay competitive and improve performance.
The purpose of this thesis is to rank critical environmental factor’s effect on organisational innovativeness of small and medium enterprises in Sweden, through investigating the impact of market/demand turbulence and technological turbulence on innovativeness. Additionally, we want to examine the relationship between innovativeness and business performance, as well as the indirect relationship between environmental uncertainty and performance. Based on previous literature, we have developed hypotheses and proposed a research model to study the formulated problems. Data for the study were collected from 50 SMEs in Sweden, through a survey with well-known scales and were analysed using regression analysis.
The results of the study, reveal that environmental uncertainty has a positive effect on the innovativeness of SMEs. In addition, technological turbulence showed to have a positive significant effect on an SME’s innovativeness; however, contrary to general belief,
market/demand turbulence did not have any prominent effect. Our findings also proved that innovativeness have a strong positive impact on business performance, and that only
technological turbulence have an indirect influence on performance through innovativeness. This study aimed to contribute to the management a better understanding, of which conditions of environmental turbulences SMEs should adapt to, in order to increase their level of
innovativeness.
Keywords: environmental uncertainty, organizational innovativeness, performance, market/demand turbulence, technological turbulence, SMEs.
3 Table of Contents
1. Introduction ... 6
1.1 Background ... 6
1.2 Problem Discussion ... 7
1.3 Problem Formulation and Purpose ... 8
1.4 De-Limitations ... 8
1.5 Thesis Structure ... 9
2. Literature Review ... 11
2.1 Innovation and Organisational Innovativeness ... 11
2.2 Environmental Factors ... 12
2.3 Environmental Uncertainty and Organisational Innovativeness ... 13
2.4 Organisational Innovativeness and Performance ... 14
3. Theoretical Framework ... 16
3.1 Hypotheses ... 16
3.2 Proposed Research Model ... 18
4. Method ... 19
4.1 Methodology... 19
4.2 Research Approach ... 19
4.3 Survey and Measurements... 21
4.4 Sample Data and Collection ... 21
4.5 Unit and Level of Analysis ... 22
4.6 Validity and Reliability ... 22
5. Empirical findings ... 24
5.1 The Swedish Economy and SMEs ... 24
5.2 Data Collection ... 25
5.3 Exploratory Factor Analysis ... 28
5.4 Hypothesis Testing ... 30
6. Analysis and Discussion ... 32
7. Conclusions ... 34
7.1 Limitations ... 34
7.2 Conclusions ... 34
7.3 Implications for Research & Practices ... 35
References ... 36
Appendices ... 41
Appendix A. ... 41
4
Appendix C ... 46
Appendix D ... 48
Appendix E ... 49
5
List of Figures
Fig. 1 - Thesis Structure 10
Fig. 2 - An illustration of the Proposed Research Model 18
Fig. 3 - SBA assessment for Sweden on Skills and Innovation 24
Fig. 4 - SME category overview 25
Fig. 5 - Overview of industry type percentages 26
List of Tables
Table. 1 - Items for Innovativeness, Market/demand turbulence, Technological turbulence and Innovation performance 44Table. 2 - Data Descriptive Statistics 27
Table. 3 - Factor Analysis Results 29
Table. 4 - Regression analysis of environmental uncertainty on innovativeness 30
Table. 5 - Regression analysis of market turbulence on innovativeness 30
Table. 6 - Regression analysis of innovativeness on innovation performance 31
Table. 7 - Regression analysis of environmental uncertainty on innovation performance 31
Table. 8 - Regression analysis of market turbulence on innovation performance 31
6
1. Introduction
1.1 Background
Entrepreneurship has long been the talk of the decade and everyone’s sudden interest. It is a new phenomenon nowadays that everyone is trying to achieve. Although it seems appealing to most, it’s a very risky accomplishment. Lazear best describes entrepreneurs as individuals who combine people together with physical capital and ideas to create new products or improve existing ones at a lower or competitive cost (Lazear, 2005). According to Amit et al. “Entrepreneurship can therefore be defined as the process of extracting profits from new, unique, and valuable combinations of resources in an uncertain and ambiguous environment.” (Amit et al., 1993, p.2). Amit et al. added that entrepreneurs are the individuals who innovate and create business opportunities by assembling and coordinating new combinations of resources to extract the most profits from their innovations in an uncertain environment.” (Ibid). Innovation is considered to be important for firms’ long term success in uncertain environments.
Innovation can be seen as the outcome of innovativeness, where innovativeness is seen as the process leading to innovation (Pesämaa et al., 2013). Organisations that support
innovativeness will be able to better understand customers’ needs, by faster processing information to develop new products, services or processes to reach competitive advantage (Jiménez-Jiménez and Sanz-Valle, 2008). Through managing the firm’s dynamic capabilities can organisations maintain long term performance in environments of fast innovation and globally widespread sources of innovation (Teece, 2007). Lately, globalization has encouraged firms to adapt to the phenomena of mass innovation, bringing out rapid and disruptive changes. This has led to younger and smaller firms leveraging on innovation in order to create economic wealth (Veeraraghavan, 2009).
Amit et al. (1993) stated that entrepreneurs try to increase their profits in uncertain
environments by being innovative. But Buganza et al. stated that innovation under conditions of environmental uncertainty can be a major challenge for firms (Buganza et al., 2009). Environmental uncertainty can be related to environmental turbulences, which are defined as unpredictable markets and technological changes within an organisation’s industry.
Environmental turbulences tend to increase the uncertainty for the development of new products (Calantone et al., 2003). Two environmental turbulence conditions that an
organisation can face are market/demand turbulence and technological turbulence (Jaworski and Kohli, 1993). This implies that organisations should therefore support innovativeness when facing turbulent environments in order to improve performance (Tsai and Yang, 2013). SMEs are seen as the engines of the European economy, and they are vital for the
competitiveness and employment in the EU. According to the European Commission (2005), SMEs are defined as follows: “The category of micro, small and medium-sized enterprises (SMEs) is made up of enterprises which employ fewer than 250 persons and which have an annual turnover not exceeding 50 million euro, and/or an annual balance sheet total not exceeding 43 million euro”. This definition is in line with other studies researching SMEs (Durst and Edvardsson, 2012).
7
SMEs are the source of jobs, entrepreneurial skill and innovation (European Commission, 2005). Božić and Radas also stated that SMEs are important for creating growth and
employment, both in developing and developed countries. Their study shows that SMEs that implement new or changed corporate strategies increase their probability of radical
innovation, which in turn can lead to better performance (Božić and Radas, 2009). Innovativeness can play an important role for firms in conditions of environmental
uncertainty, thus the authors plan to study the effects of environmental uncertainty conditions on organizational innovativeness and performance of SMEs.
1.2 Problem Discussion
Innovativeness has become a key component for business survival and competition in today’s uncertain marketplace (Uzkurt et al., 2012). Many researchers are becoming interested in examining innovation to better understand its drivers and effects. According to many studies, environmental uncertainty is a main driver for organisational innovativeness. Turbulent environments cause firms to respond to uncertainty by innovating in order to survive (Uzkurt et al., 2012). Firms need to reconfigure their capabilities with changing markets and
technology to stay in line with the customer needs (Teece, 2007). Businesses need to innovate continuously in highly turbulent markets for them to outstand competition (Hutt and Speh, 2010). Droge’s et al. results show that innovativeness was positively related to new product success in conditions of high environmental turbulence, which in turn, can improve
performance of organisations (Droge et al., 2008).
There are several environmental factors that contribute to environmental uncertainty and affect organisational innovativeness. However, a previous study of Uzkurt et al. (2012) found that there’s a positive relationship between market and technological turbulences and business innovativeness, where an increase in these turbulences will increase innovativeness.
Market/demand turbulence refers to a business’s marketplace variability and uncertainty (Helfat et al., 2007). Technological turbulence relates to the technological change and development of the firm’s products and processes (Jaworski and Kohli, 1993). Our research will focus on these two environmental factors for the study, since they are important
conditions in today’s marketplace. Many businesses with great ideas might fail soon if they don't adapt to the continuous changes of the environment. Organisations must survive environmental turbulences by responding to them by innovation (Uzkurt et al., 2012). Studies have also shown a connection between organisational innovativeness and business performance. The study of Hult et al. has shown that innovativeness is an important factor for the performance of organizations (Hult et al., 2004). The adoption of innovation is generally intended to contribute to the performance or effectiveness of the firm (Damanpour, 1991). The results of Man’s study on SMEs also shows a positive effect of innovativeness on performance (Man, 2009). Kyrgidou and Spyropoulou prove that organisational
innovativeness helps in surviving competition; thus, leads to competitive advantage and enhanced performance (Kyrgidou and Spyropoulou, 2013).
According to Uzkurt et al. (2012), market and technological turbulences showed a positive relationship with organisational innovativeness of SMEs in the Turkish market. Their study seeked further research in the same field but in other countries, for a comparison of results to increase understanding on the cultural context. Thus, we would like to study this effect in the
8
Swedish market. We also would like to add the factor of business performance to our model, to further study the relationship between innovativeness and performance and the effect of these environmental uncertainty factors on performance.
Findings can help the management to better understand what types of turbulences that SMEs need to adapt to, to increase their level of innovativeness, and to motivate them to redesign their capabilities to improve their performance.
1.3 Problem Formulation and Purpose
Our previous discussion on environmental turbulences leads us to the research question: “How does environmental uncertainty (market/demand and technological turbulences) affect organisational innovativeness?” This relationship is proved to have positive impacts in the Turkish market; hence, our study will be used to compare our results with theirs to see if these dynamic changes have dissimilar on two distinct markets.
Previous research has shown a significant effect of innovativeness on business performance. Thus, we added this relationship to our model to examine it on SMEs in the Swedish market. This relationship will be used to contribute a better understanding of the importance of novelty on business success. Our second research question is: “How does organisational innovativeness affect performance?”
While it is generally agreed that innovation contributes to business performance, relatively little is known about the drivers of innovativeness and how those drivers operate via
innovativeness to collectively influence performance. Therefore, our third research question is: “How does environmental uncertainty indirectly affect performance?”
The purpose of this study is to distinguish the impact of critical environmental factors on organisational innovativeness of (SMEs) firms in Sweden. Our results will be used to discover any comparisons between the Turkish and the Swedish markets. Additionally, this study aims to examine any hidden effects of environmental turbulences on business performance, through innovativeness.
1.4 De-Limitations
In this thesis we have chosen to study Small-to-Medium enterprises in the manufacturing sector and excluded large companies, as they have a big advantage in comparison to SMEs when it comes to resources. Micro SMEs were also ignored from our sample as we assume that these firms have a lower degree of innovativeness due to their small size; such as small groceries. A previous study made by Uzkurt et al. (2012) proved that competitive intensity showed no direct relationship with organisational innovativeness; therefore, we have deselected this factor from our study of environmental turbulences.
9 1.5 Thesis Structure
This section includes brief descriptions of the following chapters, as we present what to expect out of the thesis. We have started by introducing the reader to the background and problem discussion of the thesis, with regard to existing research in the literature review. We will also present the methodology chosen for the thesis, as well as the empirical findings. Next, we will present the analysis along with the discussion and then the conclusions. Last, a brief overview of the limitations of the thesis and future research suggestions.
In the introduction chapter the reader is first briefed on the background of entrepreneurship, innovation, and environmental uncertainty and their importance. Following is the discussion where we argue for the link between innovativeness and environmental uncertainty and their effect on performance. This is summarised in the problem formulation, where the questions and purpose of the study is presented.
The literature review will give the reader an overview of existing research within the scope of this thesis. We will start with the definitions of innovation and organisational innovativeness and their benefits for organisations. Then, readers are familiarized with environmental factors and the relationship between environmental uncertainty and organisational innovativeness. Market/demand turbulence and technological turbulence are presented and explain how different conditions of environmental uncertainty can affect firm’s innovativeness. Subsequently, the relationship between organisational innovativeness and performance is described, and enhanced focus on innovativeness contributes positively to performance. After assessing different angles of the existing literature, a model is proposed in the
theoretical framework chapter, and research hypotheses were composed. These hypotheses will be tested later in the analysis chapter.
The quantitative method is used in this study and is described in the methodology section. We used a survey, where established scales for capturing data about each of the factors were adopted from previous studies. The survey was then sent out to SMEs in the manufacturing sector in Sweden. We also described how we have dealt with validity and reliability to make the study trustworthy.
In the empirical findings chapter, the survey data was statistically analysed by performing Cronbach’s Alpha test and exploratory factor analysis using IBM SPSS software. Finally, regression analysis was used to test our research hypotheses.
10
In the analysis and discussion chapter, the numerical results were analysed and the hypotheses statements were evaluated as either supported or rejected. The results were then related to theory and summarised in a table.
In the conclusion chapter, we present our results and deductions and give a brief overview of the study. Finally, the limitations and future research chapter acknowledges the restrains of our study and gives suggestions for future research based on our experiences.
Fig 1. Thesis Structure Introduction Literature Review Theoretical Framework Method Empirical Findings Analysis and Discussion Conclusions
11
2. Literature Review
2.1 Innovation and Organisational Innovativeness
An important factor to the success of businesses is their capacity to innovate. Innovativeness is a firm’s capability to employ innovation; thus, by the introduction of new processes, products, or combinations in the organisation (Hult et al., 2004; Schumpeter, 1934).
Innovation can be defined as the creation, development, adoption and disposal of new ideas or activities in organisations (Damanpour and Schneider, 2006). Innovativeness can be seen as the process that leads to innovation, while innovation is the outcome (Pesämaa et al., 2013). An innovative organisation can either generate or adopt innovation; a generating firm, innovates to create new products, processes or technologies in order to enter a new market. On the other hand, an adopting organisation, integrates an already existing product, process or technology to remain in a market (Damanpour and Wischnevsky, 2006).Damanpour also distinguishes between two types of innovation, technical and administrative; technical innovations includes a new process or new products and services, while administrative innovations include new policies, procedures and organizational forms (Damanpour, 1991). Subramanian and Nilakanta stated that ‘‘Innovativeness, by definition, is an enduring
organisational trait. Truly innovative organisations are those that exhibit innovative behavior consistently over time” (Subramanian and Nilakanta, 1996, p. 633). Organisational
innovativeness can also be defined as a firm’s openness to new ideas and innovation (Hurley and Hult, 1998). Innovativeness is positively related to new product successes which in turn contribute to performance (Droge et al., 2008). Droge et al. implied that managers can control a firm’s innovativeness and market intelligence, which in turn, can lead to new product
successes. New product successes are important for firms, but difficult to achieve when facing turbulent environments. Turbulent environments refers to frequent and dramatic changes, which hinders accurate prediction, their findings also show that innovativeness is positively related to new product success under conditions of environmental turbulence (Droge et al., 2008). The relationship between environmental uncertainty and innovativeness is later discussed under the following headings.
Dynamic capabilities help companies to maintain long term performance in environments of fast innovation and globally widespread sources of innovation (Teece, 2007); hence, this is in line with Schumpeter’s definition of innovativeness (Schumpeter, 1934). Dynamic
capabilities can contribute with this through constantly ensuring that opportunities once sensed, will be seized (Teece, 2007). Thus, in order to keep up with competition, firms need to be reconfigured after the change in markets or technology. This is done by entrepreneurial management, which is about creatively managing the company’s capabilities in order to create and seize opportunities, and at the same time be in line with customer needs (Teece, 2007). Innovativeness is a mechanism that facilitates an organisation to change, which enables firms to easily respond to environmental changes (García-Morales et al., 2008). This implies that firms and managers constantly need to address the issues of dynamic capabilities and
12
innovativeness in changing environments. It also shows that a firm’s success and performance is depending on the management of capabilities and innovativeness. Performance as a result of innovativeness is elaborated in a later section.
For this study, we will study the concept of innovativeness rather than innovation, as it shows the ability of firms to adapt to continuous changes by constantly creating solutions in order to survive the market.
2.2 Environmental Factors
The pace of change in today’s business environment is very fast and businesses recognize that survival requires innovation as a means to compete and grow. Environmental uncertainty is therefore a means to be more innovative. According to Uzkurt et al. (2012), organisations must innovate under changing environments in order to survive; thus, being responsive to environmental uncertainty and turbulences by innovativeness.
Ansoff has defined environmental turbulence in five different levels; changing, repetitive, expanding, discontinuous and surprising. Thus, these five levels of environmental turbulence should be matched with the organisation’s behavior, responses and capabilities, in order to increase the performance of the organisation. A surprising level of environmental turbulence could be a significant change in technological turbulence (Ansoff, 1987). Technological turbulence refers to the technological change and development of the organisation’s products and processes (Jaworski and Kohli, 1993). Organisations then need to adapt after these changes, in order to keep up with competition (Ansoff, 1987). Another factor of environmental turbulence is market/demand turbulence which relates to a business’s marketplace variability and uncertainty (Helfat et al., 2007).
Environmental uncertainty is a broad definition that can be classified into several categories. According to Conrath (1967) and Duncan’s (1972) articles, environmental uncertainties can be sorted into three types: 1) State uncertainties—when a firm’s environment is unpredictable; 2) Effect uncertainty—the effect of environmental uncertainties on a business or project; and 3) Response uncertainty—the inability to measure the consequences of a particular response. For our study however, we will concentrate on the effect environmental uncertainties such as market and technological turbulences have on innovativeness.
Jaworski and Kohli stated that market turbulence refers to the degree of change in customer preferences for products in a market. Thus, it is an important source of environmental turbulence, as environmental turbulence refers to the rates of change in the market or technology within an industry (Jaworski and Kohli, 1993). An organisation in an industry with a high degree of market turbulence will need to support innovativeness in order to increase performance (Hult et al., 2004). The other factor of environmental uncertainty in this study is technological turbulence, which refers to the degree and rate of technological change relevant to products and processes that the firm offers (Jaworski and Kohli, 1993). This implies that conditions of environmental uncertainty such as market/demand turbulence and technological turbulence require firms to support innovativeness in order to perform well. Competitive intensity refers to the degree of competition that an organisation faces from other firms within an industry (Grewal and Tansuhaj, 2001; Jaworski and Kohli, 1993). Jaworski
13
and Kohli stated that successful new product development depends on the competitive environment that the firm operates in (Jaworski and Kohli, 1993). Tsai and Yang stated that rapid changes in customer preferences reinforce the need of innovative organisation initiatives under competitive intensity. This means that the ability for firms to add value through
innovativeness depend on market turbulences (Tsai and Yang, 2013). Uzkuet et al. (2012) also proved that competitive intensity has no significance on organisational innovativeness in their study.
Since competitive intensity has proved to have no effect on innovativeness in previous studies, we will only examine the impact of market and technological turbulences in this thesis.
2.3 Environmental Uncertainty and Organisational Innovativeness
Firms are encouraged to innovate and improve performance by developing strategic flexibility in turbulent environments (Nandakumar et al., 2012). Tsai and Yang’s study shows that innovativeness is important for managers and organisations that seek to enhance
organisational performance in environments of high turbulence (Tsai and Yang, 2013). An organisation constantly needs to innovate so that its products are in line with quickly changing markets (Hutt and Speh, 2010).
Research is unclear about how organisational innovativeness affects performance under different conditions of external environments (Hult et al., 2004). Although market turbulence and competitive intensity “together” enhance the positive effect of organisational
innovativeness on performance, this positive effect also increases when market turbulence and competitive intensity increase. Therefore, organisational performance tends to be at its highest when innovativeness, market turbulence and competitive intensity are also is at their highest (Tsai and Yang, 2013). This implies that organisational innovativeness has an important role for the performance within turbulent environments. However, the effect of organisational innovativeness on performance differs along different configurations of market turbulence and competitive intensity. Organisational innovativeness is not positively related to market turbulence when it is low and when competitive intensity is high (Tsai and Yang, 2013). This demonstrates that there is a relationship between market turbulence, competitive intensity, organisational innovativeness and performance; but, the different factors are not always positively related to each other. Moreover, according to Uzkurt et al. (2012), their study concluded that there is no direct relationship between competitive intensity and
innovativeness. Companies will respond to competition by price offers and promotions, rather than becoming more innovative.
Buganza et.al has also explored the relationship between innovation and environmental uncertainty in terms of product development and environmental turbulence. They imply that innovation under conditions of environmental uncertainty can be a major challenge for firms (Buganza et al., 2009). Their results show that organisations should apply more flexible development processes when facing market turbulence and technological turbulence. Firms, when dealing with market turbulence, tend to adapt by using early experiments involving customers, formal and cross-functional project teams, and flat organisational structures. In conditions of technological turbulence, firms tend to use rapid project iterations (Buganza et
14
al., 2009). This implies that organisations assess the level of environmental turbulence and then try to adapt to the changes.
Organisations should invest resources in new product development and in the management of innovative activities that are required under conditions of environmental turbulences (Tsai and Yang, 2013). This implies that organisations and their managers need to align its
innovativeness under conditions of environmental turbulences in order to improve
performance. Droge et al. (2008) indicated that managers can control a firm’s innovativeness and market intelligence, which in turn, can lead to new product successes. New product successes are important, but difficult to achieve when facing turbulent environments. Turbulent environments refer to frequent and dramatic changes, which hinders accurate prediction (Ibid.). Droge et al. also researched about finding determinants of new product success. Their results show that innovativeness was positively related to new product success in conditions of high environmental turbulence. Thus, this suggests that enhanced focus on innovativeness, under conditions of highly turbulent environments, can improve performance of organisations (Ibid.). In this thesis, we acknowledge the importance of understanding the impact of organizational innovativeness on firm performance, therefore we discuss their relationship in more details in the following section, and we added it to the forthcoming research model to be tested on Swedish SMEs.
Nystrom et al. findings show that the link between an adopting firm in terms of external orientation and their customers is important for future success of an organisation. A firm that is externally oriented can have better awareness to their customers’ needs, which could lead to an organisation being able to innovate more and adapt to changing technologies (Nystrom et al., 2002). Their study shows that organisations that are externally oriented have a positive effect on a firm’s innovativeness. Their findings also support that firm size and external orientation positively affects innovativeness.As larger firms can become slower to act, an environment with greater risk would then lead to more innovativeness (Ibid.). Organisations that face changing environments and uncertainty should support innovation and adapt to the changes (Jiménez-Jiménez and Sanz-Valle, 2011).
Our research model also includes the relationship between environmental uncertainty and organisational innovativeness as it recognises its impact on today’s marketplace.
2.4 Organisational Innovativeness and Performance
“Business performance is defined as the achievement of organizational goals related to profitability and growth in sales and markets share, as well as the accomplishment of general firm strategic objectives” (Hult et al., p.430). Previous studies of innovation have led to the conclusion that organisational innovation has an important impact on business performance and its competitiveness (Baker and Sinkula, 2002; Damanpour, 1991).
It is commonly agreed that innovativeness contributes to performance of organisations, and results show that innovativeness is an important factor for organisation’s performance. This should encourage managers to improve organisational innovativeness to achieve better levels of performance (Hult et al., 2004). The base for a firm’s success and survival is through how managers handle innovativeness (Hernard and Szymanski, 2001).
15
The findings also show that innovativeness can help organisations to achieve competitive advantage, by introducing new or improved products/services and expand the organisation’s possibilities (Hult et al., 2004; Calantone et al., 2002). This implies that there is a relationship between organisational innovativeness and performance of organisations. Additionally, innovativeness is important for a firm’s ability to be competitive, which in turn can increase the organisation’s performance.
Jiménez-Jiménez and Sanz-Valle’s findings show that innovation has a positive effect on performance. Their results also show that the positive effect of innovation on performance is higher for manufacturing firms than for service firms (Jiménez-Jiménez and Sanz-Valle, 2011).
Organisational innovativeness has attracted much attention in recent literature, especially about the role of innovativeness in enhancing performance of organisations (Kyrgidou and Spyropoulou, 2013). Kyrgidou and Spyropoulos examined key antecedents of innovativeness, which were entrepreneurial, managerial and technical capabilities. They found out that all the investigated capabilities were positively related with innovativeness, which as a result, had a positive effect on organisation’s performance. (Kyrgidou and Spyropoulou, 2013). By facilitating innovativeness through utilization of the capabilities, the organisations should be able to develop new products superior to their competitors. This should lead to competitive advantage and as a result to enhanced performance. However, they found out that technical capabilities and performance had a negative relationship. This could be explained by the organisation's dependence on technical aspects, which states that equally important factors in matter of innovativeness are neglected (Kyrgidou and Spyropoulou, 2013).
An important part when enhancing innovativeness, is management of capabilities (Kyrgidou and Spyropoulou, 2013). This is due to the fact that managers constantly need to adjust and effectively match the organisation’s capabilities with the developing marketplace (Kyrgidou and Spyropoulou, 2013; Carson et al., 2008). In turbulent environments, organisations often lack the capabilities to identify opportunities that lead to innovativeness. This makes it important for organisations to identify the capabilities to focus on, in order to save costs (Kyrgidou and Spyropoulou, 2013). Kyrgidou and Spyropoulou write that “managers should create and implement an organizational culture that consists of the required capabilities and a context within which innovativeness can successfully unfold” (Kyrgidou and Spyropoulou, 2013, p.294). Hence, to increase performance, these functions should be coordinated to make sure that innovative activities use the benefits that the capabilities can offer (Kyrgidou and Spyropoulou, 2013). This suggests that innovativeness can be measured by using its drivers; entrepreneurial, managerial and technical capabilities. In addition, these capabilities can be affected by turbulent environments; thus, they need to be managed to improve business performance (Kyrgidou and Spyropoulou, 2013). This implies that firms can achieve higher performance if the organisations support innovativeness when facing conditions of
environmental uncertainty.
Lee et al. findings support that innovativeness is a driver of an organisation’s performance. Small entrepreneurial organisations often have limited resources and a limited size. In spite of that, they often try to secure success through using their innovative technology. This indicates that the willingness to innovate in small organisations to keep up with competition, is as big as in larger organisations. This also implies that managers of small organisations should support improvements in innovativeness, to also improve performance (Lee et al., 2010).
16
3. Theoretical Framework
3.1 Hypotheses
Findings show that firm innovativeness tends to be higher under conditions of high environmental turbulence (Droge et al., 2008; Uzkurt et al., 2012). Previous studies also showed that organisations need to be innovative in order to survive under changing and competitive environments (Liu and Phillips, 2011; Ellonen et al., 2008; Uzkurt et al., 2012). Hult et al. argued that a firm’s innovativeness depends on the organisations ability to act and how they respond to changing markets (Hult et al., 2004). Buganza et.al have also explored the relationship between innovation and environmental uncertainty, in terms of product
development and environmental turbulence (Buganza et al., 2009). They argue that innovation under conditions of environmental uncertainty can be a major challenge for firms. They then tend to develop more flexible processes and strategies in order to respond to the changing environment (Buganza et al., 2009; Nandakumar et al., 2012).
Previous research argue that firm’s innovativeness tends to be higher when facing conditions of high environmental uncertainty. Based on the discussions of previous research on
environmental uncertainty and organisational innovativeness, we propose the following main hypothesis for our study:
H1: The greater the environmental uncertainty faced by an organization, the higher will be the firm’s innovativeness.
The first factor in our model to study environmental uncertainty is market/demand turbulence faced by the organisations. Market/demand turbulence refers to an organisation’s marketplace variability and uncertainty (Helfat et al., 2007). Tsai and Yang argue that market turbulence enhance the positive effect of organisational innovativeness when it tends to be high (Tsai and Yang, 2013). When assessing market/demand turbulence, Jaworski and Kohli evaluate the stability of customer preferences, which tend to change over time (Jaworski and Kohli, 1993). Based on previous research, we expect that a firm’s innovativeness will increase when
market/demand turbulence increases.
H1a: The greater the market/demand turbulence in an organization’s external environment, the higher will be the firm’s innovativeness.
Technological turbulence is the second factor in our model, which organisations face. A level of environmental turbulence could be a significant change in technology (Ansoff, 1987). Technological turbulence refers to the technological change and development of the firm’s products and processes (Jaworski and Kohli, 1993). Buganza et al. argue that firms facing technological turbulence tend to use rapid iterations, in order to improve their products or services (Buganza et al., 2009). This implies that firms tend to respond to technological turbulences by enhancing innovativeness. So, we expect that technological turbulence will have a positive role on organisational innovativeness.
17 H1b: The greater the technological turbulence in an organisation’s external
environment, the higher will be the firm’s innovativeness.
Performance refers to the achievement of firm goals related to profitability and growth in sales and market share (Hult et al., 2004). Hult et al. argue that innovativeness is an important factor for firms and that it contributes to the performance of organisations (Ibid.). Lee et al. also argue that innovativeness is a driver of an organisation’s performance; small
entrepreneurial firms with limited resources often try to improve performance by supporting innovation (Lee et al., 2010). Innovativeness also helps the firms to be competitive in the markets, which in turn increases the organisation’s performance (Baker and Sinkula, 2002; Damanpour, 1991). Based on previous research, we expect that an organisation’s performance will be higher when the firm’s innovativeness increases.
H2: The greater the innovativeness by an organization, the higher will be the firm’s performance.
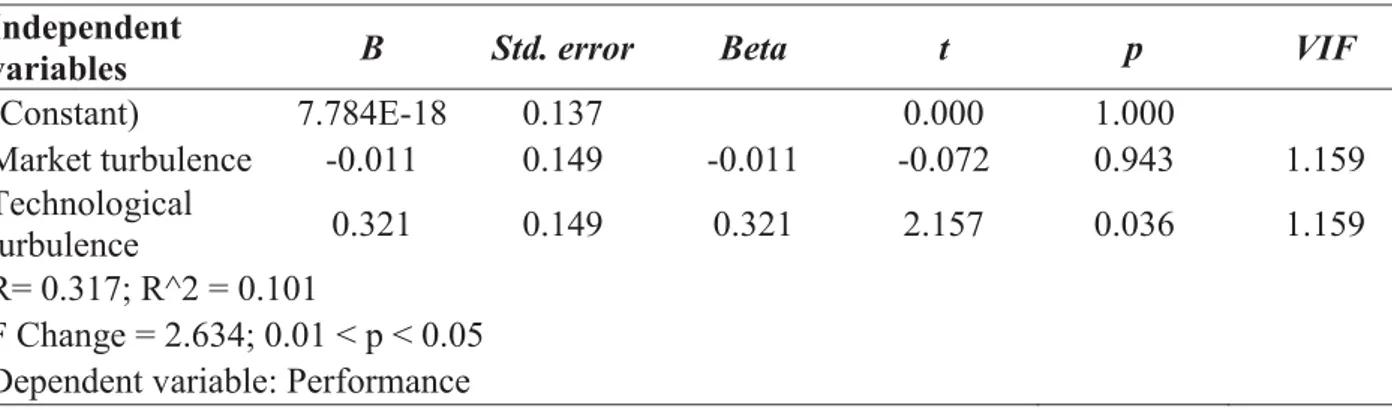
Previous research argue that innovativeness is positively related to new product success under conditions of high environmental turbulence (Droge et al., 2008). Thus, this implies that a firm’s performance is higher when facing conditions of high turbulences. According to Uzkurt et al. (2012) organisations are responsive to environmental uncertainty, thus they need to support innovativeness under conditions of high turbulences in order to survive.
Based on the previous research, we expect that a firm’s performance will increase when an organisation faces higher conditions of environmental turbulences, due to innovativeness.
H3: The greater the environmental uncertainty faced by an organization, the higher will be the firm’s performance.
Hult et al. (2004) stated that a firm facing high degree of market/demand turbulence need to support innovativeness to increase performance, by continuously innovating their products so that they are in line with the quickly changing markets (Hutt and Speh, 2010). We also expect performance to be higher when an organisation faces higher conditions of market/demand turbulence.
H3a: The greater the market/demand turbulence faced by an organization, the higher will be the firm’s performance.
Turbulent environments refer to frequent and dramatic changes, which hinders accurate prediction (Droge et al., 2008). In conditions of high technological turbulence, organisations tend to respond to uncertainty by using rapid project iterations, to come up with new products through innovativeness (Buganza et al., 2009). Based on previous research, we expect that higher conditions of technological turbulence will have a positive effect on business performance.
H3b: The greater the technological turbulence in an organisation’s external environment, the higher will be the firm’s performance.
18 3.2 Proposed Research Model
As discussed in the theory section, previous studies have revealed several factors affecting organisational innovativeness and performance. The factors related to the theory in this study are market/demand turbulence and technological turbulence. We have deselected competitive intensity as a factor for the study, since in previous research it showed no direct relationship with organisational innovativeness.
For our study, we will first analyse the effect of market/demand turbulence and technological turbulence together on organisational innovativeness. We will also evaluate the direct
relationship between innovativeness and business performance shown on the model in Figure 2. Finally, will we test the indirect relationship between market/demand turbulence and technological turbulence on performance implied by the dashed arrows in the Figure. Market/demand turbulence and technological turbulence will be the independent variables when assessing environmental uncertainty, while organisational innovativeness will be the dependent variable. The hypothesis (H1) expresses that the relationship between
environmental uncertainty and innovativeness is positive. The hypothesis (H2) will test the relationship between organisational innovativeness (independent variable) and business performance (dependent variable). Market/demand turbulence and technological turbulence will act as independent variables in the hypothesis statement (H3) that tests the effect of environmental uncertainty on performance (dependent variable).
H3a+ H1a+
H2+
H1b+
H3b+
Fig.2 An illustration of the Proposed Research Model
Market/demand turbulence
Technological turbulence
19
4. Method
4.1 Methodology
Research methodology is a key point in a thesis, and researchers should choose their
methodology carefully to portray their aim of the study clearly to their readers. Yilmaz stated that “Educational researchers in every discipline need to be cognisant of alternative research traditions to make decisions about which method(s) to use when embarking on a research study” (Yilmaz, 2013). There are many different research methods, two of the most common are qualitative and quantitative research methods (Myers, 1997).
Qualitative method is often explained by using in-depth data, meaning that researchers need to gather sufficient amounts of data to have a deeper understanding of the research object (Glenn, 2010). It usually describes the why and how and uses smaller focused samples of data through interviews and observations. Qualitative methods are often said to be exploratory, which means hypothesis generating instead of hypothesis testing (Ibid.).
Quantitative method is deductive in nature as it contributes to the scientific knowledge base by testing theories such as hypotheses, based on literature (Glenn, 2010). Quantitative research refers to the systematic empirical investigation via statistical, mathematical or numerical data or computational techniques; to enable the researcher to identify different patterns or relationships of the gathered data, collected through surveys and questionnaires (Yilmaz, 2013). This method answers the questions what and how many (Marshall, 1996), and allows us to gain a broad and generalizable set of data by using larger samples (Glenn, 2010). Glenn also wrote that quantitative methods should support repeatability, which means that statistical instruments are used in the research so that findings will be similar when using similar data (Ibid.).
For our study, we will use the quantitative research method as it’s the most appropriate to answer our research questions. The objective is to identify and develop hypotheses on the environmental factors affecting organisational innovativeness and performance. These pre-determined hypotheses will be tested, as data collected from the survey will be statistically analyzed in order to examine and quantify these relationships. In contrary to qualitative researches, the quantitative research method is directed to a larger sample which objectively generalizes the research findings.
4.2 Research Approach
The research approach followed for this study was guided by the suggested research steps in the book The Craft of Research by Booth, Colomb, and William (2008). Although not thoroughly followed, the general guidelines helped in structuring the research method. The topic of our study was first inspired by the article of Uzkurt et al. (2012). We then used BTH library databases to search for literature with a similar topic to get enlightened more about our interests in that area. We then started planning our research study by devising some objectives and drafting research questions. These draft questions allowed us to focus our
20
study on the environmental turbulences and organisational innovativeness and performance, until the final definite research questions were defined.
Booth, Colomb and Williams stated that it is important to support your answer to the research problem with good arguments; this should be done by gathering some sort of data (Booth, Colomb and Williams, 2008). Quantitative research method was chosen as the most suitable for our study, and surveys were the most appropriate technique to answer our research questions. Quantitative methods require the researcher to categorize the research object’s experiences and perspectives into predetermined categories by using pre-constructed instruments (Yilmaz, 2013). This allows the researcher to measure the responses by using a limited set of questions; thus, making it easier for comparison and statistical aggregation of the research object’s responses.
With surveys, large samples of data can be reached and collected, and then hypothetical statements and propositions can be tested. Quantitative method is deductive in nature as it tests theoretical hypotheses to contribute to scientific knowledge (Glenn, 2010).
The next step was the design of the study, which is the logical plan which will connect the empirical data to the study’s research questions and finally lead to conclusions (Yin, 2009). After specific research questions for our topic were identified, we have developed hypothesis statements concerning the impact of the environmental factors (market and technological turbulences) on organisational innovativeness and on business performance. The analysis results of the proposed model would lead to respond to the research questions.
The survey preparation and actual data collection followed. The survey was a set of items developed and pretested by previous researchers. It was important to use well-known items from previous studies to ensure their reliability and effectiveness. The survey was developed via a web platform and the link was shared to a number of SMEs via email, while the
responses were automatically stored on a spreadsheet.
The next step was the analysis of the collected survey data. We had some experience with using the IBM SPSS version 20 software, but needed to familiarise ourselves with the software before performing the tests. We started with establishing the mean values and standard deviations of the items to get an indication of what the respondents answered. Then we calculated the Cronbach’s Alpha scores for each scale to test the reliability of the items used in the survey. Before testing the hypotheses, we performed an exploratory factor analysis, in order to converge the items of a scale to one factor. This was done to make the data easier to study in the upcoming regression analysis.
The last step was to perform the regression analysis and test our hypotheses, which enabled us to either accept or reject them. The results were then discussed and compared with the theory. The problem formulation was also answered in the conclusion section and limitations and future research suggestions were proposed.
21 4.3 Survey and Measurements
The thesis survey was built online using Textalk Websurvey, and distributed to the SMEs through a web link, via email. The email started with an introduction explaining the purpose of the survey and its topic about the effect of environmental turbulences on innovativeness and business performance. We also added that the responses are for BTH University and will be treated with confidentiality, so that we can avoid any potential bias in replies.
The survey started with three control variables for the respondents to fill: the number of years in market since registration, number of current employees in the organisation and what type of industry they specialise in. We also asked them to mention their sales revenue at the end of the survey, to control that they remain in the SME definition, with an annual turnover not exceeding 50 million euros (European Commission, 2005). Following, the survey consisted of four separated sections, the variables to be examined (innovativeness, market turbulence, technological turbulence, and performance). All of them contain items previously developed and pretested by other studies. The items are scaled on a five-point Likert scale: 1.strongly disagree to 5.strongly agree.
Innovativeness was measured by an 11 item scale developed by Darroch and Jardine (2002). To measure the two dimensions of the environment i.e., market/demand turbulence and technological turbulence, we adopted four items from Jaworski and Kohli (1993) for
technological turbulence and four items from Grewal and Tansuhaj (2001) for market/demand turbulence. The market/demand turbulence scale assessed the stability of customer
preferences, which tend to change over time, and the technological turbulence scale measured the extent of change and pace in technology relevant to the organization. To measure
performance, we adopted 5 items from Cordero (1990) to assess performance in comparison to the respondents’ main competitors.
4.4 Sample Data and Collection
Our study’s research group was a randomly selected sample of SME’s in Sweden. The sample data consisted of 250 firms with 10 to 250 employees and at least 4 years of experience in market. Data about the companies was collected through the BTH database (Retriever), and then surveys were sent to these firms. The survey was sent to top-level managers from randomly selected SMEs of different business industries and geographical areas. This was done as to avoid consistency of characteristics, which could lead to biased responses. In addition, the emails of the CEOs and top managers were fetched from the companies’ websites, to make sure the surveys were sent to and replied by the indented people.
Surveys are a great method to reach a wide number of participants. Especially nowadays, the usage of Internet had even made the process much easier and accessible to all parts of the world. In Sweden, almost everyone has an Internet connection, especially firms. Surveys also allow us to gain a broad and generalizable set of data (Yilmaz, 2013). The most important elements in a survey are the reliability and validity of the items examined in it. Validity and reliability are two things to consider when writing a thesis and there exist many different types of validity and reliability (Cohen et al., 2007). Cohen et.al adds that validity is an important factor to consider for an effective research, because if it’s not valid, the data is
22
useless (Cohen et al., 2007). In our case, we have adopted well-known scales developed and tested from previous studies.
In addition, online surveys were cost effective and ensured completion of a full survey per responder as it did not allow submission with empty fields. Online surveys also reduced the time and effort needed to fill in a paper questionnaire and can be filled at any time suitable for the respondents. The responses submitted were automatically captured and recorded by the web platform on a separate spreadsheet, to be analyzed and utilized by SPSS software later. However, some pitfalls were still present with surveys. These include people not responding at all and respondents giving false data. Our job was therefore to send surveys to a bigger sample to compensate for any shortage of respondents, and to analyze all the needed data and dropout any misleading surveys. In addition, since using a survey requires a predetermined set of responses based on theory, this means that it fails to acquire the research subject's feelings and experiences with their own words (Yilmaz, 2013).
4.5 Unit and Level of Analysis
The unit of analysis of this thesis is the Swedish Small Medium Enterprises (SMEs). In Europe, SMEs have an essential role because they are the engine of the European economy. SMEs play an important function when it comes to sources of jobs, creation of entrepreneurial spirit and innovation. Therefore, SMEs are a top priority for the European Commission (2005) in the creation of economic growth.
SMEs in Sweden are important for the Swedish economy as they represent a large share of all firms in Sweden, over 90 percent. Findings also show that the majority of SMEs in Sweden have the willingness to grow as the size of the firm increases (Tillvaxtverket, 2011). Since SMEs contribute to a major share of the Swedish economy, we wanted to examine our
hypotheses about the effect of environmental uncertainty on innovativeness and performance, in the Swedish market
4.6 Validity and Reliability
In this section we take validity and reliability in consideration, as they are important to make the study trustworthy (Cohen, Manion and Morrison, 2007). We will define them and discuss how we dealt with them.
Reliability means consistency of results when measuring a given variable every time, with the same research instrument under the same conditions (Huck, 2000; Keppel, 1991). Test-retest reliability is a type of reliability that is important to take into consideration when doing a quantitative research. Test-retest reliability means that when doing a test on the same single group’s subjects at two different occasions, it should give positively correlated results (Huck, 2000; Keppel, 1991). This procedure was not followed in the study due to time limitation, but we had it in mind when doing the research.
23
We estimated reliability instead by measuring the internal consistency, which tested how well the items within a scale measured the same concept. This was done by calculating the
Cronbach’s Alpha scores for each scale (Cronbach, 1951). The original Alpha scores for innovativeness were between 0.78 and 0.86 (Darroch and Jardine, 2002), and the original ones for environmental uncertainty scale were between 0.68 and 0.88 (Jaworski and Kohli, 1993). The Cronbach’s Alpha scores for the scales in our study were overall good with values above 0.70, which indicated that the reliability was high.
In the reliability analysis, all items with a corrected-item-total correlation of less than 0.40 were eliminated. This measure is very important to use, in order to assure that only the
reliable data is considered in the analysis as not to distort the results. The items INV5, INV10, INV11 and TT3 were eliminated due to values under 0.40.
Validity means the accuracy of the research data, which means that the measurement instrument tests what it is supposed to measure (Huck, 2000; Keppel, 1991). An important type of validity to take into consideration is content validity. This means that we have used methods that cover every element of the problem investigated (Cohen, Manion and Morrison, 2007). We dealt with this by doing extensive literature research and adopting well known measurement scales for the survey to use in the study.
Another type of validity to consider is construct validity; that assesses the degree to which a test measures what it claims to be measuring. This was ensured by performing an exploratory factor analysis. The reliable items of each scale were converged to one factor depending on how strong was the correlation between them. The results of the factor analysis implied that the factor loadings of the items in each scale were high, thus indicated that they are correlated to each other.
In addition, to assess the degree of multi-colinearity for the factors, VIF (variation inflation factor) model was used (Stapleton, 1995). This is very important, to check how much the independent variables are correlated with each other. The results showed a very low degree of multi-colinearity (between 1 and 1.2), which is very good as it means that the correlation of the independent variables are no concern for the analysis.
24
5. Empirical findings
5.1 The Swedish Economy and SMEs
The role of Swedish SMEs are increasingly important for the economy in Sweden, especially now since the last years (European Commission, 2013). They represent a big share of all the organisations in Sweden, over 90 percent (Tillvaxtverket, 2011). The Swedish SMEs
contribute with 65 percent of the private sector jobs and over 50 percent of new value to the Swedish economy (European Commission, 2013). These numbers are the same as the average in the European Union, but Swedish SMEs are mainly dominant in the manufacturing and retail trade sectors (Ibid.).
There is a growing trend in Sweden when it comes to new businesses; the number of start-ups has increased the last few years due to a better business climate (European Commission, 2013). Sweden is also a much internationalised country as they are highly dependent on export markets (Tillvaxtverket, 2011). This is a consequence of the globalisation and it increases the importance for companies to deal with international competition. The survey that Tillvaxtverket (2011) performed show that one of four SMEs in Sweden is
internationalised, which means that they are either exporting/importing or participates in cross boarder activities.
The trend for SMEs in Sweden is that they have the willingness to grow, but the SMEs also report that they experience obstacles that hinder them to grow (Tillvaxtverket, 2011).
Common obstacles are international competition, inter-firm competition and access to skilled labour (Ibid.). Andersson and Lööf (2011) stated that skilled labour is even more important to small businesses if they want to innovate compared to larger firms.
25
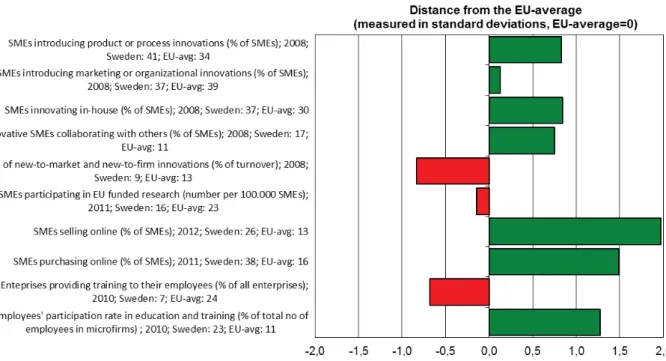
Figure 3 shows a comparison between Sweden and the European Union average when it comes to skills and innovation. This figure indicates that Sweden is ahead the EU-average on most things, such as introducing product and process innovation, in-house innovating, selling online and purchasing online. But also that Swedish SMEs are lacking behind on providing training to their employees (European Commission, 2013).
Sweden is one of the largest Northern European economies with a good living standard, and a skilled labour force. In addition to excellent external and internal infrastructures, which are good conditions for doing businesses (TradingEconomics.com, 2013). The Swedish economy fell into a recession in 2008 where growth stopped and consumption was reduced. Yet, Sweden has recovered well after the recession and its GDP annual growth rate now is 1% (Ibid.).
5.2 Data Collection
An online survey was sent to a random sample of SMEs in Sweden through email. We have contacted a total number of 250 firms from the manufacturing sector, and got 50 valid responses. The 20% response rate might be due to some companies fearing to reveal sensible information. The responses collected were analysed thoroughly as we will portray in the following sections. The firms selected were only small and medium sized SMEs, since they only had 11 to 250 employees. According to European Commission (2005), micro SMEs contain up to 10 employees, small firms have up to 50, and medium sized companies employ up to 250 workers. The survey also included other control variables such as industry type, registration year, and sales. The following is a summary of some of the variables:
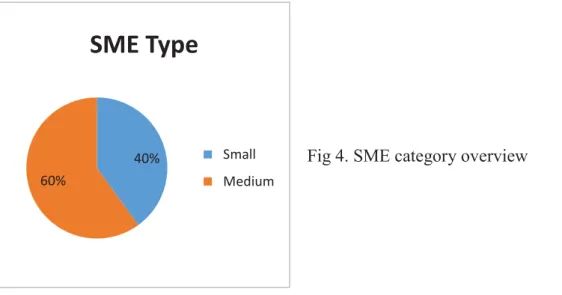
Fig 4. SME category overview
There were no micro SMEs in our sample since we controlled the employee variable and selected firms with 11 to 250 workers. The medium sized and small firms had close
percentages with medium sized SMEs having the majority in our sample. This randomness of sample helps to get better results.
40% 60%
SME Type
Small Medium
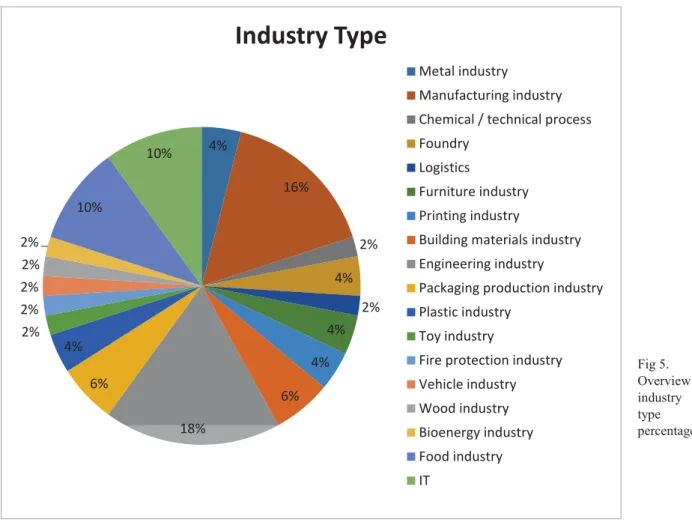
26 Fig 5. Overview of industry type percentages
Figure 5 show the different types of industry included in the study. There was a wide variation of industries in our random sample. Almost all had similar percentages except the
manufacturing industry and engineering industry having the most occurrence in the sample, with the food and IT industries ranking second.
4% 16% 2% 4% 2% 4% 4% 6% 18% 6% 4% 2% 2% 2% 2% 2% 10% 10%
Industry Type
Metal industry Manufacturing industry Chemical / technical process FoundryLogistics
Furniture industry Printing industry
Building materials industry Engineering industry
Packaging production industry Plastic industry
Toy industry
Fire protection industry Vehicle industry Wood industry Bioenergy industry Food industry IT
27
Table 2. Data Descriptive Statistics
Items Min Max Mean Std. Deviation N
Innovativeness INV1 2 5 4.22 0.81 50 INV2 1 5 3.82 1.10 50 INV6 1 5 3.42 1.24 50 INV7 1 5 3.34 1.22 50 INV3 1 5 3.26 0.98 50 INV4 1 5 2.80 1.08 50 INV8 1 5 2.64 1.53 50 INV5 1 5 2.62 1.06 50 INV9 1 5 2.46 1.34 50 INV11 1 5 2.34 1.23 50 INV10 1 5 2.16 1.14 50 Market/Demand turbulence DT3 1 5 3.68 1.11 50 DT1 1 5 3.54 1.16 50 DT2 1 5 2.98 1.25 50 DT4 1 5 2.98 1.25 50 Technological turbulence TT2 1 5 3.66 1.06 50 TT1 1 5 2.96 1.15 50 TT4 1 5 2.94 1.23 50 TT3 1 5 2.70 0.95 50 Performance IP2 1 5 3.82 0.98 50 IP4 1 5 3.76 1.25 50 IP3 1 5 3.72 0.90 50 IP1 1 5 3.70 1.03 50 IP5 1 5 3.34 1.02 50
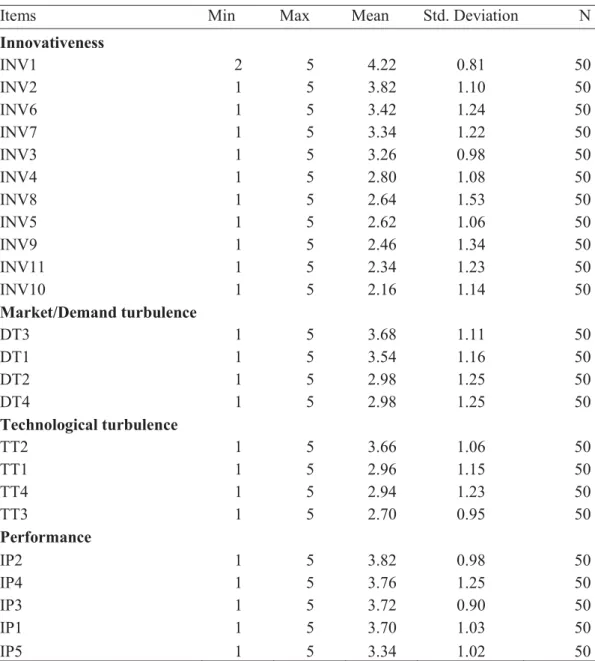
Table 2 includes the descriptive statistics of the survey, where the item column represents the questions used. The number of the items corresponds to the respective question number as shown in Table 1. The mean value refers to the central tendency of the data, while standard deviation reflect the data’s dispersion around the mean values. N represents the number of responses on each of the items. The items in Table 2 have been ranked based on their mean value, from the highest to the lowest. The mean values of the items in the innovativeness scale were between 2.16 and 4.22. Five items in the innovativeness scale were between 3.26 and 4.22, which shows that the degree of innovativeness of firms in the sample tends to be high. The mean values of the environmental scales were between 2.98 and 3.54 for market/demand turbulence and between 2.70 and 3.66 for technological turbulence. As the items tend to be higher than 3 except for one item, this indicates that the firms in the sample are facing conditions of environmental uncertainty with high turbulence. The mean values of the items in the performance scale were between 3.34 and 3.82; this shows that firms in the sample tend to have high performance compared to competitors in their industry. The min and max show the survey’s scale range, which in our case is the Likert scale.
28
The survey used a Likert scale, were 1 represented strongly disagree, and 5 represented strongly agree. Items INV5, INV10, INV11 and TT3 were then eliminated because of having an item total correlation value lower than 0.40, which is the critical value based on reliability analyses. An item total correlation test was performed to control if any of the items in the scale were inconsistent with the behavior of the others, the item total correlation tables can be found in Appendix C. A Pearson correlation coefficient test was performed, in order to test if the items that measures the same thing had high internal correlation. The table shows that the items within a group have high internal correlation and low correlation values between different scales. This can be found in the table in Appendix F
5.3 Exploratory Factor Analysis
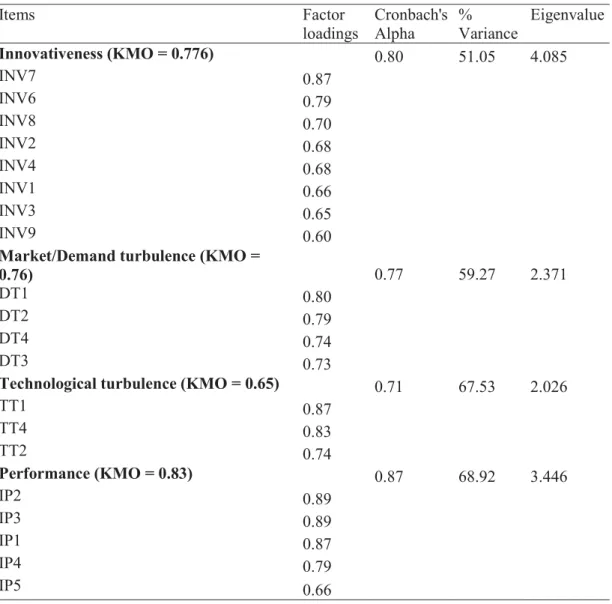
Before performing an exploratory factor analysis, we have to test if the items closely relate to one another. This is done by performing Kaiser-Meyer-Olkin (KMO) where high values of KMO show that factor analysis is appropriate (values between 0.5 and 1.0 are considered high) (Kaiser, 1974). The KMO values of our scales were 0.776 for innovativeness, 0.76 for market/demand turbulence, 0.65 for technological turbulence and 0.83 for performance. This indicated that KMO values of our scales were good and factor analysis is appropriate.
Bartlett's Test of Sphericity was also performed to indicate whether exploratory factor
analysis can be performed. We got a significance level less than 0.05 which suggested that the relationship among items were good enough to precede the test. The KMO and Bartlett values can be found in Appendix D.
By performing an exploratory factor analysis the authors converged the items of a scale to one factor, based on correlations. This is done to make the data easier to study in the upcoming regression analysis. The exploratory factor analysis was performed using principle
components of factor extraction and varimax rotation techniques.
The exploratory factor analysis resulted in new factors, representing the four scales presented above. The eight independent items in the innovativeness scale were reduced to one factor, representing that scale. The four items in the market/demand turbulence scale and the three items in the technological turbulence scale were also reduced to one factor each. The factor analysis of the five items in the performance scale were reduced to one factor as well. The new factors representing the scales will be named innovativeness, market/demand turbulence, technological turbulence and performance.
The factor analysis was performed using a cut-off loading of 0.50, which means that items with factor loadings under 0.50 would be removed. Hair et al. (2010) recommended that factors should have a value higher than 0.5 and preferably higher than 0.60 as well. The results showed that all of the items had factor loadings above 0.50, indicating a high level of significance. Factor loadings show how the group of items load into factors. Percent variances of innovativeness, market/demand turbulence, technological turbulence and performance were 51.05%, 59.27%, 67.53% and 68.92 respectively and can be found in Appendix E. The
percent variances indicate how much the factors explain the items of each scale. The results show that the factors have good variances, as all of them had variances over 50%. This means that the innovativeness scale factor explain 51.05% of the items in that scale.
29
The eigenvalues should be higher than 1 to be significant, this indicate that the factors are significant. As the eigenvalues for the factors are, 4.085 for innovativeness, 2.371 for
market/demand turbulence, 2.026 for technological turbulence and 3.446 for performance. We also assessed the degree of multi-colinearity for the factors by using VIF; the values of VIF were between 1 and 1.2 which indicate that there is no problem of multi-colinearity.
Table 3. Factor Analysis Results
Items Factor loadings Cronbach's Alpha % Variance Eigenvalue Innovativeness (KMO = 0.776) 0.80 51.05 4.085 INV7 0.87 INV6 0.79 INV8 0.70 INV2 0.68 INV4 0.68 INV1 0.66 INV3 0.65 INV9 0.60
Market/Demand turbulence (KMO =
0.76) 0.77 59.27 2.371
DT1 0.80
DT2 0.79
DT4 0.74
DT3 0.73
Technological turbulence (KMO = 0.65) 0.71 67.53 2.026
TT1 0.87 TT4 0.83 TT2 0.74 Performance (KMO = 0.83) 0.87 68.92 3.446 IP2 0.89 IP3 0.89 IP1 0.87 IP4 0.79 IP5 0.66
Cronbach’s Alpha scores were also calculated for each scale to measure the internal consistency, which defines how well items within a scale measure the same construct. The Cronbach’s Alpha score for innovativeness was 0.80, 0.77 for market/demand turbulence, 0.71 for technological turbulence, and 0.87 for performance. The overall Cronbach’s Alpha scores for the scales were between 0.71 and 0.87, which is good since reliability was high (scores >0.7 are considered good, while scores >0.8 are considered very good).
30 5.4 Hypothesis Testing
After calculating the Cronbach’s Alpha scores for each item and performing the Exploratory Factor analysis, we used Regression analysis to test our research model. Tables 4-8 show the results of the analysis.
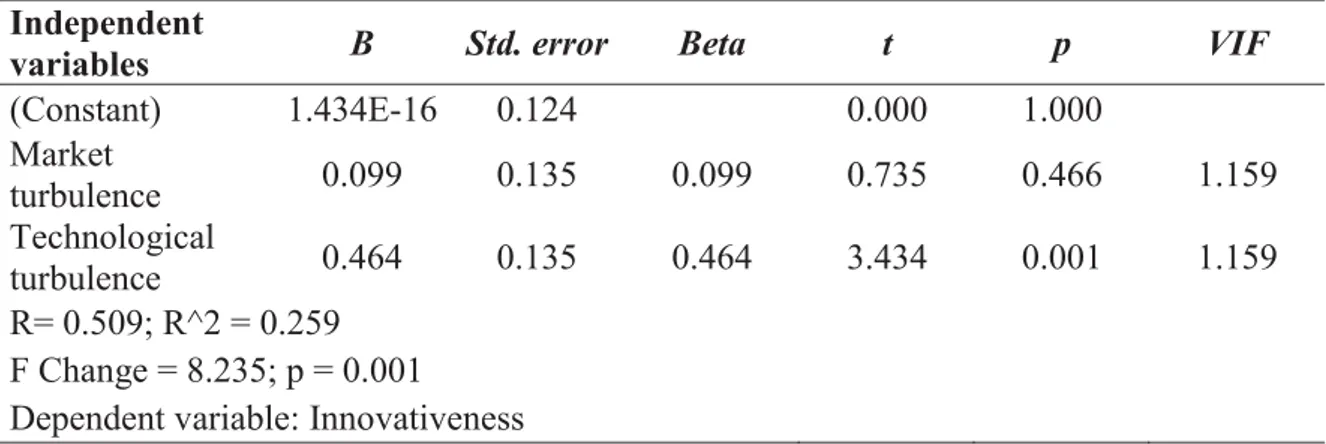
The first test studied the relationship between environmental uncertainty and innovativeness. The results in Table 4 reveal that there is a meaningful effect of the environmental uncertainty on innovativeness of firms (R = 0.509; F = 8.235; p = 0.001). Technological turbulence (Beta = 0.464; p < 0.001) has a significant positive effect on innovativeness; however, market turbulence (Beta = 0.099; p < 0.5) does not show a significant effect on innovativeness when in correlation with technological turbulence in one model. Nonetheless, when tested
separately on innovativeness, it shows more meaningful results. Table 5 displays the results of the regression of market turbulence on innovativeness. Market turbulence (Beta = 0.271; p < 0.1) has more significant results than the previous test, yet is still less significant than
technological turbulence.
Table 4. Regression analysis of environmental uncertainty on innovativeness
Independent
variables B Std. error Beta t p VIF
(Constant) 1.434E-16 0.124 0.000 1.000 Market turbulence 0.099 0.135 0.099 0.735 0.466 1.159 Technological turbulence 0.464 0.135 0.464 3.434 0.001 1.159 R= 0.509; R^2 = 0.259 F Change = 8.235; p = 0.001
Dependent variable: Innovativeness
Table 5. Regression analysis of market turbulence on innovativeness
Independent variables B Std. error Beta t p
(Constant) 1.277E-16 0.138 0.000 1.000 Market turbulence 0.271 0.139 0.271 1.954 0.057 R= 0.271; R^2 = 0.074 F Change = 3.818; 0.05 <p< 0.1 Dependent variable: Innovativeness