Master Level Thesis
European Solar Engineering School
No.190, January 2015
Electrical Evaluation of a Low
Concentrating PVT Collector
Based on Performance Ratio
Master thesis 30 hp, 2015 Solar Energy Engineering
Author:
Assem Abdel Rahman Supervisor: Frank Fiedler Examiner: Ewa Wäckelgård Course Code: MÖ3032 Dalarna University Energy and Environmental
Abstract
Photovoltaic Thermal/Hybrid collectors are an emerging technology that combines PV and solar thermal collectors by producing heat and electricity simultaneously. In this paper, the electrical performance evaluation of a low concentrating PVT collector was done through two testing parts: power comparison and performance ratio testing. For the performance ratio testing, it is required to identify and measure the factors affecting the performance ratio on a low concentrating PVT collector. Factors such as PV cell configuration, collector acceptance angle, flow rate, tracking the sun, temperature dependence and diffuse to irradiance ratio.
Solarus low concentrating PVT collector V12 was tested at Dalarna University in Sweden using the electrical equipment at the solar laboratory. The PV testing has showed
differences between the two receivers. Back2 was producing 1.8 energy output more than Back1 throughout the day. Front1 and Front2 were almost the same output performance. Performance tests showed that the cell configuration for Receiver2 with cells grouping (6-32-32-6) has proved to have a better performance ratio when to it comes to minimizing the shading effect leading to more output power throughout the day because of lowering the mismatch losses. Different factors were measured and presented in this thesis in chapter 5.
With the current design, it has been obtained a peak power at STC of 107W per receiver. The solar cells have an electrical efficiency of approximately 19% while the maximum measured electrical efficiency for the collector was approximately 18 % per active cell area, in addition to a temperature coefficient of -0.53%/ ˚C. Finally a recommendation was done to help Solarus AB to know how much the electrical performance is affected during variable ambient condition and be able to use the results for analyzing and introducing new modification if needed.
Acknowledgment
I would like to thank my family for their continuous support and encouragement. I would also like to thank Dr Frank Fiedler for his support and recommendations that guided me during my thesis work. Last but not least, I express my gratitude to Emmanouil
Contents
1Introduction ... 1
1.1 Objectives ... 3
1.2 Methods... 3
1.3 Organization of this thesis... 3
2 The characteristics of PVT collectors ... 4
2.1 Concentrating collectors ... 5
2.1.1. Compound parabolic collectors (CPC) ... 5
2.2 Solarus low concentrating PVT collectors ... 7
2.2.1. Specification ... 7
2.2.2. The receiver ... 7
2.2.3. The reflector ... 9
2.2.4. Extra features ... 10
2.3 Previous work ... 10
3 State of the Art... 12
3.1 The Market situation ... 12
3.2 Testing methods ... 13
3.3 MPPT technology ... 14
4 Theoretical background ... 17
4.1.1. Current - Voltage curve ... 17
4.1.2. Daily power curve ... 17
4.1.3. Evaluation of PV system performance ... 17
4.1.4. Temperature dependence ... 19
4.1.5. Diffuse to Global Ratio (DGR) ... 21
5 Set up and analysis of PVT collector V12 ... 22
5.1 Methodology ... 22
5.1.1. Placement ... 22
5.1.2. Dalarna Laboratory equipment ... 22
5.1.3. Measurement Set up ... 24 5.1.4. Measurement Plan ... 26 5.1.5. Boundary conditions ... 26 5.2 Calculations ... 28 5.2.1. Electrical power ... 28 5.2.2. Fill Factor ... 28 5.2.3. Efficiency... 28 5.2.4. Concentration Ratio ... 28 5.2.5. Performance Ratio ... 28 5.2.6. Solar Power ... 28 5.2.7. Uncertainty ... 29
6 Measurements and results ... 30
6.1 PV Testing ... 30
6.1.1. IV Curve comparison ... 30
6.1.2. Front1 and Front2 power comparison ... 35
6.1.3. Back1 and Back2 power comparison ... 36
6.1.4. Front2 and Back2 power comparison ... 37
6.2 Performance ratio calculation ... 39
6.2.1. Effect of different cell configuration ... 39
6.2.2. Effect of incident angle ... 43
6.2.3. Effect of flow rate ... 45
6.2.4. Effect of DGR ... 47
7 Discussion and conclusion ... 50 7.1 Discussion ... 50 7.2 Conclusion ... 51 7.3 Future Work ... 52 Bibliography... 53 Appendix ... 56
Nomenclature
𝐴𝑎 Aperture area of the PVT collector [m2] 𝐴𝑟 Receiver area of the PVT collector [m2] 𝐴𝑐𝑒𝑙𝑙 Effective cell area [m2]
CPC Compound Parabolic collector
C Concentration ratio
IAM Incident angle modifier
Pel Electrical Power [W/m2] 𝐼𝑠𝑐 Short circuit current [A] 𝑉𝑜𝑐 Open circuit voltage [V]
𝐼𝑚𝑝 Maximum power current [A]
𝑉𝑚𝑝 Maximum power voltage [V]
P𝑚𝑝 Maximum power point [W]
Pel ,ac AC electrical power
FF Fill factor
I𝐺 Global Irradiance [W/m2]
T𝑎 Ambient temperature
T𝑚 Mean fluid temperature
ɳ Efficiency [%] ɳ𝑙𝑜𝑎𝑑 Load efficiency [%] ɳ𝑒𝑙 Electrical efficiency 𝑌𝑓 Final yield 𝑌𝑟 Reference yield 𝑌𝐴 Array yield
𝐸𝐴,𝑑 Daily array energy output [kWh/day]
𝑃𝑜 Rated power [W]
𝑃𝑁 Normalized power [W]
𝐺𝐼,𝑑 Daily in plane irradiation 𝐺𝐼,𝑟 Reference irradiance [W/m2] 𝐿𝑐 Capture losses 𝐿𝑠 System losses PR Performance ratio ϑ Angle of incidence 𝛼 Solar altitude [ ˚ ] 𝛽 Collector tilt [ ˚ ] AC Alternative Current DC Direct Current
1 Introduction
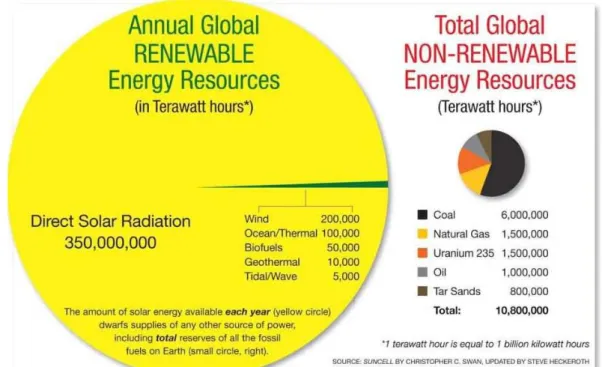
Sun as an infinite clean source of energy where the amount of solar energy that reaches the earth’s surface in one hour is greater than the global energy production in one year as illustrated in figure 1-1. With such a huge potential of the solar power, this energy can be captured and converted into electricity using various technologies.
Such technologies that can be used to harness solar energy are: - Solar thermal electricity.
- Solar photovoltaic. - Solar heating.
- Solar architecture technologies.
Figure 1-1: The amount of renewable energy available each year comparing to non-renewable energy (SAGABRUSH SOLAR, 2014)
One of these technologies is based on combing both the solar thermal collector technology with the photovoltaic technology (PV) into a one hybrid system known as photovoltaic thermal hybrid collectors (PVT). The photovoltaic cells convert the solar radiation into electricity, in addition to the solar thermal collector which transfers the heat to be used in domestic water heating or space heating. Basically combing these two technologies in one device allows the PVT collectors to produce more energy per unit surface area than side by side photovoltaic cells and solar thermal collectors. Also a higher overall efficiency can be achieved due to the fact that by circulating a colder fluid (water or air) at the underside of the PV cells reduces the operating temperature of the cells, and so increasing the PV cells performance (Kim and Kim, 2012).
PVT technology has many different configurations; one of them is through concentrating the solar radiation using optical concentrator (parabolic reflector mirrors) on a comparably smaller receiver as shown in figure 1-2. Concentrating collectors are categorized into two different types, low and high concentration described more in details in chapter 2.
Figure 1-2: Concentrating collector structure (CSP WORLD, 2014)
One of the companies that produces low concentrating PVT collectors is a Swedish SME (Small and medium enterprises) called Solarus AB, located in Gävle, Sweden. Solarus produces and develops different solar energy systems including PV systems, thermal system and hybrid systems (solar and thermal) with specific characteristics suitable for cold climate countries. Their latest product in the PVT system is V12, an asymmetric low concentrating PVT collector that can produce both electricity and heat from one integrated system using the same surface area. It has a unique design that allows the PV cells to operate at its peak electrical output and mitigates the degradation of the PV cells due to overheating. (Solarus AB, 2014)
One of the major problems that face the PVT hybrid systems is the absence of an accredited norm to evaluate its performance. Despite the fact that they had been introduced since long time, the absence of standards to precisely evaluate the performance of the photovoltaic thermal hybrid collectors in general and the electric performance in particular acted as an obstacle to the distribution of PVT collectors in the market, making it more difficult for government as well as producers to invest in this technology. Not to mention consumers also will not be able to compare different products when buying due to the lack of such standards. (Kramer and Helmers, 2013) In this thesis factors affecting the performance ratio of the PV cells on Solarus latest model V12 low concentrating PVT collector will be identified and measured, power comparison between the
different PV strings will also be measured. In addition to, study the different ways used to measure the maximum power point as well as different testing proposal for the PV cells.
The results would be interesting for Solarus AB to know how much the electrical performance is changing during variable ambient condition and be able to use the results for analyzing and
introducing new modification if needed. This thesis work was part of a larger work done at Dalarna University, which involved adjusting the test rig with the proper data and calibration for both thermal and electrical measurements using different testing procedures, study of the thermal performance for the PVT collector, each was done by different student.
The test rig and the all electrical equipment needed (described in details in section 4.2.2) are located at Dalarna University solar laboratory and will be used for the testing of the PVT collector.
1.1 Objectives
The main aim of this thesis is to evaluate the electrical performance of Solarus low concentrating PVT collector V12 through the following:
- Identify and measure factors that affect the performance ratio on V12. These factors could happen due to ambient conditions for example; incident angle on the collector, diffuse to global irradiance ratio or through external factors such as different PV cell configuration, different flow rate and tracking the sun radiation.
- Power output comparison between the different PV strings.
1.2 Methods
In order to achieve the aims of the thesis, the following steps are required:
1) Literature study on PV/T collector to gain a thorough understanding of the work needed especially for the electrical technology characterization, different testing methods and standards used to measure the electrical output in a low concentrating PVT.
2) Theoretical study on the maximum power point technology (MPPT) that is used to obtain the maximum power output from the PV cells.
3) Setting up the electrical equipment needed for the electrical performance measurements by using the laboratory equipment located at Dalarna University.
4) Identify and measure the different factors affecting the performance ratio for a low concentrating PVT.
5) Evaluate and conclude based on the measurements obtained.
6) At the end, present recommendations to Solarus AB based on the results.
1.3 Organization of this thesis
The thesis is divided into 7 chapters. Chapter 2 gives an overview on the characteristics of the concentrating PVT collectors with a detailed description of Solarus low concentrating PVT collector. In addition to, a literature review of the previous work that was done before on Solarus collectors. Chapter 3 gives the reader a background on the market situation regarding PVT
collectors, the testing proposal done before and the MPPT technology used in getting the maximum output power. Some basics information are needed to help the reader to understand the different measurements are presented in chapter 4. Chapter 5 describes the set-up of the measuring
equipment and the calculations required for the testing. The measurement and results are presented in chapter 6 in details. Finally, the results are discussed with a conclusive summary and an outlook for future work given in chapter 7.
2 The characteristics of PVT collectors
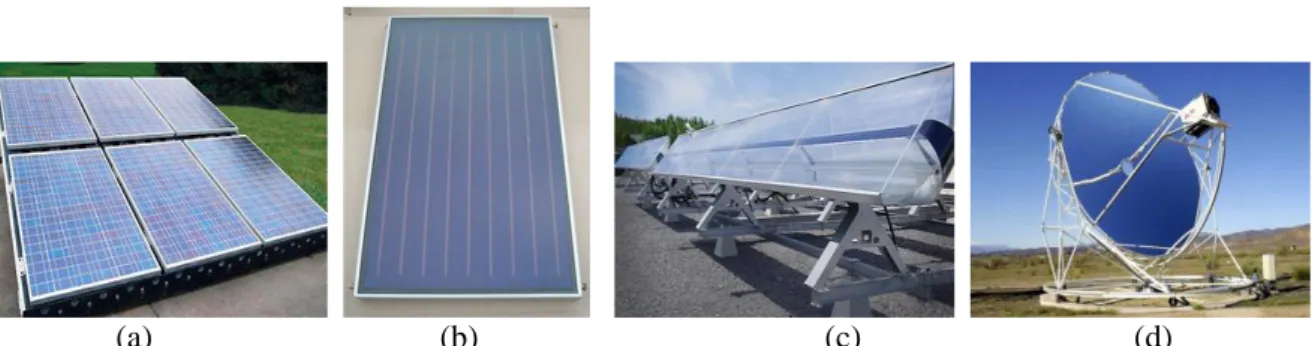
Hybrid Photovoltaic Thermal collectors (PVT) are a multifunctional systems converting solar energy into electricity and useable heat. The PV cells operate as a thermal absorber and are cooled by circulated water or air. The heat obtained from the circulation can then be used as a source for different kind of system, for example; in a domestic hot water, heat pumps or swimming pool heating system (Dupeyrat, 2010). The aim of combing these two forms of energy conversion in one product is to increase the overall efficiency and to decrease the space area needed for system installation. Figure 2-1 shows different types of PVT collector ranges from air heating collector to high concentrating dish collector used for stirling engines.
(a)
(b)
(c)
(d)
Figure 2-1: A selection of different prototypes of PVT collectors: (a) non-covered PVT air heating collector (Solarwall, 2014). (b) Covered flat plate PVT water collector (Greenterrafirma, 2014). (c) Low concentrating trough CPVT collector (Absolicon AB, 2014). (d) High concentrating dish CPVT collector (Nrel, 2014).
Many different configurations of PVT concepts have been developed, however two main categories can be identified: The first category corresponds to concentrated PVT collectors with either high or low concentration factor. The second category corresponds to flat plate collectors with either covered or uncovered with glazed surface.
.
2.1 Concentrating collectors
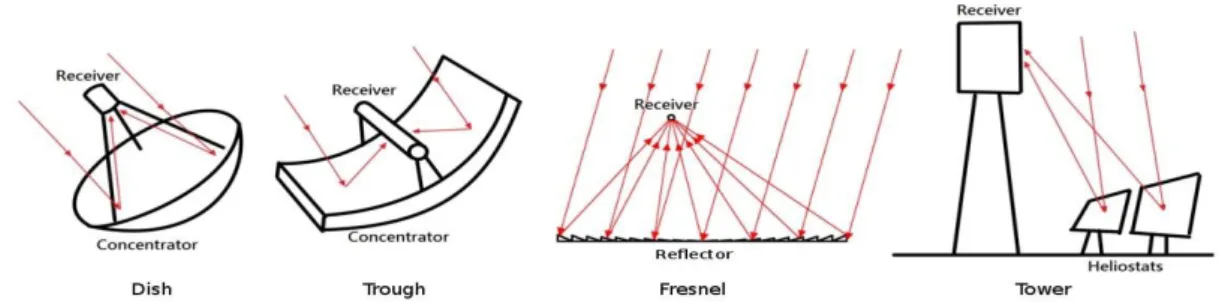
The main idea of concentrating PVT technology is based on using cheap reflecting materials that concentrate the solar radiation on a comparably smaller receiver area in order to reduce heat losses and the cost of the PV material. Concentrating collectors can be classified according to the type of concentration they use as in figure 2-3:
- Line Focus (Parabolic troughs and Linear Fresnel). - Point Focus (Dish collectors and Power towers )
Figure 2-3: Different types of concentration technology (Diwan, 2013)
Low concentrating PVT collector (LCPVT) indicates concentrating ratio of 1 to 100 and used for small applications, while high concentrating PVT collector (HCPVT) indicates concentrating ratio of 300-1000 and even higher and used for power plant applications (Helmers and Kramer, 2013).
2.1.1. Compound parabolic collectors (CPC)
These collectors are based on non-imaging technique which means no image formation of the source at the focal point. They are composed of two parabolic reflectors each with different focal point as shown in figure 2-4. Parabolas A and B concentrate the incoming radiation onto the receiver which is placed between the focus of parabola A and B called receiver opening. The acceptance angle is the maximum angle at which the incoming radiation can enter the collector through the collector’s aperture. It is considered to be very important in determining how much radiation can enter the aperture of the collector depending on the different incident angle of the Sun during the day. CPC collectors usually do not required tracking systems, however the collector has to be properly oriented in order to maximize its output power.
accept
Aperture of the CPC
Receiver opening
Parabola B Parabola A
Focus of Parabola A Focus of Parabola B Acceptance
Half- angle
Figure 2-4: Structure of Compound Parabolic collector (Bonfiglio and Giovinazzo, 2014) The MaReCo
The MaReCo (maximum reflector collector) reference design usually consists of an asymmetrical truncated CPC with a flat receiver. It is especially designed for high latitude as those experienced in Sweden and cold climate countries. It can be optimized for integration with different mounting, such as stand-alone, roof integrated or wall mounted depending on the location and the desired annual yield that is required (Adsten, 2002).
Figure 2-5 shows the basic MaReCo as follows: a) Part 2-3: Upper parabolic reflector. b) Part 1-4: Lower parabolic reflector. c) Part 1-2: Connecting circular reflector. d) Part 3-4: Aperture glazed area
e) Part 1-5: The absorber.
2.2 Solarus Low concentrating PVT collectors
2.2.1. Specification
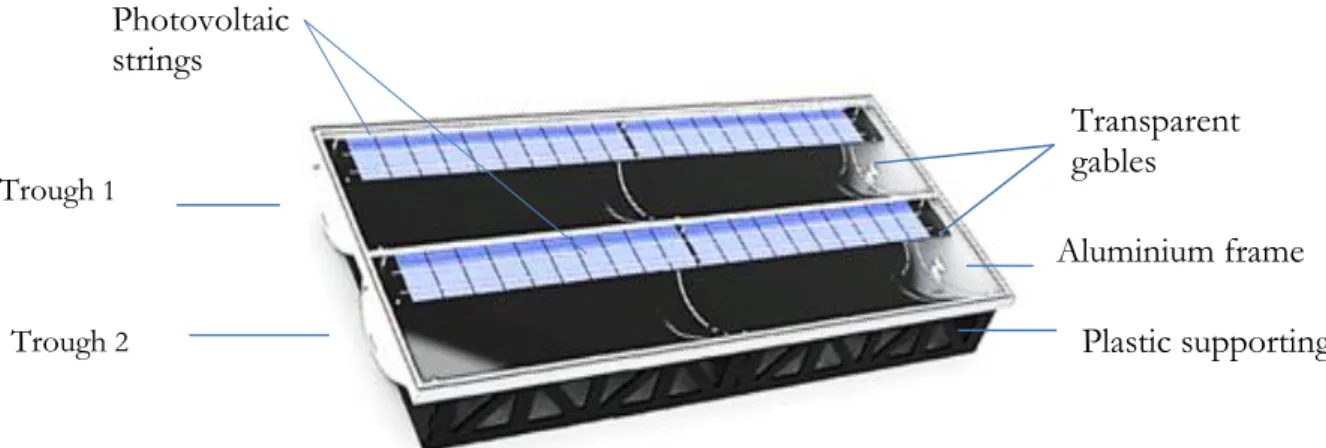
Solarus PVT collector is a roof integrated asymmetrical low concentrating collector composed of photovoltaic strings, thermal absorber, compound parabolic reflector, aluminum frame, low iron glazed protection cover and a plastic supporting structure. The collector structure is shown in figure 2-6. A black plastic frame is supporting the two troughs of the collector. A glass cover is made of low iron glass and mounted in an aluminum frame. Transparent gables are used at both sides of each trough. The photovoltaic strings are laminated to the thermal absorber which will be described in the next section.
Figure 2-6: Solarus PVT collector structure (Solarus AB, 2014)
The collector measures 2.37 m x 1.03 m x0.23 m and weights 53 kg. The glazing material is a 4 mm antireflective coated glass with 97% transmittance and aperture area of 2.17 m2 mounted in an
aluminum frame. The active area for the whole collector is about 2.046 m². It corresponds to the total glazed area minus the area taken by the internal structure that blocks the irradiance for example; the frame edges.
2.2.2. The receiver
Each PVT collector has two receivers. A single receiver measures 0.157 m x 2.3 m, composed of photovoltaic cells laminated by a high quality and electrically insulated silicone on both sides of the thermal absorber and as in figure 2-7. The upper side of the receiver works like a standard PV cells, while the lower side receives the concentrated reflected sunlight through the compound reflector by a concentration factor of 1.7 (see section 4.3.4).
Trough 1 Trough 2 Transparent gables Plastic supporting Aluminium frame Photovoltaic strings
Figure 2-7: Cross section of Solarus PVT (Solarus AB, 2014)
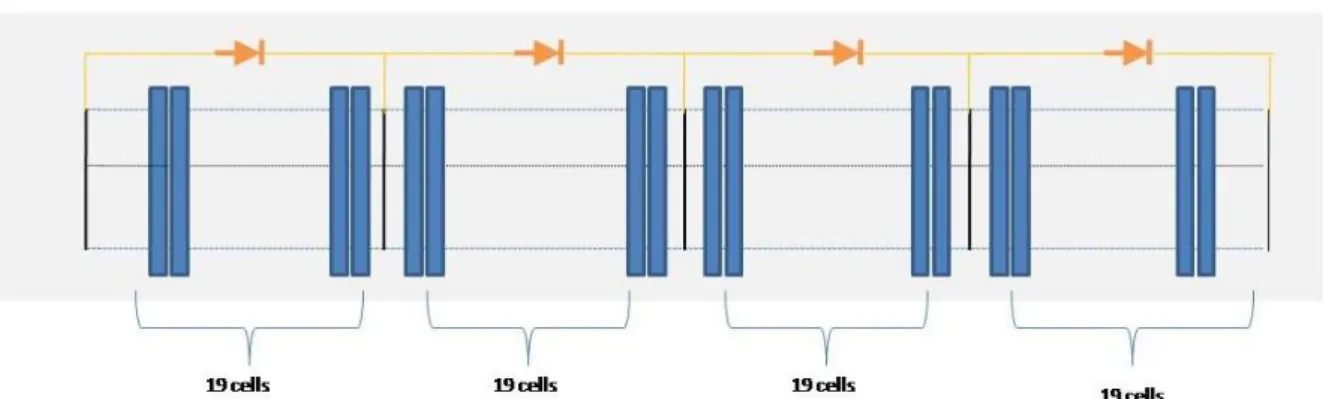
Each receiver has two identical PV strings (front and back). Each string consists of 76 cells divided into groups connected in series. A bypass diode is connected with each group. The cells are mono crystalline type of cells from Big Sun Energy with a nominal efficiency of 18.6% and an open circuit voltage of 0.636V per cell. The total cell area per receiver is 0.585m².
The electrical cell configuration is different from the previous version V11. Solarus has introduced 2 new cell configurations in this new collector, each receiver has the same number of cells (76 cells x 2) but with different grouping as show in figures 2-8 and 2-9. Receiver1 which is in trough 1 has a bypass diode after each group of 19 cells, while Receiver2 has different grouping of 6-32-32-6 with a bypass diode for each group. These configurations were presented in order to know which cell grouping can perform better throughout the day and during shading impact.
A bypass diode is placed with each group to minimize the effect shading has on a single group of cells in a series string. When a group of cells becomes shaded, the shaded cells will dissipate power as heat and cause “hot spots” acting as a high resistance and drag down the overall IV curve of the group of cells. Therefore a bypass diode will allow current to pass around the shaded cells and thereby reduce the voltage and power losses through the PV string.
Figure 2-8: Receiver1 with 19-19-19-19 grouping
Receiver Front
Figure 2-9: Receiver2 with 6-32-32-6 grouping
The absorber structure is made of aluminum. A heat-transport fluid (antifreeze, water or a mix) passes through 8 elliptic channels in the receiver core in order to remove heat from the absorber. The total thermal absorber area per receiver is 0.7253 m² (157mm x 2310mm x 2); it includes the two sides of the thermal absorber.
2.2.3. The reflector
The reflector is composed of two different shapes; a circular shape and a parabolic shape. Figure 2-10 shows a cross section of the PVT collector, the circular part (colored in orange) is facing the receiver, while the parabolic part is facing the glazed area.
Figure 2-10: Cross section of Solarus PVT collector (Bernardo et al., 2012)
The acceptance angle is defined by the optical axis of the parabolic reflector which is normal to the collector glass. If the incident radiation falls outside this angle, the reflector does not redirect the incoming beam radiation to the absorber and the optical efficiency of the collector is then reduced. Furthermore, the back strings are more affected by the variation of the incident angle on the back strings during the day impact the output power.
Solarus PVT collector has an acceptance angle of 90˚ as shown in figure 2-10. In order to calculate the angle of incidence of the solar irradiance on the titled collector, the following equation (eq.2-1) was used:
𝜗 = 90 − (α + β ) eq. 2-1
where,
ϑ is angle of incidence α is solar altitude β is tilt of the collector
Table 2-1 shows a summary of the technical specification of the Solarus PVT collector. These data represent the output of an entire collector (two troughs). The “Maximum electrical power at standard test conditions” has been modified at Solarus AB request to be 230 W at STC. Table 2-1: Solarus CPC-PVT-300W Datasheet (Solarus AB)
Technical Specifications
Dimensions (L x W x H) 2.374 mm x 1.027 mm x 231 mm
Weight 53 kg
Aperture area 2.17 m2
Gross area 2.40 m2
Maximum Electrical Power at STC 230W
Maximum Operational Temperature 200 ºC
Open Circuit Voltage (Voc) 41 V
Short Circuit Current (Isc) 8.4 A
Peak Thermal Power 1.500 W
Maximum Working Pressure 10 bar
Stagnation Temperature 180°C
2.2.4. Extra features
Compared to previous model V11, the new model has the same design, area, frame material, reflector and glass, however the new modifications are:
- More cell strings (grouping) four strings instead of two on each side of the receiver. - More space between the frame edges and the cells.
-
Better heat transfer material between the PV strings and the absorber.2.3 Previous work
Most of the work done before on Solarus low concentrating PVT collector, was to analyze and measure the electrical performance throughout measuring daily electrical performance, efficiency curves and temperature dependence of the electrical performance.
Justin (2013) investigated the electrical performance of the previous model PVT collector V11 from Solarus with two different side gables, transparent and reflective. It was found that a small difference of 1.6% in the electrical efficiency between transparent and reflective end gables. Temperature
dependence was also measured giving an electrical temperature dependence of -0.64%/ ˚C which considers to be higher than the standard PV crystalline cells temperature dependence of -0.4 ~ 0.5 %/ ˚C. The Concentration factor calculated during solar noon was 1.38 which means that the back PV cells can produce 1.38 times more output power than the front PV cells when the solar beam is within the acceptance angle of the collector.
Bernardo et al. (2013) explained the behavior of the PV strings in Solarus low concentrating PVT collector. The front string behaves like a flat plate solar cells while the back string is working under the concentration of the parabolic reflector. Electrical efficiency was measured during solar noon at 25 ˚C showing 20.9% per cell area and 13.9% per active glazed area (area of the glass which lets light into the collector). The optical properties were determined including the electrical transverse and longitudinal incidence angle modifiers during a large period of the day.
Diwan (2013) compared the overall performance (electrical and thermal) between Solarus old version V10 and V11 PVT collector with suggestion for improvement for future models. A comparison between the front string and the back string during solar noon shows a ratio of 1.3 which means that back string can produces 1.3 times more output power than the front PV cells when the solar beam is within the acceptance angle of the collector. Electrical efficiency of 12.7% per cell area was measured which was less than what Solarus specified of 18.6 % per cell area. A test on Solarus low concentrating PVT collector with bifacial PV cells was done by Gomes el al. (2013). It was found that the back side was producing 55 % of the total power during solar noon. 14.9% was the electrical efficiency per cell area for the back cells, while 13.4% for both cells. The electrical temperature dependence was -0.51%/K, which considers being close to the temperature dependence of crystalline silicon cells.
A recent performance evaluation was done on collector V11 by Bonfiglio and Giovinazzo (2014) shows that the front side of the receiver produces 25 % more electrical energy throughout the day than the back side of the receiver. Electrical efficiency of 13.73 % per cell area was measured and the estimated electrical peak power of the collector was 220 W at conditions close to the standard test conditions (STC).
A comparison between the front and the back cells was done by Puerto (2014) on collector V11. The test showed that the front string produces 22% more output energy than the back string throughout the day. It also showed that the back string is operating at its maximum point around solar noon period, but deeply affected by the shading problems before and after that period.
Electrical efficiency of 12.6 % per cell area was measured and average electrical peak power of 220 W was achieved by the collector at STC.
3 State of the art
3.1 The market situation
Basically, the PVT system depends on the development reached by both the PV sector and the solar thermal sector. Although the photovoltaic and the solar thermal materials have reached greater efficiencies and became cheaper than before, the total number of installed PVT collectors was 0.02% of the global solar thermal product market in 2010, which represents a very small market share comparing to the solar thermal or PV markets. The main reason is that PVT hybrid collectors do not have an acceptable standards and quality certification for testing and performance evaluation, which creates a severe market barrier that discourage both producers and consumers from taking any steps toward the PVT hybrid collectors’ products as they have no basics information to relay on when choosing these kind of products (Kramer and Helmers, 2013). On contrary, photovoltaic cells and solar thermal collector both have available standards for testing and evaluation based on
IEC61215 and EN12975 respectively. IEC61215 is a design qualification and type approval standard for crystalline silicon terrestrial PV modules (IEC, 2005), while EN12975 is a quality assurance in solar thermal heating and cooling technology (EN, 2006).
As a result of that, different manufactures evaluate their own products based on their individual test. It was found that two of the main producers of flat PVT hybrid collectors are using a little different description for their products:
- A Turkish manufacture of flat plate PVT collector SOLIMPEKS mentioned parameters under STC (SOLIMPEKS, 2014):
a)
Nominal power Nominal current 𝐼𝑚𝑝
Nominal voltage 𝑉𝑚𝑝 Short circuit current 𝐼𝑠𝑐
Open circuit voltage 𝑉𝑜𝑐 Maximum operating temperature Time efficiency degradation
b) Power output per collector unit under 3 different irradiation (400, 700, 1000 W/m2) each
with wind speed of 0.0 ~ 3.5 m/s.
- An Italian manufacture of Flat plate PVT collector ANAFSOLAR mentioned parameters under STC (ANAFSOLAR, 2014):
a)
Nominal power Nominal current 𝐼𝑚𝑝
Nominal voltage 𝑉𝑚𝑝 Short circuit current 𝐼𝑠𝑐
Open circuit voltage 𝑉𝑜𝑐 Maximum operating temperature Time efficiency degradation Power temperature coefficient W%/˚C Voltage temperature coefficient
𝑉𝑜𝑐%/˚C
Current temperature coefficient 𝐼𝑠𝑐 %/˚C
Different testing laboratory and institutes are using various methods for evaluating the performance of a PVT collector. For example, Eurofins scientific laboratory is using both IEC 61215:2005 & IEC 61730-2:2004 standards for measuring the part related to the electric performance of the PV
modules, in addition to EN 12975-2:2006 for measuring the thermal performance of the PVT collector (Eurofins, 2014). ITW institute of thermodynamics and thermal engineering in Germany are using EN ISO 9806:2013 for solar thermal collectors as a standard for the PVT performance which focuses more on the thermal performance rather than the electrical performance as it does not cover electrical safety or other specific properties related to electric power generation (ISO, 2014).
Using other standards for PVT testing and evaluation might not be convenient due to the fact that some tests of IEC are not suitable for covered PVT hybrid collectors (Dupeyrat et al, 2011).
3.2 Testing methods
A lot of research papers and proposals were done in order to test the electrical and the thermal performance of the PVT hybrid collectors and to present measuring standards for both of them in a formal compatible way. After that, it could be taken as a reference for evaluating the performance of PVT hybrid collectors. Some of the testing methods are related to certain extend to already existing standards used for measuring PV modules and solar thermal with the addition of few modifications to fit the PVT characteristics. Others are based on practical experiments and case studies done to specify a methodology for PVT performance evaluation.
Two proposals were found concerning the identification of a certain method of appraising the electric performance. These proposals are considered to be very useful not only to researchers but also to producers and consumers in order to provide them with knowledge and transparency in the PVT market.
Testing method LTU
A proposed testing method (Bernardo et al., 2011) was done at Lund Technical University (LTU) in Sweden to characterize the low concentrating PVT hybrid parameters in general, and the electrical performance in particular. The hybrid collector was from a Swedish company called Absolicon AB and the testing period was for nearly 3 months. The testing method was as follows:
a- The PV module should operate at its maximum power point while identifying its characterization under irradiance higher than 900 W/m2. Monitoring the electric power
output every 6 min for different temperature conditions in the collector.
b- While varying the operating temperature of the collector, the maximum electric power output together with the incident beam irradiance are used to calculate the electrical efficiency as a function of its operating temperature, in which the temperature dependence coefficient could be determined.
c- The outlet water temperature of the collector was used as the temperature of the PV module, as it’s not possible to measure the cell temperature directly because of the PVT structure. d- Measurements of IAM and monitoring the electric performance took during one day with a
stable high solar intensity to characterize the collector efficiency with different angle of incident.
e- Create a mathematical model that can describe the electrical output using the tested parameters.
f- Finally a comparison between measurements output and the model output during days with varying weather condition (unstable irradiation day) to check the model validation.
These were the steps followed throughout the case study held in order to evaluate the electrical and thermal performance of a low concentrating PVT collector.
Testing method ISE
The 2nd proposal is based on approving a testing method that was done at Fraunhofer ISE in Freiburg, Germany by trying to use the existing standards and quality assuring processes of PV and solar thermal. The study was based on the possibility of making Solar Keymark label applicable for all types of PVT collector through the following (Helmers el al., 2013). Solar Keymark label requires a certain annual energy output for certifying solar thermal collectors using an excel-based gross collector output calculator called SCEnO-Calc; therefore a derived model to measure the performance of the electrical power output Pel over the receiver area Arec comprehensively describes a PVT collector by a set of empiric coefficients.
Pel Arec
= b0I𝐺C − b1I𝐺CTm− b2I𝐺CTa − b3IG2C eq. 3-1 Where b0, b1, b2 and b3 represent the coefficient for the electrical power output, C is the concentration factor while Tm and Tm represent the mean fluid temperature and ambient temperature respectively.
This model is then used with solar Keymark framework SCEnO-Calc to calculate an annual energy output for PVT collectors.
Other methods
Hofmann et al. (2010) described a short term solution for PVT testing standard based on combining both solar thermal standards (EN 12975) & PV modules (IEC 61215). It is based on applying the functionality testing procedure (which includes both a reliability test and efficiency test) with some modification in order to be suitable for evaluating the PVT performance. Furthermore, a long term solution for PVT testing standard was suggested by Kramer al el. (2013) which was done by
combining all of the IEC, EN and TR (Technical Regulations) standard tests with the addition of some new test sequence that is required to be able to establish a new standard that should cover all PVT aspects required.
3.3 MPPT technology
MPPT (Maximum power point tracking) is an electronic system that varies the electrical operating point of the PV cells in a way that allows the cells to operate in its maximum available power (BlueSkyEnergy, 2014). The efficiency of a PV system is mainly affected by the following three factors:
g- The PV efficiency h- The Inverter efficiency
i- The MPPT technique efficiency.
Improving the efficiency of the PV or the inverter depends on the available technology and may require replacement to more advanced equipment, which might increase the system cost. However, improving the MPPT through introducing new techniques can be cheaper,utilizing the maximum power supplied by the PV cells efficiently, in addition to implementing it to already installed PV systems. A lot of techniques have been developed such as perturb and observe, incremental
conductance, neural networks, fractional open circuit voltage, current sweep, fuzzy logic control and much more (Morales, 2010).
MPPT techniques that can be implemented in a low-cost MPPT are: 1) Perturb and Observe (P&O)
2) Incremental Conductance (INC) 3) Constant Voltage (FLC)
Perturb and Observe method (P&O):
Due to its simplicity and easiness of implementation, P&O is considered to be the most used algorithm to figure the maximum operating point. This technique is based on adjusting the load every fixed period of time while continuously monitoring the change in the voltage and output power of the PV module. These changes are then observed and compared with a reference voltage and power to determine how to adjust the load whether by increasing or decreasing. In figure 3-1, P1 and P2 are two different power curves due to different irradiance. Point B on P1 is comparing with reference point A. If the output power at B is greater, the output voltage of the PV will be varied toward the same direction (downward). Else, it should be changed in the other direction (upward). By using iterative adjust and compare steps, the maximum output power of the PV system can be obtained. (Yu and Lin, 2010)
Figure 3-1: P&O Power-Voltage curve (Yu and Lin, 2010)
Incremental conductance (INC):
This technique depends on the slope of the power-voltage curve. If the slope is zero that means maximum power, positive slope means the voltage should be incremented, negative slope means the voltage should be decremented in order to reach maximum output power which is represented by slope zero. In figure 3-2, 𝐺𝑑 and 𝐺𝑠 represent the incremental conductance (
𝑑𝐼
𝑑𝑉 ) and instantaneous conductance (−𝑉𝐼) respectively. This method is based on determining the variation direction of operating point by measuring and comparing 𝐺𝑑 and 𝐺𝑠. If 𝐺𝑑 = 𝐺𝑠 this means MPP is reached, 𝐺𝑑 > 𝐺𝑠 means left of MPP and 𝐺𝑑 < 𝐺𝑠 means right of MPP.
Figure 3-2: Incremental conductance method (Yu and Lin, 2010)
Although INC is more precise in determining the MPP than P&O, both of them needs stable irradiation for accurate results. (Yu and Lin, 2010)
Constant Voltage
This method is based on the fact that the maximum power point voltage Vmp has a linear dependency on the open circuit voltage Voc under different ambient conditions represented by a constant factor k. Equation 3-1 shows the relation between Vmp and Voc, where k is a constant value depending on both the configuration and the type of the PV panels. The huge disadvantage of such method is that the PV system will be disconnected periodically to measure the open circuit voltage in order to determine the Vmp (Hohm and Ropp, 2003).
Vmp Voc = k
4 Theoretical background
4.1.1. Current - Voltage curve
A current-voltage (I-V) curve shows the relationship between the current and voltage output of a photovoltaic cell. Due to different ambient conditions (irradiation and temperature), the short circuit current (𝐼𝑠𝑐) and the open circuit voltage (𝑉𝑜𝑐) change accordingly, leading to different maximum power point as in figure (4-1).
Figure 4-1: I-V curve and P-V curve of photovoltaic cell (Solarsystemsusa, 2014)
4.1.2. Daily power curve
By measuring the daily power curve, the total electrical energy output that produced by each receiver during certain period can be determined. The amount of electrical energy generated depends on several factors, for example; orientation and tilt of the PV, shadows, number of daylight hours, intensity of the sunlight, and diffuse to global ratio DGR.
4.1.3. Evaluation of PV system performance
IEC Standard 61724
The International Electro technical Commission (IEC) is a worldwide organization that prepares and publishes International Standards for electrical, electronic and related technology. Using the IEC standard ensures that the testing methods are conducted in the same way for the same
performance of one component, independently of the installation size and the location. The international standard IEC 61724 has defined and explained some performance indices that can be used to asses PV systems. Those indices were implemented in order to make it easier to compare between different systems independently of their location, orientation, sizes or nominal power. Daily definitions of the normalized performance indices (yield and losses) given in the following sections are quoted from IEC 61724; identical symbols have been used in order simplify the understanding of the different quantities (IEC, 1998).
Daily mean yields
Daily mean yields are the quotient of energy quantities over installed array’s rated output power 𝑃0 (kW). The yields have units of (kWh/day) and indicate the amount of time during which the array would be required to operate at 𝑃0 to provide a particular monitored energy quantity.
a) The array yield 𝑌𝐴 is the daily array energy output per kW of installed PV array EA,d:
YA=
EA,d
Po
eq. 4-1
b) The final PV system yield 𝑌𝑓 represents the number of hours per day that the array would need
YA to operate its rated output 𝑃0 to equal its monitored contribution to the net daily load.
Yf = YA∗ ɳload eq. 4-2
c) The reference yield 𝑌r represents the number of hours per day during which the solar radiation would need to be at reference irradiance levels in order to contribute the same incident energy as was monitored. If GI,r = 1000 W/m2, then 𝑌r corresponds to the number of peak sun-hours per day. Yr = GI GI,r eq. 4-3 Losses
Two types of losses in a PV system are identified; array losses and system losses. Those typical losses might occur due to panel degradation, temperature, soiling, wiring, inverter, transformer or grid connection network (Mayer and Heidenreich, 2003).
Normalized losses are calculated by subtracting yields and indicate the amount of time during which the array would be required to operate at its rated power 𝑃0 in order to provide for the losses.
a) The array capture losses 𝐿𝑐 represents the losses due to array operation:
b) The system losses 𝐿𝑠 represents the losses due to the system components:
𝐿𝑠 = 𝑌𝑓− 𝑌𝐴 eq. 4-5 Performance ratio
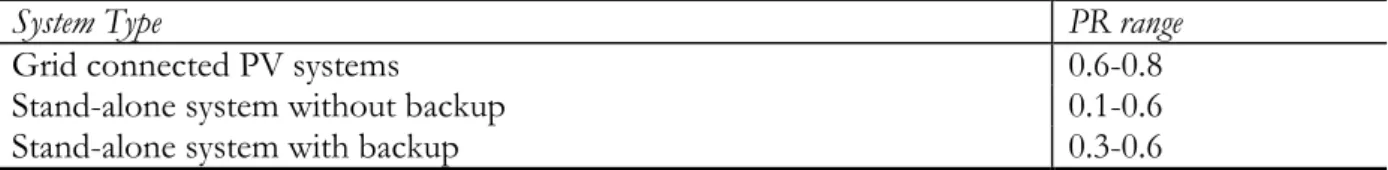
The performance ratio indicates the overall effect of losses on the PV system’s rated output due to array temperature, incomplete utilization of the irradiation, and system component inefficiencies or failures. It is defined as the ratio of final PV system yield (Yf) to reference yield (YR) and denoted PR.
𝑃𝑅 = 𝑌𝑓 𝑌𝑅
eq. 4-6
The higher the performance ratio, the better the PV system is. A low PR means considerable amount of losses occur in the system due to technical or design problems. Different systems can have different performance ratio values as shown in table 4-1 below.
Table 4-1: Different PR range depending on the system type. (IEA-PVPS, 2004)
System Type PR range
Grid connected PV systems 0.6-0.8
Stand-alone system without backup 0.1-0.6
Stand-alone system with backup 0.3-0.6
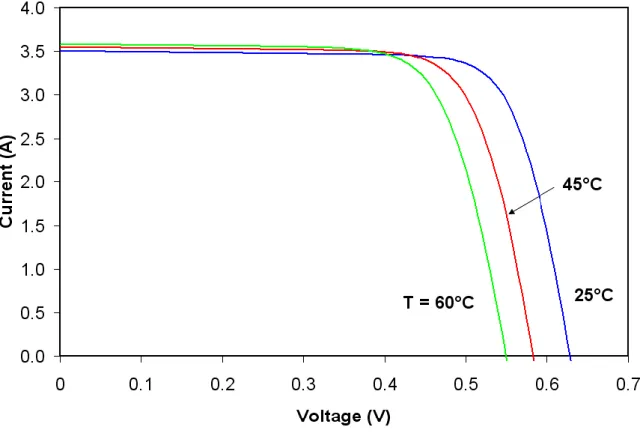
4.1.4. Temperature dependence
When the cell temperature rises, the open circuit voltage largely drops comparing to the short circuit current which slightly decreases as in figure 4-2. This voltage and current drop will give less output power which means the less the cells temperature are, the more output power will be produced. Different types of PV cells have different temperature dependency characteristics, for example crystalline silicon cells have temperature coefficient of approximately -0.45 ~ -0.5% /˚C comparing to conventional thin film cells (CdTe) which have weaker temperature dependency with a
Figure 4-2: Solar cell I-V characteristics temperature dependency (Wikipedia, 2014)
One way to monitor the temperature dependence of the PV cells of a PVT collector is by varying the flow rate of the fluid inside the collector. Low flow rate will decreases the heat transfer between the absorber and the fluid leading to higher outlet temperature which will decrease the output power. On the other side, high flow rate will increase the heat transfer value leading to lower outlet temperature which will increase the output power.
Points to consider when measuring the temperature dependence:
- At the beginning, the flow rate was adjusted based on the collector area as stated in the (EN12975) which is equal to 0.02 Kg
m2 ∗ collector area m
2 ∗ 3600 (s
h) = 0.02 * 2.0284 * 3600 = 146 kg/h in case of using the whole area (connecting the two receivers in parallel). - The minimum flow rate was 15 l/h and it is capable of producing an outlet temperature of
53˚C which could be suitable for domestic water usage.
- The total cell area per receiver is 0.585 m2 which was used in the efficiency calculation.
The PV cell efficiency is calculated based on the following equation:
ηel =
Pel 𝐴𝑐𝑒𝑙𝑙∗ I𝐺
4.1.5. Diffuse to Global Ratio (DGR)
Global irradiance received at the ground surface consists of two major components: direct-beam radiation and diffuse sky radiation. Diffuse sky radiation is the sunlight that has been scattered in the atmosphere until reaching the earth surface as illustrated in figure 4-3. The ratio of the scattered solar radiation from direct solar beam to the global radiation received from the sky assumes to have a great impact on the performance of PV modules especially for concentrating collectors.
Figure 4-3: Different types of Radiation
Diffuse to global ratio (DGR) varies depending on latitude and environmental conditions, the higher the latitude, the more diffuse radiation in the sky, also the larger the air mass, the more the diffuse radiation. Based on the photovoltaic geographical information system (PVGIS), the geographic location of Borlänge is experiencing a DGR of 0.55 across the year.
5 Set up and analysis of PVT collector V12
5.1 Methodology
5.1.1. PlacementSolarus LCPVT collector was tested in the solar laboratory at Dalarna University in Borlänge, Sweden and tested between July 2nd and August 12, 2014. The laboratory is located on the roof of
the university where the collector is mounted at angle of 35˚ to the horizontal on a test stand facing due south without any automatic tracking system as in figure 4-5. The test stand is fixed on a movable board, making it easy to rotate manually in the east-west direction.
5.1.2. Dalarna Laboratory equipment
Test Rig
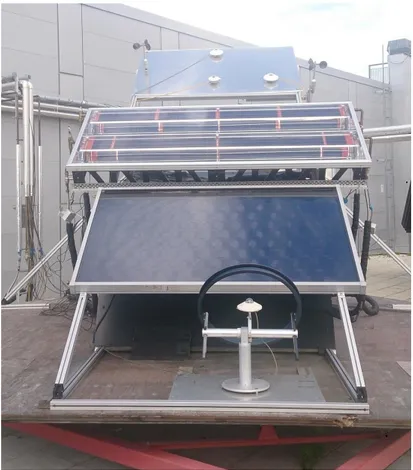
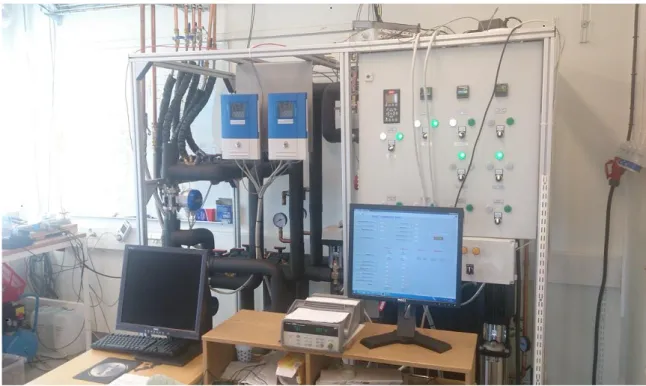
The test rig has two parts, a test stand on the roof of Dalarna University where the collector and the sensors are fixed figure 5-1. The second part is an indoor laboratory controlling the flow and the temperature of the fluid inside the collector as seen in figure 5-2.
The test rig is capable of measuring two separate collectors at the same time as it was built with two independent thermal circuits making it easier to operate two collectors at the same time under the same conditions and compare them if needed.
Figure 5-1: The upper collector is the CPVT collector while the lower collector is a flat plate collector installed on the test stand at Dalarna University roof.
Figure 5-2: The indoor test rig at Dalarna University
Solar-4000 analyzer
The Solar-4000 analyzer is a high quality measurement instrument manufactured by a German company called AMPROBE Company. It is capable of determining the IV characteristic curve,
𝐼𝑠𝑐, 𝑉𝑜𝑐, 𝐼𝑚𝑎𝑥, 𝑉𝑚𝑎𝑥, 𝑃𝑚𝑎𝑥 and FF with an accuracy of ±1%. Using the device’s software, the measured IV curve can be extrapolated according to the standard test conditions (STC). Solar-4000 sensor
The solar 4000 sensor is also manufactured by AMPROBE. It is used to determine the inclination of the PV module, global irradiance and the surface temperature of the PV module with an accuracy of ±5%. The measurements recorded are then transmitted wirelessly to the Solar-4000 analyzer. Pyranometer
All pyranometer are from Kipp & Zonen Company. Two models were used for measuring the global irradiance CM3 and CM6 with an accuracy of ±2%. One model CM11 combined with a shadow ring is used to measure the diffuse irradiance with an accuracy of ±1%. The beam irradiance is then calculated by subtracting the diffuse irradiance from the global irradiance.
Temperature sensors
The five sensors used are PT100 with an accuracy of ±0.3˚C. Two for the inlet and two for the outlet of the 2 receivers, and the last one is used to measure the ambient temperature where it has to be placed in a shaded area to avoid being heated.
Agilent 34972A
Agilent 34972A is a data acquisition unit from NATIONAL INSTRUMENTS which is used to collect all the data required from the measuring devices (pyranometer, temperature sensors, flow meter and other sensors in the lab. A software programme named LABVIEW on a desktop computer reads the data from the data acquisition unit, saving it to an excel file.
Solar DC/AC MicroInverter
A micro inverter from a Chinese company called INVOLAR is used to convert the DC current coming from the PV panels of the collector to an AC current which is then fed to the grid. With a peak electrical efficiency of 95%, the MicroInverter is using a maximum power point tracking technology that allows the panel to perform at its maximum power point in order to minimize losses. The input for the MPPT voltage range is 22V ~ 40V.
AC Energy logger 3500
AC energy logger 3500 is an energy monitoring device from a German company called VoltCraft which was used to display and records the amount of AC power supplied to the grid. The Data is saved on an internal memory, which was then transferred by an external SD card to a computer in order to be analyzed using energy logger software. It can also calculate the energy cost for the overall consumption of the electrical device. The accuracy is depending on the input AC power:
- 5-3500 W accuracy of ±1%. - 2-5 W accuracy of ±5%. - < 2 W accuracy of ±15%. Tillquist Transducers
VU400 and VI400 are voltage and current transducers from a Swedish company called HUGO TILLQUIST AB. They convert the measured quantities of current and voltage into a proportional load independent DC signal. The output signal is then connected to the Data acquisition unit in order to be recorded and displayed on computer through LabView programme. Tillquist transducers have an accuracy of <± 0.2%.
For more information about the equipment details, see the appendix.
5.1.3. Measurement Set up
The electrical equipment described in section 5.1.2 has been used in the measurements at Dalarna University. Since there was no automatic variable load that could be used to extract the maximum power output of the PV cells, a micro inverter was bought with a built in MPP tracker in order to trace the maximum power point. In addition to convert the DC power coming from the PV panels into AC power supplied to the grid. Voltage and current transducers were used to feed the
acquisition unit with the PV panel current and voltage. Data was recorded every 10 seconds and saved on an excel file on a desktop computer by the LABVIEW software programme.
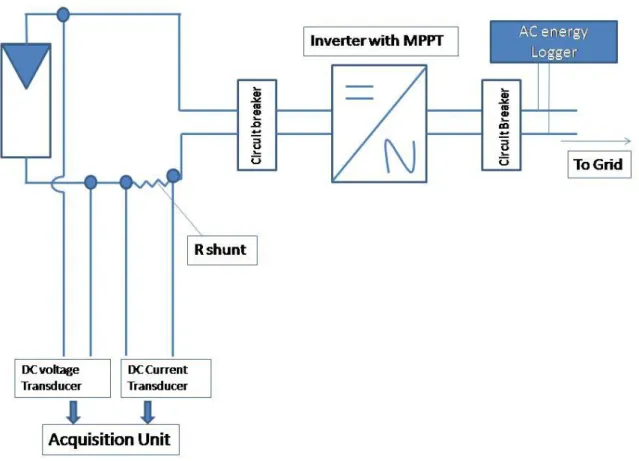
Figure 5-7 shows the schematic diagram of the measurement set up. Parallel connections to the PV cells and to a shunt resistor were used to measure both the 𝑉𝑚𝑝 and 𝐼𝑚𝑝 respectively, which is then connected to the acquisition unit through the voltage and current transducers. Circuit breakers were installed before and after the inverter to protect the electrical circuit from damage caused by
overload or short circuit. Energy logger 3500 was connected between the main socket and the MicroInverter acting as an AC meter through monitoring and recording the AC power supplied to the grid.
The AC data is then taken by an external SD card from the energy logger in order to use it on a desktop computer in the performance ratio calculations.
Figure 5-7: Schematic diagram for the electrical measurement set up
A photo of the measurement set up at Dalarna laboratory is shown in figure 5-8.
A portable digital multimeter was used to measure 𝐼𝑠𝑐 and 𝑉𝑜𝑐 of the PV cells. The solar 4000 analyzer is connected in parallel with the required PV string to measure its IV curve then the irradiance and inclination measured by the solar 4000 sensor is transferred wirelessly to the solar analyzer.
5.1.4. Measurement Plan
A detailed measurement plan was initially devised as in table to gather all the necessary data required for the measurement. However, due to the unpredictable weather conditions, it might be subject to change according to the available circumstances. It was recommended to start with measuring the IV curves of each PV string separately to make sure that the PV cells in different troughs are having the same characteristics.
Table 5-3: Summary of the measurement Plan Measurement required Number of
Days Time needed Weather condition Description IV curves for each
PV string 1 During Solar noon Clear To make sure that the PV string has the same characteristics Comparison
between Front1
and Front2 1 Whole day
Partially sunny
To check the power output difference between the front PV strings
Comparison between Back1 &
Back2 1 Whole day
Almost clear
To check the power output difference between the back PV strings
Comparison between front and
back 1 Whole day
Almost clear
To check the power output difference between the front and the back PV strings
Daily performance for Receiver1 and
for Receiver2 2 Whole day
Similar conditions
To check the daily performance for each receiver
Incident angle on
the back 1 before solar 4 hours
noon Clear
To check the effect of the incident angle on the back PV string’s performance Temperature dependence on the receiver 1 During Solar noon Clear
To check the effect of the temperature on the receiver’s performance
Diffuse to Global
ratio on the back 1 During Solar noon To check the effect of the diffuse ratio on the back’s performance Tracking the Sun 1 Whole day Partially
clear To check the daily performance for the receiver
In case of need 4 ---- ----
5.1.5. Boundary conditions
The evaluation of the measurements was limited by the following number of factors: Weather conditions
Most of the days during the measurements was in July, the weather were almost sunny or partially sunny with mild amount of cumulus clouds. According to the solar irradiation data monitored by photovoltaic geographical information system (PVGIS), Borlänge coordinates (60.3, 15.3)
experiences a diffuse to global irradiation (D/G) of nearly 53% during July based on the Institute for environment and sustainability renewable energies unit in Italy.
Time Limit:
Usually the performance ratio is calculated on an annual or monthly basis in order to precisely evaluate the PV performance. However measurements were done based on daily performance basis, as monthly or annual performances could not be performed due to limitation of time and
unpredictable weather conditions during the measuring period. String Switch
Testing two different PV strings at the same day guarantee that both of them are experiencing the same ambient conditions, however due to the limited testing equipment, a manual switch was used to divert from one string to another every 4 minutes. This time interval could have a large impact on the results especially when there is passing clouds during this period, plus switching manually
between the strings would lead to inaccurate time interval. Inverter efficiency
The used inverter has an electrical peak efficiency of 95%. However, because of the inverter efficiency behavior as shown in figure 5-9, the inverter efficiency curve are much lower for low power values which could happens when low irradiance occurs during the measurements. I addition to, the MPP tracking performs between input 22V ~ 40V which means tracking mismatch might occurs in case of different input voltage.
5.2 Calculations
The following equations have been used in the calculations needed for the performance evaluation. All the symbols are explained in the Nomenclature.
5.2.1. Electrical power
The equation for the maximum electrical power output of the PVT collector is:
𝑃𝑒𝑙 = 𝑉𝑚𝑝 ∙ 𝐼𝑚𝑝 eq. 5-1
5.2.2. Fill Factor
The fill factor is the ratio of the solar cells actual power output versus its 'dummy' power output and it can be calculated as follows:
𝐹𝐹 =𝐼𝑚𝑝 ∙ 𝑉𝑚𝑝 𝐼𝑠𝑐 ∙ 𝑉𝑜𝑐
eq. 5-2
5.2.3. Efficiency
The efficiency is the ratio of energy output from the solar cell to the input energy coming for the sun and it is calculated as follows:
𝜂𝐸𝑙 % = 𝑃𝑒𝑙 𝐴𝑐𝑒𝑙𝑙 ∙ 𝐼𝐺
eq. 5-3
5.2.4. Concentration Ratio
The concentration ratio is calculated by dividing the aperature area of the collector Aa to the receiver area Ar as follows:
C =Aa Ar =0.273 ∗ 2.31 0.158 ∗ 2.31 = 1.7 eq. 5-4 5.2.5. Performance Ratio
The performance ratio is calculated as stated in section 4.1.3 PR = Yf
YR
eq. 5-5
5.2.6. Solar Power
The solar power is calculated multiplying the global irradiance IG by the aperture area Aa as follows:
5.2.7. Uncertainty
Every device has different uncertainty for its measurement as listed below in table 5-2. Table 5-2: Summary of uncertainties in the devices used
Measurement devices Uncertainty
Pyranometer ±2%
Pyranometer with Shadow ring ±1%
Temperature sensors PT100 ±0.3%
Solar 4000 analyzer ±1%
Solar 4000 sensor ±5%
Voltage and Current transducers <± 0.2%
AC energy Logger 3500 5-3500 W accuracy of ±1%
2-5 W accuracy of ±5% < 2 W accuracy of ±15%
The uncertainty in the electrical power is calculated as:
∆Pel = ±Pel ( ∆V V ) 2+ (∆I I) 2 eq. 5-7
The uncertainty in the solar power is calculated as:
∆Ps = ±Ps (∆I𝐺 I𝐺 )2+ (
∆Aa Aa )2
6 Measurements and results
The measurements are divided into two parts: The first part is the PV testing where IV curves and power comparison measurements are done in order to characterize each PV string’s performance. The second part is to identify and calculate the factors that affect the PV’s performance ratio in order to measure how much they could affect the performance ratio results.
6.1 PV testing
For the power comparison test, an average value was taken every 5 minutes for both Global
irradiance and output power to minimize the power fluctuation that appears when measurement was taken every 10 seconds.
6.1.1. IV Curve comparison
Because of the difference in cells configuration of the two receivers, the IV curve of each string has been measured separately to characterize its voltage and current relationship and to be able to compare them with each other. There should be no difference between the fronts together and backs together.
Procedure
July 12th 2014, the Solar 4000 analyzer is connected directly to each PV string during solar noon with
clear sky to measure its IV curve. The solar was 52˚ at that time and therefore the incident angle is 3˚ calculated using equation 2-1. Solar 4000 sensor is fixed at the same tilt as the collector to measure the inclination of the collector and the global irradiance. Data was then transferred to a PC through an external SD card for analyzing and the collector was fixed toward south.
Results
Fronts: The IV curves show similarity which mean both of them are performing the same (Figure 6-1 and 6-2).
Backs: The IV curves were not smooth showing some differences in a form of a current drop which means that there is mismatch between the cells due to uneven distribution of the light among the cells (Figure 6-3 and 6-4).
Figure 6-1: IV-curve for Front1
Table 6-1: Data measured for Front1
Date Time Irradiance (W/m2) (A) 𝑰𝒔𝒄 𝑽(V) 𝒐𝒄 𝑰(A) 𝒎𝒑 𝑽(V) 𝒎𝒑 𝐏(W) 𝒎𝒑 FF
Figure 6-2: IV-curve for Front2
Table 6-2: Data measured for Front2
Date Time Irradiance (W/m2) (A) 𝑰𝒔𝒄 𝑽(V) 𝒐𝒄 𝑰(A) 𝒎𝒑 𝑽(V) 𝒎𝒑 𝐏(W) 𝒎𝒑 FF
Figure 6-3: IV-curve for Back1
Table 6-3: Data measured for Back1
Date Time Irradiance (W/m2) (A) 𝑰𝒔𝒄 𝑽(V) 𝒐𝒄 𝑰𝒎𝒑
(A) 𝑽𝒎𝒑 (V) 𝐏𝒎𝒑 (W) FF 12-07-14 12:25 pm 1006 1.77 46.19 1.48 37.73 55.9 0.69
Figure 6-4: IV-curve for Back2
Table 6-4: Data measured for Back2
Date Time Irradiance (W/m2) (A) 𝑰𝒔𝒄 𝑽(V) 𝒐𝒄 𝑰𝒎𝒑
(A) 𝑽𝒎𝒑 (V) 𝐏𝒎𝒑 (W) FF 12-07-14 12:28 pm 1001 1.81 46.19 1.57 37.21 58.5 0.7
By visual inspection of the backs during solar noon, it was found that the reflected beam was not at the same focal point of the back cells as shown in figure 6-5. The beam was 3.5 cm from the receiver’s edge in Back1, while Back2 the beam was 2.5 cm from the reciever’s edge. In addition to that, the light was not evenly distributed across the cells which might be a reason for mismatch to occurs.
(a) (b)
Figure 6-5: (a) Beam reflected on Back1, (b) Beam reflected on Back2
6.1.2. Front1 and Front2 power comparison
According to the IV curves measured, Front1 and Front2 should operate the same as they almost have similar results (table 6-1 and 6-2).
Procedure
July 5th 2014, measurements of the PV current and voltage were recorded from 8:00 till 17:26 and
then the output power is calculated based on equation 4-4 by LabView. The circuit breaker was used as a switch to divert from Front1 to the Front2 manually every 4 minutes. The missing data in-between was interpolated in order to be able to calculate the total output energy (Area under the curve). The first half of the day was taken for analysis from 8:00 till 13:00 due to the large diffuse radiation after solar noon. The collector was fixed toward south. For the whole day power measurement, see the appendix.
Results
Figure 6-6 represents the daily power output of Front1 and Front2 together. However based on the overall performance, Front2 produces more output energy throughout the day by a factor of 1.04 as shown in the values calculated in table 6-5.
Figure 6-6: Daily output power for Front1 and Front2
Table 6-5: Shows the total energy during the measured period (Half day)
Time Front1 (kWh) Front2 (kWh) Ratio 𝑭𝒓𝒐𝒏𝒕 𝟏
𝑭𝒓𝒐𝒏𝒕 𝟐
8:00 to 13:00 0.141 0.146 0.97
6.1.3. Back1 and Back2 power comparison
According to the IV curves measured, Back2 showed better maximum power output and maximum current than Back1 as shown in (table 6-3 and 6-4).
Procedure
July 4th 2014, measurements of the PV current and voltage were recorded from 8:00 till 17:22 and
then the output power is calculated based on equation 4-4 by LabView. The circuit breaker was used as a switch to divert from Back1 to the Back2 manually every 4 minutes. The missing data
in-between was interpolated in order to be able to calculate the total output energy (area under the curve). The first half of the day was taken for analysis from 8:00 till 13:00 due to the large diffuse radiation after solar noon. The collector was fixed toward south. For the whole day power measurement, see the appendix.
Results
Figure 6-7 represents the daily power production of Back1 and Back2 together. However based on the overall performance, Back2 produces more output energy throughout the day by a factor of 1.8 as shown in the values calculated in table 6-6.
Figure 6-7: Daily output power for Back1 and Back2
Table 6-6: Shows the total energy during the measured period (Half day)
Time Back1 (kWh) Back2 (kWh) Ratio 𝑩𝒂𝒄𝒌 𝟏𝑩𝒂𝒄𝒌 𝟐
8:00 to 13:00 0.058 0.104 0.56
6.1.4. Front2 and Back2 power comparison
Due to the concentration factor, the front and the back of the receiver are exposed to different concentrations of light. Front2 and Back2 were measured to see whether the relation in the output power is similar to the concentration ratio. The concentration ratio is equal to 1.7 as calculated by equation 4-7 in section 4.3.4, therefore Back2 should operate at 1.7 more output power than Front2 during solar noon due to the concentration factor.
Procedure
July 21th 2014, measurements of the PV current and voltage were recorded from 7:43 till 18:00 and
then the output power is calculated based on equation 5-1 by LabView. The circuit breaker was used as a switch to divert from Front2 to the Back2 manually every 8 minutes. The missing data in-between was interpolated and represented in figure 6-8 as straight lines connecting the data points in order to be able to calculate the total output energy (area under the curve). The first half of the day was taken for analysis from 8:00 till 13:40 due to the large diffuse radiation after solar noon. The collector was fixed toward south. For the whole day power measurement, see the appendix. Results
Table 6-7 shows random measurements taken for Back2 and Front2 during solar noon. Because of the concentration factor, Back2 was operating with 1.22 more output power comparing to Front2.
Table 6-7: Front2 Vs Back2 during solar noon
Time irradiance Global (W/m2) Front2 DC output (W) Back2 DC output (W) Ratio 𝑩𝒂𝒄𝒌 𝑭𝒓𝒐𝒏𝒕 13:00 1086 49.32 57.38 1.16 13:17 1116 49.15 61.53 1.25 13:35 1192 49.94 63.44 1.27 Average 1.22
Figure 6-8 represents the daily output power of Front2 and Back2 together. Starting from 12:00 pm and around solar noon, Back2 performs better than Front2 by a factor of 1.22. However based on the overall performance, Front2 produces more output energy throughout the day by a factor of 1.17 as shown in the values calculated in table 6-8.
Figure 6-8: Daily output power for Front2 and Back2
Table 6-8: The total energy during the measured period (Half day)
Global Irradiance
(kWh) Front2 (kWh) Back2 (kWh) Ratio
𝑭𝒓𝒐𝒏𝒕 𝟐 𝑩𝒂𝒄𝒌 𝟐
4.5 0.2 0.17 1.17
6.2 Performance Ratio calculation
6.2.1. Effect of different cell configuration
Based on the IV curves measured and the maximum power output during solar noon, the two receivers should operate at the same behavior, however due to different cells configuration, difference in the output power should occur in periods before and after solar noon. According to Solarus AB, there should be a difference of 30% between the two receivers in the total output energy.
Procedure
July 11th 2014, measurements of the PV current and voltage of Receiver1 were recorded from 7:50
till 18:30 and then the output power is calculated based on equation 5-1 by LabView. July 10th 2014,
measurements of the PV current and voltage of Receiver2 were recorded from 7:55 till 18:20 and then the output power is calculated based on equation 4-4 by LabView. The AC output power figures (6-11 and 6-12) were extracted from the AC energy logger 3500. The measurements were done in two days (almost sunny) with approximately similar daily irradiance. The collector was fixed toward south.
Results
Figure 6-9 presents the daily performance DC output power during the day giving 0.42 kWh/ day. The AC output power was also measured and presented in figure 6-10 with a total output of 0.373 kWh/ day. Figure 6-11 presents the daily performance DC output power during the day giving 0.57 kWh/ day. The AC output power was also measured and presented in figure 6-12 with a total output of 0.516 kWh/ day.
The inverter efficiency was then calculated by dividing the AC output with the DC output as shown in the results in tables 6-9 and 6-10. The Daily irradiance on day 11 was slightly lower than day 10 due to the presences of some cumulus clouds during solar noon, leading to higher daily power output for Receiver2 by 0.15 kWh comparing to Receiver1. The performance ratio was then calculated based on equation 5-5; Receiver2 showed better performance ratio comparing to Receiver1 with a difference of 30.8 %.
Receiver1
Figure 6-10: Daily output power of Receiver1 (AC power)
Table 6-9: Data calculated for Receiver1 Date Daily Irradiance kWh/m2/day
Daily power output kWh (DC) Daily energy output kWh (AC) PR Inverter ɳ 11-07-2014 7.31 0.42 0.373 0.44 89 %
Receiver2
Figure 6-11: Daily output power of Receiver2 (DC power)