I
Civic Engagement and Political Trust of
Young People in Sweden
in relation to their immigration
backgrounds
Ayşe Naz Ünver
One-year Political Science MA programme in Global Politics and Societal Change Dept. of Global Political Studies
Course: Political Science Thesis ST632L (15 credits) Spring Semester/ 2020
II
Abstract
Currently, nearly 25% of people living in Sweden have foreign background. With one in every four people having immigration background, the question “how does civic engagement and political trust of people differ depending on their immigration backgrounds?” becomes important. More to the point, how does civic participation and political trust differ amongst young people living in Sweden in relation to their immigration backgrounds?
In order to answer these questions, this thesis uses data from the European Social Survey and looks into the political trust and civic engagement behaviors of young people living in Sweden who have different immigration backgrounds by forming three groups; native- Swedes, second-generation immigrant-origin individuals and first-generation immigrants.
The analysis is done by using SPSS and performing statistical analysis. Chi-Square and Kruskal-Willis tests were used, as well as descriptive statistics and cross tables. The results show that there is a statistically significant difference for civic participation due to immigration background, but the same cannot be said for political trust.
Keywords: civic engagement, European Social Survey, first-generation, immigration, migration, second- generation, political trust, statistical analysis, SPSS, youth.
III
Table Of Contents
Abstract ... II 1. Introduction ... 1 1.1. Disposition... 2 2. Literature Review ... 3 2.1. Immigration ... 3 2.2. Youth... 62.3. Youth in the EU and Their Political Attitudes... 6
2.4. Research with the ESS data... 9
3. Conceptual Framework ...10
3.1. Civic Engagement ...11
3.2. Political Trust ...12
4. Research Design and Method ...14
4.1. Data ...15
4.1.1. The European Social Survey ...15
4.2. Adjustments in the ESS Data...17
5. Empirical Results ...22
5.1. Demographic Information ...22
5.2. Statistical Analysis and Results ...26
5.2.1. Immigration Background and Civic Engagement ...26
5.2.2. Immigration Background and Political Trust ...37
6. Conclusion ...44
6.1. Future Research ...47
IV
Lists of Charts, Figures and Tables
Chart 1. Births, Deaths, Emigration and Immigration in Sweden between 2000 to 2017. . . 4
Chart 2. Voted in the last national election. . . . .27
Chart 3. Worked in a political party or in an action group in the last 12 months. . . . .29
Chart 4. Contacted a politician or a government official in the last 12 months. . . . .31
Chart 5. Worn or displayed campaign badges or stickers in the last 12 months. . . . .33
Chart 6. Trust in the country's parliament . . . 36
Chart 7. Trust in Politicians. . . . 38
Chart 8. Trust in the European parliament. . . . 40
Figure 1: Age of respondents. . . . 21
Figure 2. Immigration background of respondents. . . . . . . 22
Figure 3. Country of birth of the respondents, first-generation immigrants. . . . 23
Figure 4. Mother’s country of birth, second-generation immigrant origin individuals. . . . .23
Figure 5. Fathers country of birth, second-generation immigrant origin individuals. . . . 24
Figure 6. Kruskal-Wallis, parliament vs. immigration background . . . .36
Figure 7. Kruskal-Wallis, politicians vs. immigration background. . . . 38
Figure 8. Kruskal-Wallis, European Parliament vs. immigration background. . . . .39
Table 1. Chi-Square test, voting vs. immigration background. . . . . . . 26
Table 2. Crosstabulation, voting vs. immigration background. . . . .26
Table 3. Chi-Square test, action group vs. immigration background. . . . .28
Table 4. Chi-Square test, contacting authority vs. immigration background. . . . .30
Table 5. Crosstabulation, contacting authority vs. immigration background. . . . .30
Table 6. Chi-Square test, campaign badges. immigration background. . . . .32
Table 7. Chi-Square test, demonstration vs. immigration background. . . . .34
1
1. Introduction
The aim of this thesis is to answer the question “How does civic engagement and political trust of young people in Sweden differ depending on their immigration backgrounds?”. In order to answer this question, I will examine the current situation for civic participation and political trust amongst three groups of young people with different immigration histories who live in Sweden; native Swedes, second- generation immigrant-origin individuals and first-generation immigrants. While the first group does not have immigration background in Sweden, the second and third group does.
The reason for this research lies in its relevance to global politics. Steger (2009) states that the concept of globalization refers to the changing of economic, political and cultural processes (2009: 23). In a world where people migrate frequently due to social and political reasons; examining the ramifications of migration on youth and their political activities is especially important.
As migration becomes more and more prominent across the globe; people are migrating to other countries because of humanitarian crises, as well as economic or cultural reasons. While moving to another country because of war or human rights violations may seem as directly political; other reasons such as moving to have a better education or to find better employment seem more personal than political. However, economic and social aspects of a country are also deeply linked with global politics as well as the inside governance of the country (Ghatak and Sassoon, 2001). A Consequently, even when the reason for migration does not seem political at first, it may have underlying political links. Seeing that global politics end external migration are thus connected, understanding how migration affects young people’s political behavior also has great importance.
This research focuses on young people because they will be the ones determining politics both in local and global sense in the coming years (Diuk, 2012: 2). Very little of the existing research focuses on youth and compares the differences in their political behaviors in relation to their immigration history (Landberg et al., 2018; Dahl et al. 2018; Quintelier, 2019; Franz, 2006), with many of them focusing on people of all ages (Maxwell, 2010; Lekby, 2010; Waldring et al., 2015; Nekby, 2010; Hellgren, 2012).
2 The goal of this thesis is to see how civic engagement and political trust of youth in Sweden differ depending on their immigration backgrounds. This research examines the relationship immigration background has with levels of political trust and civic engagement of the youth in Sweden. The thesis focuses on civic engagement and political trust, because there is a strong correlation between the two (Eder and Katsanidou, 2015), which will be explained in the upcoming chapters.
This study focuses on the political behaviors, namely political trust and civic participation, of young. The sample group of the research consists of people aged between 15 to 25 who are living in Sweden. The analysis is done on three different groups of young people, two with and one without immigration background in Sweden; and it aims to answer how having immigration or not can influence young people’s political attitudes. Moreover, these three groups are not divided by race or religion; but solely by their immigration backgrounds. This research does not focus on immigration from certain countries into Sweden. It considers people from anywhere else in the World who live in Sweden as immigrants in Sweden. Because of these reasons, I consider this research important in the grand scale of global politics and societal change.
This thesis uses secondary data obtained from the European Social Survey and uses the Chi-Square and Kruskal-Wallis tests to determine if there are statistically significant differences between the attitudes of native-Swedes and first-generation and second-generation immigrant-origin individuals. The method also includes descriptive statistics to see in which ways these differences (or their lack of) show themselves.
1.1. Disposition
This thesis consists of six chapters. Chapter one is an introduction; it includes the research question, why it was chosen and its relevance to global politics. Chapter two offers information about previous literature and research on immigration, politics, youth and the EU. Chapter three provides the conceptual framework for this research; namely civic participation and political trust.
3 In chapter four, the research design and data discussed. It starts with the data used in this research; and continues on the identify the dependent and independent variables. Chapter five shows the analysis of the data and the results of this research. The last chapter, conclusion, discusses the results of this thesis and considers future research.
2. Literature Review
This chapters consists of four headings. The first one looks into immigration as a concept and explains where the terms native-Swede, second-generation immigrant origin-individual and second-generation immigrants used in this thesis were taken from. The second part focuses on the definition of youth and its usage in this thesis. The third part looks into other research concerning youth in the EU and their political attitudes. Final part explains how the ESS data was used in related research.
2.1. Immigration
McLean and McMillan (2009) define immigration as the “permanent movement of individuals or groups from one place to another”. (McLean and McMillan, 2009: entry 682). Similarly, Turner (2006) defines it as the changing of permanent residence for at least a year. Turner (2006), also points out that there are two distinct types of migration; internal and international. While internal migration refers to the movement of an individual inside a country, international migration is the movement from a country into another one. Turner (2006) states that international immigrants in the 20th century can be grouped into four categories; refugees and asylum seekers; migrants coming from former colonies; ethnically privileged migrants and economic migrants (Turner, 2006: 384-385). This thesis focuses on international immigration and does not take internal migration into account.
Kaya (2018) argues that the migration history of Sweden has been very active with Swedes migrating to the United States during the twentieth century; as well as Turks, Greeks, Yugoslavians and Finns migrating to Sweden to fill the demand for low-skilled labor towards the ends of the 20th century (Kaya, 2018: 13). He adds that, these movements caused family reunifications and the immigrant population in Sweden grew. Later, people started coming to Sweden first from Chile and Iran, then from the Balkan
4 countries; leaving their home countries because of unrest, ethnic conflicts of wars (Kaya, 2018: 13). Most recently, Syrians are coming to Sweden because of the war in their home country (Kaya, 2018: 13).
As of 2018, the population of Sweden is a little more than ten million. Almost 20 % of the people living in Sweden were born in another country. More than half of these people are Swedish citizens, which is more than one million people. Nearly 25 % of the population has foreign background, which means they were either born outside of Sweden or they were born in Sweden and one or both of their parents were born abroad (Statistiska Centralbyrån, 2019). As can be seen from these numbers, one in every four people living in Sweden has immigration background, which is a high number. Thus, it is important to examine if there are any differences between people’s civic engagement activities and political trust levels that can be directly connected to their immigration backgrounds. This research does not link migration with race, religion or country. Every movement coming into Sweden is considered migration and every person is considered an immigrant regardless of their home- country or religion.
Chart 1. Births, Deaths, Emigration and Immigration in Sweden between 2000 to 2017
(Taken From https://www.scb.se/hitta-statistik/artiklar/2017/sveriges-folkmangd-fran-1749-och-fram-till-idag/)
5 The above chart taken from Statistiska Centralbyrån gives a better understanding of migration into Sweden. It shows births (grey line), deaths (blue line), emigration (green line) and immigration to Sweden (orange line). It can be seen that during the period of 2000 to 2005, the four factors were in fixed lines. From 2005 to 2006, the number of people migrating into Sweden increased by almost 20.000. The numbers again stabilized until 2012. From 2012 to 2016, the number of people migrating to Sweden continued to increase. More than 160.000 people migrated to Sweden in 2016. The numbers seem to be decreasing after 2017.
While defining groups according to their immigration backgrounds, this thesis uses the definitions made by Maxwell (2010) in his article Evaluating Migrant Integration: Political Attitudes Across Generations in Europe; both because of the similarities of this thesis to the article, and because Maxwell (2010) also uses the European Social Survey data in his research.
Native- origin individuals, or native-Swedes, are people who were born in Sweden with both their parents born in Sweden as well. This groups also includes people who were born abroad with both parents born in Sweden, considering that the parents were outside of Sweden during the birth (Maxwell, 2010: 32).
First- generation immigrants are defined as people who were born outside of Sweden with one or both parents born abroad. According to Maxwell (2010), choosing first- generation immigrants this way helps the researcher omit people who were born outside of Sweden because of travel or short- term relocation of their parents (Maxwell, 2010:32). In this thesis; a person who was born in Finland to one parent born in Finland and the other born in Sweden, a person who was born in Mexico with both their parents also born in Mexico, or a person born in Greece with one parent born in the UK and the other born in Turkey are all considered first-generation immigrants living in Sweden.
Second- generation immigrant origin individuals are defined as people who were born in Sweden and have at least one parent born abroad. (Maxwell, 2010:32). In this thesis, a person born in Sweden with one parent born in Sweden and the other in Iran, a person born in Sweden with both their parents born in Norway or a person born in Sweden with one parent born in Canada and the other in Malaysia are all considered second-generation immigrant-origin individuals living in Sweden.
6
2.2. Youth
There are various definitions of youth in different EU Member States, where the age range that defines youth changes. The UN’s definition includes all people between the ages of 15 to 24, the EU strategy for young people applies to people between the ages of 13 to 30, and EUROSTAT defines young people to be between the ages of 15 to 29 years (FRA,2017).
For the purposes of these thesis, I am focusing on young people who are 15 to 25 years old. This decision is based on the European Commission’s specifications of youth population; where there separate young people into three groups. The age range for these groups are 15 to 19, 20 to 24 and 25 to 30 (European Commission, 2011:3). In my research, I included people who were 25 years of age as well, in order to widen the sample group. Still, I refrained from including people who were older than 25, because I wanted to primarily focus on young people who were still students or newly employed.
2.3. Youth in the EU and Their Political Attitudes
The most recent studies done in the EU concerning young people and their political behaviours were published in the 2018 special issue of the European Journal of Developmental Psychology on European Citizens. The articles on this issue are important for this research, because of their topics and because of their recent date. Their findings are important in understanding youth and their political involvement in the European Union. These articles do not focus specifically on immigration backgrounds of young people, but young people in general in regard to their relations to politics and the EU. All the articles from European Journal of Developmental Psychology (2018) focus on a different factor affecting political behaviours of the youth; such as socioeconomic factors,
apathy and media.
Two articles in this issue look directly into youth active citizenship. Šerek and Jugert (2017)’s research focuses on active citizenship amongst the EU youth. Banaji et al.’s (2018) article focuses on youth active citizenship and political participation in the EU.
7 The first research by Šerek and Jugert (2017) uses regression analysis and looks at a sample of 72,466 14-year old students from 22 EU countries. This research uses institutional trust and civic participation indicators while measuring active citizenship amongst the youth in the EU. The second research by Banaji et al. (2018) does textual analysis on literature from 8 EU countries in 8 different disciplines, looking at co-occurrences, word associations and thematic clusters in the texts. Although each research uses different methods in understanding the status for youth active citizenship, their results are quite similar. They both come to the conclusion that socioeconomic factors play a significant role in the civic participation and political trust of youth in the EU, stating that political trust and civic participation level of underprivileged youth are lower than their peers who have better socioeconomic status (Šerek and Jugert 2017, Banaji et al. 2018). These articles are useful to this thesis, since they indicate that political trust levels are linked to socioeconomic factors, one of them being having immigration background. Landberg et al. (2018) article from the European Journal of Developmental Psychology use cluster analysis to find out how young people living in the EU identify themselves; as national citizens, EU citizens or both. They find that identifying as national citizens or citizens of the EU is not directly linked with the political participation of young people (Landberg et al., 2018). Dahl et al.’s (2018) article from the same issue tries to understand why some young people are politically passive and conclude that it is due to apathy (Dahl et al., 2018). This research shows that young people are more inclined to apathy in political situations, than to trust and be involved in the politics of their country or the EU.
Finally, Macek et al.’s (2018) research in the European Journal of Developmental Psychology uses data collected from Czech, Estonian and Greek youth, aged between 16 to 25. It focuses on young people’s trust in media and how it is linked to their attitudes towards the EU. The findings show that trust in alternative media indicates a negative attitude towards the EU (Macek et al., 2018). This may be interpreted as trusting media connected to the government or the EU institutions means trusting the EU. Consequently, young people who follow more alternative media outlets are more distrusting towards the EU. The research contributes to this thesis by showing media as another factor in political trust and provides the age range for youth as being between 16 to 25, which is similar to the range chosen for this research.
8 Nancy’s (2016) report, European Youth in 2016, explains the findings of the Eurobarometer Survey carried out in 2016, in 28 member states of the EU. The participants of the survey are 10.294 young people between the ages of 16 to 30. This report is important because it states that 51% of the respondents count voting as the most important civic action. Moreover, 84% of the participants from Sweden believe that voting is the best way to participate in civic life. The report also states that the Swedish youth is the only group across European Countries to have a higher percentage of voting than the older voters of their country. In the 2014 European elections, 65.5% of the young people in Sweden voted, while the rate for citizens who were 55 or older was 48.5% (Nancy, 2016).
Another important literature is Lekby’s (2010) article. He analyses social integration of immigrants and natives in Sweden by using nine social measures; education, international and intranational marriages, young marriage, cohabitation, divorce, age difference of partners, female employment and female education (Lekby, 2010:2). Lekby compares the social integration of natives, first-generation immigrants and second-generation immigrant-origin individuals. The results suggest that the social integration of natives and second-generation immigrant-origin individuals are very similar, while there is still a considerable gap between them and first-generation immigrants (Lekby, 2010:5).
Other research such as Quintelier’s (2009) Heath, Rothon, and Kilpi’s (2008) and Franz’s (2006) done in the EU in the last 20 years will be used as well, because of their relevance to this thesis.
The Education, Audiovisual and Culture Executive Agency’s reports Youth Participation in Democratic Life (2010), Political Participation and EU Citizenship: Perceptions and Behaviours of Young People (2013) and Eurofound’s report Social Inclusion of Young People (2015) are also important sources. These reports consist of surveys taken by young people and their analysis, which helped show the way for the analysis part of this thesis.
9 All research in this section were done by using quantitative methods. Their common findings suggest that inclusion of young people is the foremost important factor in their political attitudes towards the EU and the country they are living in (Landberg et al, 2018; Quintelier, 2009; Šerek and Jugert, 2017; Dahl et al, 2018; Heath, Rothon and Kilpi, 2008) Another important common finding is that young people with immigration background and low to middle socioeconomic status are less likely to be political active (Banaji et al, 2018; Dahl et al, 2018; Šerek and Jugert, 2017; Franz, 2006; Heath, Rothon and Kilpi, 2008).
2.4. Research with the ESS data
In this section of the literature review, research done by using the ESS data that is related to immigration and/ or political behaviours are explained. These articles were helpful in the writing of this thesis, because they showed different ways of using the same data. The European Social Survey is an integral part of this thesis and all analysis is done by using the SPSS data from the ESS.
The ESS is a biennial survey that measures attitudes and behaviours of people living in European Countries. The survey covers topics such as politics, health, religion, education, and moral issues. Its data is used by academics, policy makers and think tanks (Prestage and Humphrey, 2014: 2).
Maxwell’s (2010) article is quite significant to this thesis. It compares the political attitudes of first- generation immigrants, native-origin individuals and second-generation immigrant-origin individuals. The terms second-generation immigrant-immigrant-origin, first-generation immigrant and native-origin used in this thesis are taken from Maxwell’s article.
First-generation immigrants are defined as people who were born outside of Sweden with one or both parents born abroad. Second- generation immigrant-origin individuals are defined as people who were born in Sweden and have at least one parent born abroad. And native-origin individuals are people who were born in Sweden with both their parents born in Sweden as well (Maxwell, 2010: 32).
10 In his research, Maxwell (2010) uses three rounds of the ESS and uses data for 24 counties. He puts the respondents into 3 groups: native-origin individuals, second-generation immigrant-origin individuals and first-generation migrants; with each group having 104.570, 9.436 and 8.132 respondents, respectively (Maxwell, 2010: 32). The findings suggest that while first-generation immigrants are less involved in politics and have lower expectations; second-generation immigrant-origin people and native-origin individuals have the same attitudes towards politics because of their similar upbringing (Maxwell, 2010: 25).
Quaranta’s (2018) article analyzes people’s understanding of “democracy” and if it differs from country to country. The research states that, if it is different, then using the ESS to compare responses from different countries would be meaningless, since it uses the same questions for each country. Quaranta applies Bayesian factor analysis to the sixth round of the ESS and validates the measures used in the ESS; concluding that citizens’ understanding of democracy is the same across individuals and countries (Quaranta, 2018: 191). This is important, because it shows that the ESS is valid in measuring peoples’ attitudes towards democracy.
3. Conceptual Framework
This thesis focuses on the political behaviors of young people and how these behaviors are affected by immigration background. It centers on civic participation and political trust; as these two concepts were often used in measuring political attitudes ( Banaji et al., 2018; Dahl et al., 2018; Franz, 2006; Heath, Rothon and Kilpi, 2008; Landberg et al, 2018; Maxwell, 2010; Quintelier, 2009; Rothon and Kilpi, 2008; Šerek and Jugert, 2017).
In order to give a better understanding of these concepts, this chapter explains how civic engagement and political trust is defined by various academics and how these concepts were used in this research. Moreover, it demonstrates the relationship between civic engagement and political trust, and the questions used in the analysis part of this research while looking at the relationship between immigration and these two concepts.
11
3.1. Civic Engagement
There is not one agreed upon description of Civic Engagement as a theory, it is considered more like a phenomenon or a concept (Patti et al., 2003, Henriksen et al. 2018).
According to Henriksen et al. (2018), knowledge and theory of civic engagement should now be advanced by emphasizing the political, social and economic sides of voluntary organizations and individuals’ participations in the civic life (Henriksen et al., 2018:3). They argue that there is a high level of difference in terms of volunteering levels between citizens from Scandinavian countries and citizens from rest of Europe (Henriksen et al., 2018:2).
Hendriksen et al. (2018) link that difference to the theories suggesting that there is a positive correlation between the resources an individual possesses and that persons volunteering or showing other types of civic engagements in their societies (Henriksen et al., 2018:3).
Pattie et al. (2003) try to understand and define civic engagement by using three alternative theories of civic behavior; rational choice, social capital and civic volunteerism (Pattie et al., 2003: 444).According to the rational choice model; civic engagement happens when the benefits of successful action is higher than the cost of involvement. Pattie et al. (2003) argue that, when the civic act of voting is considered; this model finds itself in a paradox.. The model implies that rational actors take action when there is a clear benefit in the end of the action. Elections, however, are not won by a few votes. What is the reason behind voting? It is suggested that there can be different reason behind it; such as private groups providing hidden benefits to the individuals or for social benefits (Patti et al., 2003: 444).
Patti et al. (2003) argue that according to social capital model, participating in local organizations help create a sense of trust in others. It suggests that people from communities who engage in voluntary activities are more trusting, prosperous and successful (Patti et al., 2003: 445).
Lastly, civic volunteerism model is defined as being based on a socio-economic model of participation. Which means that resources are the most important part of participation. Wherever people have more money and education; there people are more likely to engage civically (Patti et al., 2003: 445). This is also the model Henriksen et al. (2018) refer to when trying to explain why volunteering levels in Europe is highest in the Scandinavian Counties.
12 Patti et al. (2003) evaluate these three models by interviewing 3.400 individuals face to face. In their study to define civic engagement, they conclude that it is a very complex phenomenon (Patti et al., 2003: 465). Their main argument is that civic activism has three distinct types. These are individualistic based activities, contacts with those in authority and collective action. Finally, they emphasize that a person who engages in one form of civic activity does not necessarily take part in the others (Patti et al., 2003: 465).
In the analysis part of this thesis, all three of these civic activities are considered.
The question about voting covers the first activity, which was individualistic civic activity. The question about contacting a government official or a politician covers the second activity. The questions about partaking in lawful demonstrations and working in an action group or in a political party refers to the third activity, which is collective action. Lastly, the question about displaying campaign stickers or badges can indicate both individualistic activities and collective action.
3.2. Political Trust
Newton (2015) argues that trust has been very significantly important in both political and social theory for centuries. Moreover, it has been a topic that was widely researched by government agencies and policy makers in the last two decades, in order to identify and rectify the practical problems in public policy (Newton, 2015:19).
Eder and Katsanidou (2015) state that there is no general theory of trust, but a certain level of trust is essential for democracy and society to function properly. They use Delhey and Newton’s (2005) definition of trust, which is “the belief that others will not deliberately or knowingly do us harm, if they can avoid it, and will look after our interest, if this is possible.” (Eder and Katsanidou, 2015:86). To have this trust between citizens and government would result in a functioning society and a working democracy.
With all the research done in the last 20 years, a strong relationship was discovered between social and political trust and different phenomena in modern society (Newton, 2015:19). According to Newton (2015), communities consisting of trusting people have higher rates of civic engagement, such as volunteering or contributing to charities. Besides, political trust is associated with democratic development, belief in democracy and satisfaction with the country’s democracy (Newton, 2015:20). This information shows a clear line connecting civic participation and political trust; thus, it is expected to
13 find the same levels of civic engagement and political trust for the same groups during the analysis part of this thesis.
Quandt et at. (2015) argue that recent public opinion surveys indicate political trust has been low and is getting lower still. Since there is a positive correlation between political trust and good governance, they argue that good governance is necessary to keep political trust levels of the people high (Quandt et al., 2015: 1). In the analysis of this thesis, information on political trust levels of youth in Sweden will be presented. These levels can be used as a way to understand if the young people believe that Sweden has good governance or not.
According to Parker et al. (2015), there have been a number of scholars examining political trust, but the debate as to what they are measuring is still going on (Parker et al., 2015: 60). They argue that political trust has three layers; trust in national government, trust in government officials and trust in the federal government - or in the European Parliament in the case of countries in the European Union (Parker et al., 2015: 79). As such, this research measures young people’s political trust levels by using Parker et al. (2015)’s definition, and focuses on these three layers of political trust. The questions used in the analysis to understand the respondents’ level of political trust directly corresponds with these three parts of political trust.
This thesis measures political trust by using three questions from the ESS to cover all three layers explained by Parker et al. (2015). The first question “How much do you trust in your country's parliament, on a scale from 0 to 10?” focuses on trust in national government, it being the Swedish government in this case. The second question, “How much do you trust in politicians, on a scale from 0 to 10?” corresponds with the second layer of political trust, which is trust in government officials. The last question, “How much do you trust in the European, on a scale from 0 to 10?” is related to the final layer of political trust; which is trust in the federal government, or for the case of Sweden, trust in the European Parliament. Moreover, Eder and Katsanidou (2015), argue that there is a clear correlation between political trust and civic participation, which is significant for this thesis. They argue that, when there is trust in the politics of the country, people are more inclined to be active in civic participation (Eder and Katsanidou, 2015:87). Thus, in the analysis part, it is expected to find a positive correlation between political trust and civic participation.
14
4. Research Design and Method
This chapter outlines the design of this thesis; explains the method, why it was chosen and how the analysis had been done.
This thesis aims to find how immigration background affects young people’ civic participation and political trust. In looking at the relationship between immigration and civic participation as well as political trust, this research focuses on young people instead of people of all ages. In order to have as many people as possible to perform statistical analysis with while staying within the generally accepted definition of youth, this thesis considers young people to be between 15 to 25 years.
Considering the topic of the thesis, quantitative research was chosen over qualitative research in order to reach results that can be inclusive of all young people living in Sweden.
This thesis uses secondary data from the European Social Survey. The data is analyzed using Statistical Package for the Social Sciences (SPSS). SPSS is used to show the demographic information of the group who answered the European Social Survey, as well as to show the relationship between immigration background and civic participation and political trust. The analysis is performed using IBM SPSS Statistics version 25. In the analysis of the data; Chi-Square and Kruskal-Willis tests, descriptive statistics, frequency, comparison of means and crosstabs are used. Chi-square and Kruskal-Willis tests are statistical tests that show the relationship between variables and prove if these relationships are statistically significant or not.
The analysis is done by choosing dependent and independent variables and performing Chi-Square and Kruskal-Willis tests as well as descriptive analysis on the SPSS data. The independent variable of the research is immigration background. The dependent variable for the first part of the analysis is “civic participation”. Civic participation is measured using voting, working in a political party or an action group, contacting politicians, displaying campaign stickers and partaking in lawful demonstrations. The dependent variable of the second part of the analysis “political trust”. Political trust is measured using trust in the Swedish Parliament, trust in the legal system and trust in the European Parliament.
15
4.1. Data
The data used in this thesis is secondary data taken from the ESS. There are several reasons that the ESS data was used in this thesis. Firstly, the questions in the survey are extremely relevant to the research question. The survey includes questions related to political trust and civic participation, as explained in detail in chapter 4.2.2. .Secondly, it provides a wide sample of respondents, the sample group being 435 in total, with 340 native-Swede origin respondents, 76 second-generation immigrant origin respondents and 34 first-generation immigrant respondents. And lastly, access to the SPSS data of the surveys are easy and free of charge.
For this thesis, the ESS data from Sweden for the years 2014 and 2016 were used. These years were chosen because as Chart 1 showed in the chapter 1.2.1., most recent increase in immigration to Sweden started around 2013. By choosing the surveys from 2014 and 2016, reaching as many young people as possible who are first-generation immigrants was rendered possible.
4.1.1. The European Social Survey
According to Prestage and Humphrey (2014), the European Social Survey is a biennial survey that measures attitudes and behaviors of people living in European Countries. The survey covers topics such as politics, health, religion, education and moral issues. Its data is used by academics, policy makers and think tanks. Its biennial design and the fact that it had been conducted in more than 30 countries give its users special opportunities; such as monitoring changes throughout the years and do comparisons - between years, countries or both (Prestage and Humphrey, 2014: 2).
The first round of the ESS was conducted in 2002, and as of 2020, there have been 9 rounds of the survey. There are 38 countries that took part in the survey, but not all of them were included in each round. Sweden is one of the countries that participated in the survey for all of its nine rounds, but the data for the 2018 survey was not yet released as of May 2020 (Europeansocialsurvey.org, 2019).
Prestage and Humphrey (2014) explain that the participants of the survey are selected by using random probability sampling, which ensures that anyone has the same chance of being selected and interviewed. In order to prevent selecting the same persons in the
16 upcoming surveys, the ESS uses cross-sectional sampling. Only restriction regarding participation in the survey is age. Anyone who is 15 years of age or older and is residing in a participating country is eligible for the survey; regardless of their citizenship, nationality and language barriers (Prestage and Humphrey, 2014:7).
The Questionnaire of the ESS consists of two sections; first section is referred as the core section, and the second section is referred to as the rotating section. While the core section stays mostly the same in each round; the rotating section is focusing on different themes on each round. The rotating section has two parts with different themes. Some rotating sections are used again in later rounds; but always with at least two rounds in between them (Europeansocialsurvey.org, 2019).
The core section has six parts, which are media and social trust, politics, subjective well-being, gender and household, socio demographics and human values. The rotating section has themes such as immigration, citizen involvement, economic morality, family work and well-being, timing of life, personal and social well-being, justice, democracy, social inequalities in health, public attitudes to climate change and justice and fairness in Europe. On round 7 in 2014, the rotating themes were immigration and social inequalities in health; and on round 8 in 2016, they were welfare attitudes and public attitudes to climate change. Since no two rotating themes were used consecutively in all 9 rounds of the survey, the questions in those themes are not used in the analyses part of this thesis. Only questions that appear both in the 7th and the 8th round of the ESS were used in the analysis.
The data collected in the ESS is free for anyone who wishes to use it. Researchers can use the data however they choose to; using the countries, years and variables according to their own needs or recoding the datasets to fit their research (Prestage and Humphrey, 2014: 14).
17
4.2. Adjustments in the ESS Data
In this thesis, two sets of data from the ESS were used; one from the round 7 in 2014 in Sweden and the other from round 8 in 2016 Sweden. The data comes in the form of an SPSS file, which consists of cases (people who answered the survey/ respondents), variables (questions), and values (answers to the questions ).
In order to clearly see the cases I wanted to analyze, firstly, I combined the two SPSS files. Then, because this thesis focuses on young people, I sorted the respondents by their age, and deleted anyone older than 25 years of age. In doing so, 435 respondents remained in the file, between the ages of 15 to 25.
Some variables (such as questions concerning household, religion, race and marital status) were deleted because they were not relevant to the research question; and some were combined (as explained below, to create the new variables: immigration background and immigrant origin) to be able to better see and understand the results.
This thesis focuses on how immigration background affects civic engagement and political trust of Swedish youth. In order to see this, related questions were identified, such as questions about immigration background of the respondents, civic engagement levels of the respondents and political trust levels of the respondents.
Below are the independent and dependent variables of this research, with the explanations of how they were created or selected.
4.2.1. Independent variables: The independent variable of this research is immigration background, as per the research question “How does civic engagement and political trust of young people in Sweden differ depending on their immigration backgrounds?” The ESS has several questions which can be used to determine immigration background of the respondents. These questions are as follows; “Were you born in Sweden?”, “Was your father born in Sweden?” and “Was your mother born in Sweden?”. Using the answers to these questions, I created two new variables,
18 and named them immigration background and immigrant origin.
a. Immigration background: For this variable, I determined two values; yes and no. (indicated in the SPSS as 1.00 and 2.00) The value no means that the respondent does not have immigration background, which implies that the person was born in Sweden, to parents who were also born in Sweden. The value yes means that the respondent has immigration background, as in they have either one or both parents born outside of Sweden. I did not put people who were born outside of Sweden to Swedish parents as having immigrant background; considering they were born abroad because their parents were working or travelling abroad at the time of their birth.
b. Immigrant origin: For this variable, I determined three values; native-Swede (1.00), and second-generation immigrant-origin individual (2.00) and first- generation immigrant (3.00). The definitions used in this thesis for these values are explained in the chapter Immigrant/ immigrant-origin individual.
The respondents defined as native-Swedes (1.00) were born in Sweden to both parents who were also born in Sweden. The respondents who were born outside of Sweden to both parents born in Sweden were also considered native-Swede for the purposes of this thesis, as explained above.
The respondents that were defined as second-generation immigrant-origin individuals (2.00) were born in Sweden to one or both parents born outside of Sweden.
Lastly, respondents in the group first-generation immigrants were people who were born outside of Sweden; and have one or both of their parents also born outside of Sweden.
After selecting the independent variable and creating these new variables (immigrant origin and immigration background) on SPSS, I decided on the dependent variables using the definitions of civic participation and political trust, explained in the conceptual framework chapter.
19
4.2.2. Dependent variables: The dependent variables of this thesis are civic engagement and political participation, as indicated in the research question, “How does civic engagement and political trust of young people in Sweden differ depending on their immigration backgrounds?”.
a. Civic engagement: As explained in the chapter Civic Engagement, Patti et al. (2003) suggest that civic engagement has three distinct types. These are individualistic based activities, contacting people in positions of authority and collective action.
There are 12 questions related to civic engagement in the ESS. I decided to use 5 of them in order to see how the immigration background of young people affect their civic participation. I did not use all of the questions in order to keep the analysis and results of the thesis as clear and as concise as possible. The following is a list of all the questions in the ESS that concern civic engagement and the reasons for them to be used or not used in this thesis:
• Did you vote in the last national election?: This question was used, because it is directly related to civic engagement as explained by Patti et at. (2003); and falls under the type of civic engagement, individualistic based activities.
• During the last 12 months, have you done any of the following? Have you contacted a politician, government or local government official?: This question was used, because it measures the type of civic engagement defined by Patti et at. (2003) as contacting people in positions of authority.
• During the last 12 months, have you done any of the following? Have you worn or displayed a campaign badge/sticker?: This question was used, because it can indicate two of Patti et at. (2003)’s three types of civic action; individualistic based action and
collective action.
• During the last 12 months, have you done any of the following? Have you taken part in a lawful public demonstration?: This question was used, because it measures the type of civic engagement defined by Patti et at. (2003) as collective action.
20 • During the last 12 months, have you done any of the following? Have you worked in a
political party or action group?: This question was used, because it measures the type of civic engagement defined by Patti et at. (2003) as collective action.
• How able do you think you are to take an active role in a group involved with political issues?: This question was not used, because it offers the subjective opinion of a respondent, rather than showing actual engagement. A person can feel “very able” to take an active role, without ever taking or trying to take one. to Since the ESS is a large-scale survey, I have no way of reaching all the people who participated in it and ask them further questions, I chose to not use this question.
• How much would you say the political system in Sweden allows people like you to have a say in what the government does?: This question was not used because of the same reasons the question “How able do you think you are to take an active role in a group involved with political issues?” was not used.
• How confident are you in your own ability to participate in politics?: This question was not used because of the same reasons the question “How able do you think you are to take an active role in a group involved with political issues?” was not used.
• During the last 12 months, have you done any of the following? Have you worked in another organization or association?: This question was not used. A similar question “Have you worked in a political party or action group?” was chosen because of its wider approach.
• During the last 12 months, have you done any of the following? Have you signed a petition?: This question responds with individualistic based action definition of Patti et at. (2003), but it was not used. The other questions chosen individualistic based action for match with the description better than this question.
• During the last 12 months, have you done any of the following? Have you boycotted certain products?: This question was not used, but it could have been chosen to explain
individualistic based action. However, it was not chosen, because boycotting a certain
product can be about politics and civil rights; but it can also be about prices or personal dislike.
• During the last 12 months, have you done any of the following? Have you posted or shared anything about politics online, for example on blogs, via email or on social media such as Facebook or Twitter?: This question is also directly linked with individualistic
21
“Have you voted in the last national election?” was chosen to explain individualistic
action part of civic participation.
b. Political Trust: As explained in the chapter political trust, political trust has three layers; trust in the national government, trust in government officials and trust in the Federal Government (in this case, trust in the European Parliament (Parker et al., 2015: 79). In the ESS, there are seven questions related to political trust. Three of them corresponds directly with the three layers of political trust, and thus they were used in this analysis.
• How much do you trust in Sweden’s Parliament?: Connected to the first layer of political trust; trust in the national government.
• How much do you trust politicians?: Connected to the second layer of political trust, trust in the government officials.
• How much do you trust in the European Parliament?: Connected to the third layer of political trust, trust in the European Parliament.
The other five questions connected to political trust in ESS which were not used in this research are; “How much do you trust in the legal system?”, “How much do you trust the police?”, “How much do you trust political parties?” and “How much do you trust in the United Nations?”. Even though these questions are also linked to political trust, the three chosen for this research correspond directly to its three layers.
22
5. Empirical Results
This chapter consists of two parts.
In the first part, demographic information of the sample group is explained. This information includes the ages and gender of the participants; as well as information related to their immigration background.
The second part contains the statistical analysis and results of the data. It consists of two sections. First section focuses on the relationship between civic participation and immigration background; using the five questions mentioned above with Chi-square testing and descriptive statistical analysis. The second section shows the relationship between political trust and immigration background, using the three layers of political trust by performing the Kruskal-Willis test and descriptive statistical analysis.
5.1. Demographic Information
The following numbers and charts show the demographic information of the respondent group. It includes the number of respondents, their ages, their genders and their immigration background.
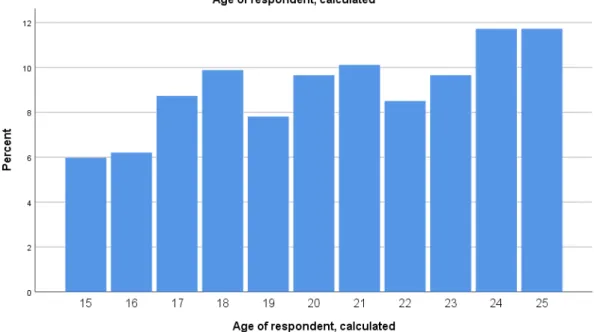
The sample group consists of 438 young people between the ages of 15 to 25. The mean of their age is 20.53; and the distribution of ages are regular, as can be seen from the below chart. Not all parts of the analysis contain all 438 respondents, since sometimes 2 or 3 answers were missing for some questions. However, this does not affect the analysis in any way, as both Chi-square and Kruskal-Willis tests indicate that the groups have normal distribution, thus they can be correctly analyzed using these tests.
A sample size of 438 might seem like a small sample for a quantitative research; but their distribution across groups, ages and genders were normal and the size was suitable for statistical testing. More to the fact is that, the participants were taken directly from the ESS, which collects its randomly and in accordance with the country’s size.
23
Figure 1: Age of respondents
230 (52.5%) out of 438 respondents are male, while 208 (47.5 %) of them are female. In regard to their ages and their gender, the groups show normal distribution; which means that they are divided equally amongst themselves.
As Figure 1 shows, the most common age for respondents are 24 and 25; while younger respondents who are aged 15 and 16 are the less common in the sample group.
320 (74.7 %) of the respondents are identified as native Swedes; which means that they were born in Sweden, to parents who were also born in Sweden, or they were born outside of Sweden but are Swedish citizens with both their parents born in Sweden as well. 34 (7.8 %) people are first generation immigrants; they were not born in Sweden nor do they have Swedish parents, but they are residing in Sweden. 76 (17.5 %) of them are second- generation immigrant origin individuals; which means that they were born in Sweden, but at least one of their parents was born outside of Sweden.
24
Figure 2. Immigration background of respondents
As figure 2 demonstrates, the majority of the respondents are native Swedes; followed by second-generation immigrant-origin respondents and second-generation immigrants. The difference between group populations might seem too big and would make comparing the groups difficult; but this is not the case. Before Chi-Square and Kruskal-Willis tests, the group populations were tested as well to make sure the analysis would give correct results. Moreover, as mentioned in the section Immigration, one in every four people living in Sweden have immigration background. This corresponds with the sample group of this survey where 74.7% of the respondents are native-Swedes; which means one in four people in the sample group has immigration history.
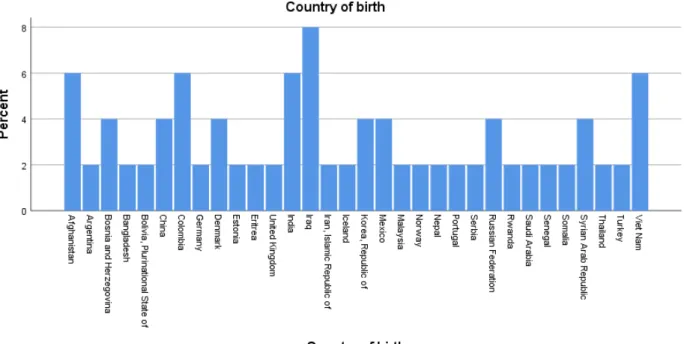
In order to give a clear picture of the immigration background of the respondents who are first- generation immigrants and second-generation immigrant-origin individuals; the following charts illustrates the distribution of countries where the respondents or their parents were born.
25
Figure 3. Country of birth of the respondents, first-generation immigrants
Figure 4. Mother’s country of birth, second-generation immigrant origin individuals
As can be seen from the above figure 3, most of the first-generation immigrants who took part in the Survey are from Iraq, Afghanistan, Colombia, India or Vietnam.
26
Figure 5. Father’s country of birth, second-generation immigrant origin individuals
Figure 4 and figure 5 shows the parents’ countries of birth for respondents who were considered second-generation immigrant-origin individuals. For these respondents; Syria, Finland and Iraq are the most common countries where either their mother or their father was born.
5.2. Statistical Analysis and Results
This chapter contains the analysis of the data and shows the results. The analysis was done by performing Chi-Square and Kruskal-Willis tests on the data, as well as descriptive statistics and crosstabs.
The first part of this chapter focuses on the relationship between immigration background and civic engagement, and the second chapter is about the relationships between immigration background and political trust. The results are shown in bar charts, and the statistics are interpreted.
5.2.1. Immigration Background and Civic Engagement
In order to understand how immigration background affects civic engagement, five questions regarding civic participation are assessed.
Firstly, Chi-Square tests are done in order to see if there is a statistically significant difference in the civic engagement of young people depending on their immigration
27 background. In a chi-square test, if the resulting value is smaller than 0,05, it means that there is a statistically significant relationship between the two variables.
Here, immigrant origin (divided in three groups, native-Swede, second-generation immigrant-origin individual, first-generation immigrant) was not used in the analysis. Instead, immigration background (people who have immigration background and people who do not have immigration background) was used.
Since the number of people who are first-generation immigrants are very low in comparison to the other two groups, this was necessary to get accurate results in the chi-square test. However, after each chi-chi-square test showing if the difference is statistically significant or not, a deeper investigation as to why was performed using descriptive statistics and the three groups of immigrant origin.
The answers to these questions are reviewed to see if civic participation is affected by immigration background:
1. Did they vote in the last election?
2. Did they work in a political party or in an action group in the last 12 months? 3. Did they contact a politician or a government official in the last 12 months? 4. Did they wear or display campaign badges/ stickers in the last 12 months? 5. Did they take part in a lawful demonstration in the last 12 months?
28
Question 1. Voted in the last national election
For this question, it is important to mention that in this particular sample group every respondent was a citizen of Sweden and therefore eligible to vote. Only people who were younger than 18 when the last national election was held were not eligible to vote, and they are recorded as such in the analysis.
As can be seen from Table 1, the chi-square test showing the relationship between voting and immigration background gives the value of 0,039. This value is smaller than 0,05; which means that there is a statistically significant relationship between voting and immigration background. Chi-Square Test Value df Asymp. Sig. (2-sided) Pearson Chi-Square 6,470a 2 ,039 Likelihood Ratio 6,461 2 ,040 Linear-by-Linear Association 6,101 1 ,014 N of Valid Cases 435
a. 0 cells (0,0%) have expected count less than 5. The minimum expected count is 18,12.
Table 1. Chi-Square test, voting vs. immigration background
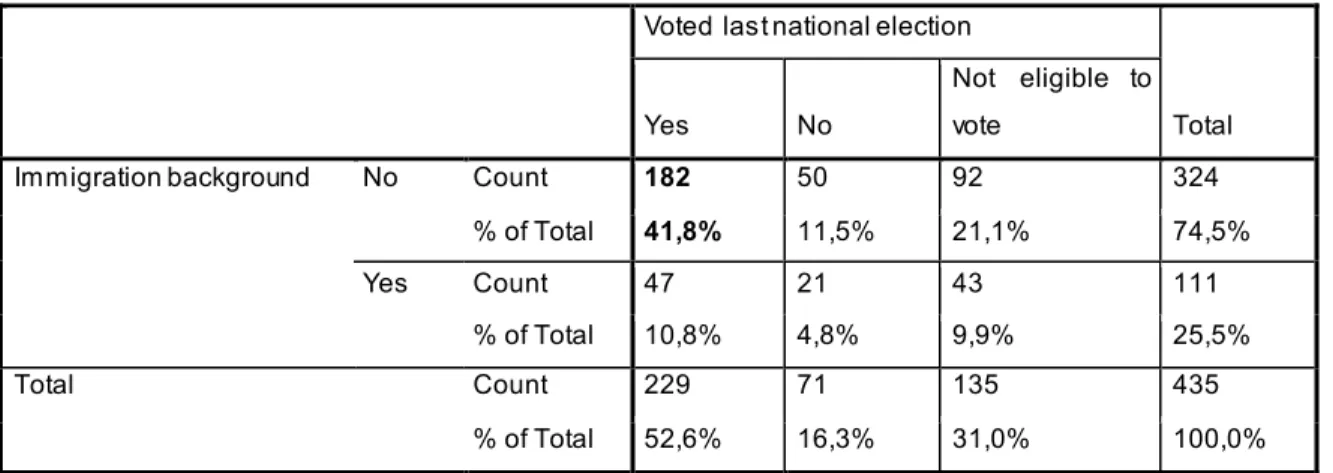
Immigration background * Voted last national election Crosstabulation
Voted last national election
Total
Yes No
Not eligible to vote
Immigration background No Count 182 50 92 324
% of Total 41,8% 11,5% 21,1% 74,5%
Yes Count 47 21 43 111
% of Total 10,8% 4,8% 9,9% 25,5%
Total Count 229 71 135 435
% of Total 52,6% 16,3% 31,0% 100,0%
29 Table 2 illustrates that young people who do not have immigration background are more likely to have voted in the last national election. A more detailed graphic showing all three groups of immigration can be seen below.
Chart 2. Voted in the last national election
Out of the 324 native Swede respondents, 183 (56.3 %) of them voted in the last national election; while 50 (15.5 %) of them did not vote and 92 (28.3) of them were not eligible to vote. As for the 76 second- generation immigrant origin respondents, 37 (48.7 %) of them voted in the last national election, while 9 (11.8 %) of them did not vote and 30 (39.5 %) of them were not eligible to vote. Lastly, for the first- generation immigrants, 9 (26.5 %) of the 34 respondents voted, while 12 (35.3 %) of them did not vote and 13 (38.2 %) of them were not eligible to vote.
As can be seen from the chart 2, native Swedes and second- generation immigrant origin respondents show a very similar distribution in their voting habits for the last national election; one big difference being that while only 28.3 % of the first group were not eligible to vote while that number is 39.5 % for the second group.
30 First- generation immigrants, on the other hand, show a rather different pattern. For the first two groups, at least three in every four respondent who was eligible to vote, voted. However, within the first- generation immigrants, the number of respondents who were able to vote but did not (35.3 %) is higher than those who did (26.5 %).
Question 2. Worked in a political party or in an action group in the last 12 months The chi-square test results show the value of 0,133 between the relationship between working in a political party or in an action group and immigration background (Table 3). This value is higher than 0,05; which means that there is not a statistically significant relationship between these two variables.
Chi-Square Tests Value df Asymp. Sig. (2-sided) Exact Sig. (2-sided) Exact Sig. (1-sided) Pearson Chi-Square 1,896a 1 ,169 Continuity Correctionb 1,254 1 ,263 Likelihood Ratio 1,743 1 ,187
Fisher's Exact Test ,198 ,133
Linear-by-Linear Association 1,892 1 ,169
N of Valid Cases 438
a. 0 cells (0,0%) have expected count less than 5. The minimum expected count is 5,32. b. Computed only for a 2x2 table
Table 3. Chi-Square test, action group vs. immigration background
Looking at the descriptive statistics for this question, it can be seen that the number of young people amongst the respondents who worked in a political party or in an action group in the last 12 months is very low. Out of the 435 people who answered the survey, only 21 (4.8%) of them answered this question positively.
31 13 (4 %) of the 325 native Swedes, 7 (9.2 %) of the 76 second- generation immigrant origin respondents and 1 (2.9 %) of the 34 first-generation immigrants have worked in a political party or in an action group during the last 12 months.
These statistics show that second- generation immigrant origin individuals have a higher percentage of taken part in political parties and action groups compared to native Swedes; while first- generation immigrants are the least inclined group to take part in these. Even though these statistics do not point to a significant relationship, it is still important to note that, within the respondent group, second-generation immigrant-origin individuals are more active in political parties or in action groups.
32
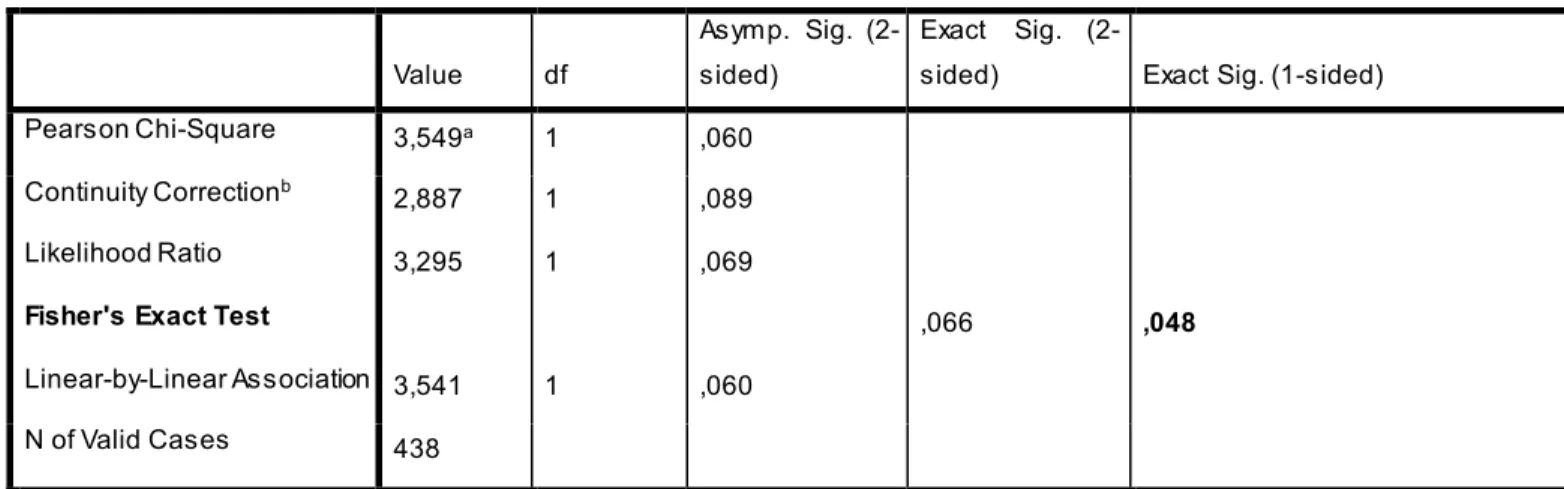
Question 3. Contacted a politician or a government official in the last 12 months The chi-square test showing the relationship between contacting a politician or a government official and immigration background gives the value of 0,048. Since this value is smaller than 0,05; it means that there is a statistically significant relationship between contacting people of political authority and immigration background.
Chi-Square Tests
Value df
Asymp. Sig. (2-sided)
Exact Sig.
(2-sided) Exact Sig. (1-sided)
Pearson Chi-Square 3,549a 1 ,060
Continuity Correctionb 2,887 1 ,089
Likelihood Ratio 3,295 1 ,069
Fisher's Exact Test ,066 ,048
Linear-by-Linear Association 3,541 1 ,060
N of Valid Cases 438
a. 0 cells (0,0%) have expected count less than 5. The minimum expected count is 10,90. b. Computed only for a 2x2 table
Table 4. Chi-Square test, contacting authority vs. immigration background
As Chart 5 indicates that young people who do not have immigration background are less inclined than people that have immigration background to have contacted a politician or a government official.
33
Immigration background * Contacted politician or government official last 12 months Crosstabulation
Contacted a politician or a government official in the last 12 months
Total
Yes No
Immigration background No Count 27 300 327
% of Total 6,2% 68,5% 74,7%
Yes Count 16 95 111
% of Total 3,7% 21,7% 25,3%
Total Count 43 395 438
% of Total 9,8% 90,2% 100,0%
Table 5. Crosstabulation, contacting authority vs. immigration background
The percentage of young people amongst the respondents who have contacted a politician or a government official in the last 12 months is low. Out of the 438 people who answered this question, only 9.9 % (43) of them answered this question positively.
27 (8.3 %) of the 328 native Swedes, 11 (14.5 %) of the 76 second- generation immigrant origin respondents and 5 (14.7 %) of the 34 first-generation immigrants have contacted a politician or a government official in the last 12 months.
These statistics show that both second- generation immigrant origin young people and first- generation immigrant young people are more likely to get in touch with politicians and governments officials than their native Swedish peers.
34
Chart 4. Contacted a politician or a government official in the last 12 months
Question 4. Worn or displayed campaign badges or stickers in the last 12 months The chi-square test results show the value of 0,226 between the relationship of wearing campaign badges and immigration background(Table 6). This value is higher than 0,05; which means that there is not a statistically significant relationship between these two variables. Chi-Square Tests Value df Asymp. Sig. (2-sided) Exact Sig. (2-sided) Exact Sig. (1-sided) ,799a 1 ,371 ,576 1 ,448 ,819 1 ,365 ,420 ,226 ,797 1 ,372 438
a. 0 cells (0,0%) have expected count less than 5. The minimum expected count is 23,32. b. Computed only for a 2x2 table
35 The below chart shows that displaying campaign badges or stickers is a more common practice amongst the Swedish youth than working in a political party or contacting a government official. Out of the 438 people who answered this question, 91 (20.9 %) of them have displayed campaign badges or stickers in the last 12 months.
71 (21.8 %) of the 328 native Swedes, 11 (14.5 %) of the 76 second- generation immigrant origin respondents and 9 (26.5 %) of the 34 first-generation immigrants have worn or displayed campaign badges or stickers during the last 12 months.
Chart 5. Worn or displayed campaign badges or stickers in the last 12 months
Looking at these statistics, it can be argued that the first-generation immigrants are the most likely group to display campaign badges and stickers, follow firstly by native Swedes and then by second- generation immigrant origin young people. However, this is not a statistically significant difference, as the chi-square test proved that there is not a significant difference between the groups.