The Open Immunology Journal, 2018, 08, 1-15 1
1874-2262/18 2018 Bentham Open
The Open Immunology Journal
Content list available at: www.benthamopen.com/TOIJ/DOI: 10.2174/1874226201808010001
RESEARCH ARTICLE
Tracing Aluminium-based Adjuvants: Their Interactions with
Immune Competent Cells and their Effect on Mitochondrial Activity
Ravi Danielsson
1, Andreas Svensson
2, Peter Falkman
1and Håkan Eriksson
1,*1Department of Biomedical Science, Faculty of Health and Society, Malmö University, SE-205 06 Malmö, Sweden
2Lund Stem Cell Center, BMC B10, Lund University, Lund, Sweden
Received: November 03, 2017 Revised: February 24, 2018 Accepted: March 08, 2018 Abstract:
Background:
Studies revealing the immune stimulatory properties of aluminium-based adjuvants (ABAs) have been impaired by the absence of simple and reliable methods of tracing the adjuvants and their effect on biochemical processes upon endocytosis.
Objective:
To verify that labelling of ABAs with lumogallion doesn’t affect the physicochemical properties of the adjuvant; tracing cellular interaction with aluminium adjuvants; explore their effect on metabolic activity upon endocytosis.
Methods:
Physicochemical characterization by Z-potential and size distribution of ABAs labelled with lumogallion. Cellular interactions with ABAs by flow cytometry and confocal microscopy. Metabolic activity explored by measuring transformation of tetrazolium into formazan.
Results:
No or minor change of zeta potential and average particle size of lumogallion labelled aluminium oxyhydroxide, AlO(OH) and aluminium hydroxyphosphate, Al(OH)x(PO4)y. Both phagocytosing and non-phagocytosing leukocytes became associated with
ABAs at concentrations expected after in vivo administration of a vaccine. The ABAs were relatively toxic, affecting both lymphocytes and monocytes, and Al(OH)x(PO4)y was more toxic than AlO(OH). Endocytosed aluminium adjuvant particles were
not secreted from the cells and remained intracellular throughout several cell divisions. The presence of ABAs increased the mitochondrial activity of the monocytic cell line THP-1 and peripheral monocytes, as based on the transformation of tetrazolium into formazan.
Conclusion:
Lumogallion labelled ABAs is a valuable tool tracing interactions between ABAs and cells. Labelled ABAs can be traced intracellularly and ABAs are likely to remain intracellular for a long period of time. Intracellular ABAs increase the mitochondrial activity and the presence of intracellular Al ions is suggested to cause an increased mitochondrial activity.
Keywords: Aluminium based adjuvant, Lumogallion, Mitochondrial activity, MTT assay, Phagocytosis, ABAS, Zeolites.
1. INTRODUCTION
Aluminium salts were introduced as adjuvants in vaccines by Alexander Glenny in 1926 [1] and aluminium salts are today frequently used in both human and veterinary vaccines. The most commonly used aluminium based adjuvants
* Address correspondence to this author at the Department of Biomedical Science, Faculty of Health and Society, Malmö University, Håkan Eriksson, SE-205 06 Malmö, Sweden; Tel: +46406657925; E-mail: hakan.eriksson@mah.se
(ABAs) are aluminium oxyhydroxide (AlOOH), in this paper referred to as Alhydrogel®
, and aluminium hydroxyphosphate, (Al(OH)x(PO4)y), here referred to as Adju-Phos
®
, and despite the excessive use of these two types of ABA over decades, knowledge and understanding regarding the mechanisms underlying the immune response induced are surprisingly limited [2].
Both aluminium oxyhydroxide and aluminium hydroxylphosphate consist of nanoparticles dispersed in aqueous solvents and form loose, micrometre sized aggregates at circumneutral pH. At neutral pH, ABAs have very low solubility, with aluminium hydroxyl-phosphate being slightly more soluble [3].
The fluorochromes morin and lumogallion form complexes with Al ions and have been used in the intracellular identification of ABAs [4 - 6]. Recently, labelling of ABA particles with lumogallion creating fluorescent ABA preparations traceable upon incubation with cells was described [7]. The understanding of the immunological mechanism by which ABAs enhance an immune response has been hampered by the lack of reliable and easy methods detecting and tracing ABAs in vitro and in vivo. But pre-labelling of ABA particles with lumogallion creates easily traceable ABA preparations with, as shown in this paper, physicochemical characteristics almost identical to non-modified ABAs.
Co-culture of ABAs with phagocytosing cells results in the internalization of ABA particles. We also show that ABAs remain intracellularly and are not secreted from the cells during continuous cell culture and cell division. Furthermore, intracellular accumulation of ABAs increases the mitochondrial activity of both a cell line of monocytic origin, and of human peripheral monocytes.
2. MATERIALS AND METHODS 2.1. Materials
The aluminium adjuvant preparations used herein were Alhydrogel®, AlO(OH), and Adju-Phos®, Al(OH)x(PO 4)y,
purchased from Brenntag Biosector (Fredikssund, Denmark). Zeolite Y (NaY) and dealuminated zeolite Y (USY) were manufactured by Tosoh cooperation, Japan and before use, the zeolites were sterilized by heating for 3 hours at 300 °C and fractionated as earlier described [8].
Lumogallion (CAS 4386-25-8) came from TCI Europe N.V., Antwerp, Belgium and thiazolyl blue tetrazolium bromide (MTT), M2128 was purchased from Sigma-Aldrich, St. Louis, MO, USA.
2.2. Cell Culture
THP-1, (ATCC TIB-202), was obtained from LGC Standards, UK and cultured in RPMI 1640 medium supplemented with 10% fetal calf serum of EU grade, (Gibco, ThermoFisher Scientific), and 100 μg/ml of gentamicin (Corning Media Tech, ThermoFisher Scientific). This medium will be referred to as R10. All cells were cultured at 37 °C in a humidified atmosphere with 5% CO2 and the cells were maintained by sub-culturing once every third day.
2.3. Lumogallion Labelling of Aluminium Adjuvants Alhydrogel®, AlO(OH), and Adju-Phos®, Al(OH)x(PO
4)y, corresponding to 4 mg aluminium/ml were incubated
over night at room temperature on a rocking table with lumogallion, 0 – 100 μM, in a total volume of 1 ml 150 mM NaCl. The next day the adjuvants were collected by centrifugation 10 minutes at 13,000 x g. The adjuvants were washed with 1 ml 150 mM NaCl and finally carefully re-suspended using a pipette, in 150 mM NaCl to a concentration of 4 mg aluminium per ml [7]. Fluorescence of the labelled ABA preparations was measured by adding 100 μl in triplicates of each of the re-suspended preparations in a 96 well plate and measured using a SpectraMAX GEMINI XS, Molecular Devices, with an excitation wave length of 490 nm, emission wave length of 580 nm, and a cut of filter of 510 nm.
2.4. Zeta Potential and Size Distribution of Aluminium Adjuvants After labelling and washing Alhydrogel®
and Adju-Phos®
as described, the labelled adjuvant preparations were re-suspended in 150 mM NaCl or R10 culture medium to a concentration of 4 mg/ml. Re-re-suspended adjuvants were sonicated in an ultrasonic bath for 5 min and diluted with Milli-Q water to a concentration of 20 μg/ml. The Zeta potential of the diluted suspensions was determined using a NICOMP 380 ZLS Electrophoretic Light Scattering instrument from Particle Sizing Systems (Port Richey, FL, USA). The temperature was adjusted to 23 °C during
measurements and determinations were done in phase analysis mode. The dielectric constant (78.5), refractive index (1.33) and viscosity (0.93 mPas) of pure water were used for calculations. The size distribution of the adjuvant preparations was determined using a Coulter LS230 Laser Diffraction Particle Size Analyser equipped with a Small Volume Module (Beckman Coulter, CA, USA).
Size determination by flow cytometry: THP-1 cells, 1.4 x 10⁶ cells/ml, were mixed with an equal volume of R10
cell culture medium, Alhydrogel® 200 μg/ml in R10 culture medium or Adju-Phos® 200 μg/ml in R10 culture medium.
After one hour at 37 °C, the samples were analysed and the cell concentration in the samples was calculated from events collected in the cell gate (P3 shown in Fig. 3).
2.5. Co-culture with Aluminium Adjuvants and Cellular Association
Leukocytes were isolated by lysis of red blood cells by ammonium chloride. Briefly, 6 ml of the blood from healthy donors were suspended in 54 ml cold lysis solution containing 8% (w/v) NH4Cl in 10 mM sodium bicarbonate and 1
mM EDTA. The cell suspension was incubated for 10 min on ice, collected by centrifugation for 5 min at 500 x g, washed two times, each time with 10 ml R10 culture medium and finally re-suspended in R10 medium at a concentration of 2 x 10⁶
cells per ml and stored on ice until use.
Leukocytes at a final concentration of 1 x 10⁶ cells per ml were co-cultured 2 h at 37 °C in a 24 well plate with
Alhydrogel® pre-labelled with 100 μM lumogallion, or with non-labelled ABA as control, at a concentration of 12.5 μg
or 50 μg aluminium/ml in a total volume of 1200 μl R10 culture medium. In a second experimental set up leukocytes,1 x 106 cells per ml, were co-cultured with non-labelled Alhydrogel® or Adju-Phos® at final concentrations of 200, 400
and 800 μg aluminium/ml. In this experimental set up, controls were composed of cells cultured in plain culture medium (R10).
The cells were harvested from the plate and each of the incubations was divided into 6 aliquots of 200 μl and stained on ice for 30 min with APC labelled antibodies against CD3, CD11b, CD14, CD19 or an isotype control (all antibodies from BD Bioscience, San Jose, CA, USA, except the isotype control that came from R&D Systems, Minneapolis, MN, USA). The stained cells were then diluted with 500 μl cold PBS containing 0.1% (w/v) BSA and were direct, without any washing, analysed using an Accuri C6 flow cytometer and standard settings. From each sample, 20 000 leukocytes were collected and the different leukocyte populations were identified by their FSC x SSC scatter. Gate settings (FSC x SSC) were done on the various leukocyte populations (lymphocytes, monocytes and granulocytes) and their association with aluminium adjuvants was examined by their lumogallion fluorescence. In experiments using 200-800 μg aluminium/ml of non-labelled ABAs, the leukocyte populations were identified by gating antibody positive events into I give up an FSC x SSC dot plot and the number of events in the viable FSC x SSC gate of the corresponding leukocyte population was measured. Leukocytes from three donors were isolated and studied.
2.6. Sub-culture of THP-1 Cells Stained with CellTrace™ Far Red and Lumogallion Labelled Adjuvants THP-1 cells, 1 x 10⁶
cells/ml, were incubated for 20 min at 37 °C in PBS containing 0.25 μM CellTrace™ Far Red (Life Technologies, ThermoFisher Scientific, MA USA). R10 culture medium was added to the incubation and the cells were collected by centrifugation for 10 min at 300 x g. The cells were re-suspended in R10 medium at a cell concentration of 0.8 x 10⁶
cells/ml and incubated over night at 37 °C with Alhydrogel®
or Adju-Phos®
, pre-labelled with 100 μM lumogallion, at a concentration of 100 μg aluminium/ml, in a total volume of 5ml R10 medium in T25 culture flasks. Controls were composed of unstained or CellTrace™ stained THP-1 cells incubated in plain culture medium (R10).
The next day the cells were collected by centrifugation for 10 min at 300 x g and re-suspended in 1 ml R10 medium. Cell suspensions, 1 ml, were separated from free adjuvant by density centrifugation on 5 ml Ficoll-PaqueTM
(GE Healthcare Life Sciences, Uppsala, Sweden) for 25 min at 600 x g. Cells at the interphase were isolated, washed with PBS and re-suspended in R10 culture medium at 0.13 x 10⁶
cells/ml. 200 μl of the cell suspension was transferred to the wells in a 96 well plate and then cultured at 37 °C. At the start of the culture and after 24, 48 and 72 h of sub-culture, cells from four wells were collected and their fluorescence was analysed using an Accuri C6 flow cytometer and standard settings.
2.7. Confocal Microscopy
CellTrace™ Far Red were withdrawn and collected by centrifugation, 5 minutes at 1,000 x g. The cells were re-suspended in 1% (w/v) PFA, incubated for 15 minutes at room temperature, collected by centrifugation for 5 minutes at 1,000 x g and washed twice with PBS. Finally, the cells were re-suspended in a small volume of PBS and mounted on microscope slides using ProLong®
Gold Antifade Mountant with DAPI (Life Technologies, ThermoFisher Scientific, MA USA). After mounting, the samples were analysed on a Zeiss LSM 780 confocal microscope (Carl Zeiss Microscopy GmbH, Jena, Germany). DAPI was excited with the 405 nm laser and emitted light was detected between 410-493 nm. Lumogallion was excited with the 488 nm laser and emitted light was collected between 534-607 nm. CellTrace™ Far Red dye was excited with the 633 nm laser and emitted light was collected between 650-743 nm. Z-stack images were obtained at 63x magnification and analysed with ZEN 2012 (Carl Zeiss Microscopy GmbH).
2.8. Co-culture of THP-1 Cells with Aluminium Adjuvants, and Zeolites, and MTT Activity Two sets of triplicates of THP-1 cells 0.13 x 10⁶
cells per ml, were co-cultured in 96 well plates with Alhydrogel®
, Adju-Phos®
, zeolite Y (NaY) or dealuminated zeolite Y (USY) in a total volume of 200 μl R10 culture medium for 1 to 2 days at 37 °C. Co-cultures with aluminium adjuvants were done at final aluminium concentrations ranging from 6.26 to 100 μg/ml. NaY was used at concentrations ranging from 3.8 to 30 μg/ml whereas USY was used at concentrations ranging from 1.25 to 10 μg/ml. Prior to use, the zeolites were size fractionated and quantified using light scattering as previously described [9].
Controls consisted of cells cultured in R10 medium without any further additions. For the MTT assay, corresponding concentrations of aluminium adjuvants and zeolites in cell free R10 medium were assayed.
After co-culture of cells and particles (ABAs or zeolites) for 1 respectively 2 days, one set of triplicates from each of the particle concentrations was pooled and the number of cells was analysed using an Accuri C6 flow cytometer with an FSC x SSC live cell gate collecting 10,000 events.
MTT assays were performed on the other set of triplicates, and the controls, vide supra [8, 10]. Briefly 25 μl of the MTT reagent (5 mg/ml in PBS) was added to each well. The samples were incubated for another 2 h at 37 °C. After 2 h, 60 μL lysis buffer was added to solubilize the MTT-formazan product and the cells were incubated for another 24 h before the absorbance at 540 nm was read using a microplate reader.
The control, obtained after addition of the MTT reagent to cell free triplicates of particles in culture medium was subtracted from the absorbance obtained after co-culture with THP-1 cells.
Based on the estimated number of cells in the samples (by flow cytometry) and the MTT activity (absorbance) from the samples, the MTT activity was expressed as MTT activity per 106
cells. The MTT activities per 106
cells were then normalized against the MTT-activity per 106
cells obtained in plain culture medium at the appropriate day of the experiments. Three independent experiments were performed and the results are presented as mean +/- SD.
2.9. Co-culture of Human Peripheral Monocytes with Aluminium Adjuvants and MTT Activity
MACS technology based on magnetically labelling cells and retaining cells on a column was used to isolate monocytes (Monocyte isolation kit II, Miltenyi Biotec, Bergisch Gladbach, Germany).
Briefly, peripheral blood mononuclear cells (PBMC) were obtained from human leucocyte concentrates (Lund University Hospital, Sweden) from healthy donors by density centrifugation on Ficoll-PaqueTM (GE Healthcare Life
Sciences, Uppsala, Sweden). Untouched CD14+ monocytes were isolated by indirect magnetic labelling of
non-monocytes with a cocktail of biotin-conjugated antibodies against CD3, CD7, CD16, CD19, CD56, CD123 and CD235a followed by the addition of anti-Biotin MicroBeads. Non CD14+ monocytes were depleted on a MACS column and
cells in the flow through were collected, washed and re-suspended in R10 medium at 1 x 10⁶
cells per ml. The purity of the monocytes used in the experiments was 85-92% based on the binding of a FITC labelled anti CD14 antibody (BD Bioscience, San Jose, CA, USA) and flow cytometry.
Triplicates of isolated peripheral monocytes, final concentration 0.5 x 10⁶ cells per ml, were incubated in 96 well
plates with Alhydrogel® or Adju-Phos® corresponding to final aluminium concentrations ranging from 6.3 to 100 μg/ml in a total volume of 200 μl R10 culture medium during 1h or 4h at 37 °C.
One control consisted of cells cultured in R10 medium without any further additions and another control consisted of corresponding concentrations of ABA in cell free R10 medium.
After 1 respectively 4 h the MTT assay was performed by adding 25 μl of MTT reagent to each well as previously described. Based on the added number of cells in the samples (100.000 cells per well) and the MTT activity (absorbance) from the samples, the MTT activity was expressed as MTT activity per 106
cells. The MTT activities were then normalized against the MTT-activity obtained in plain culture medium of the 1 respective 4 h experiments as previously described. Three independent experiments were performed using different blood donors and the results are presented as mean +/- SD.
2.10. Culture of THP-1 Cells in Depleted Medium and MTT Activity
Nutrient depleted medium was prepared by supplementing a solution of 65.6 mM NaCl, 3.2 mM KCl, 0.7 mM MgSO4, 1.6 mM CaCl2, 0.6 M Na2HPO4, 23.9 mM NaHCO3 and 6.3 mM Na-citrate, pH 7,4 with 10 mM Hepes (Life
Technologies, ThermoFisher Scientific, MA USA), 3.6 mM glucose, 2 mM Glutamax (Life Technologies, ThermoFisher Scientific, MA USA), 1x non-essential amino acids (Life Technologies, ThermoFisher Scientific, MA USA), 1x MEM vitamin solution (Sigma-Aldrich, St. Louis, MO, USA), 10% foetal calf serum of EU grade, and 100 μg/ml of gentamicin.
Two sets of triplicates of THP-1 cells 0.13 x 10⁶ cells per ml, were cultured in 96 well plates in a total volume of
200 μl nutrient depleted medium or in R10 medium for 1 to 2 days at 37 °C. Controls consisted of an extra set of triplicates of THP-1 cells cultured in R10 medium.
After co-culture of cells and particles (ABAs or zeolites) for 1 respectively 2 days, one set of triplicates from each of the particle concentrations was pooled and the number of cells was analysed using an Accuri C6 flow cytometer with an FSC x SSC live cell gate collecting 10,000 events. The other set of triplicates and the controls containing nutrient depleted medium or cell free R10 medium, were used for the MTT assay, as previously described.
Based on the estimated number of cells in the samples (by flow cytometry) and the MTT activity (absorbance) from the samples, the MTT activity was expressed as MTT activity per 106 cells. The MTT activities per 106 cells were then
normalized against the MTT-activity per 106 cells obtained in the extra set of triplicates of THP-1 cells cultured in R10
medium at the appropriate day of the experiments
Three independent experiments were performed and the results are presented as mean +/- SD. 3. RESULTS
3.1. Characterization of Lumogallion Stained ABAs
Incubation of ABAs with lumogallion, a fluorimetric reagent for aluminium ions [6], creates highly fluorescent labelled ABA preparations [7]. Of the two aluminium salts most commonly used as adjuvants, aluminium oxyhydroxide, (Alhydrogel®
), shows a linear increase in fluorescence upon incubation with lumogallion, whereas aluminium hydroxyphosphate, (Adju-Phos®
) becomes saturated (Fig. 1).
Fig. (1). Fluorescence labelling of aluminium adjuvants. Aluminium adjuvants were labelled with various concentrations of lumogallion by overnight incubation, washed and re-suspended in 150 mM NaCl. Fluorescence from re-suspended Alhydrogel® (●)
and Adju-Phos® (■) particles was measured by excitation at 490 nm and emission at 580 nm.
10000000 9000000 8000000 7000000 6000000 5000000 4000000 3000000 2000000 1000000 0
Fluorescence intensity (RFU)
0 20 40 60 80 100
Concentration lumogallion (mM)
Alhydrogel Adju-Phos
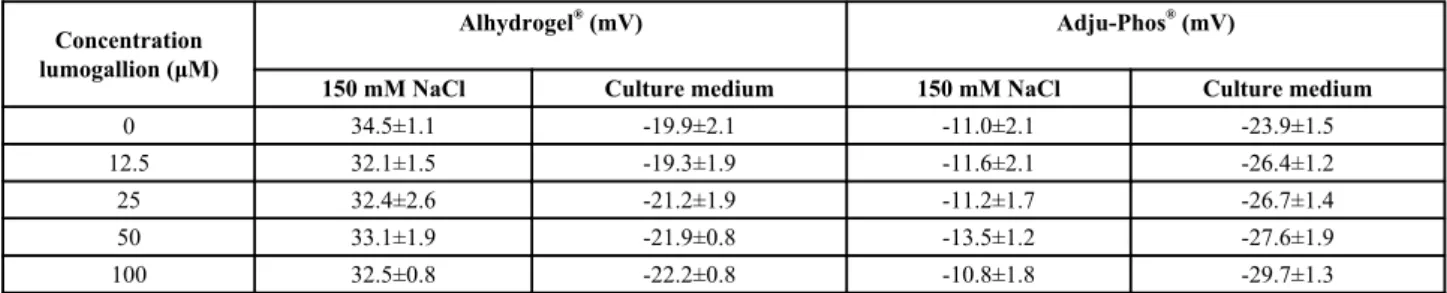
Physicochemical characterisation of the labelled ABAs showed no or minor effects on the zeta potential after re-suspension in NaCl and a slightly decreased zeta potential after labelling Adju-Phos®
with the highest investigated concentrations of lumogallion (50 and 100 μM) and re-suspension into culture medium containing 10% serum (Table 1).
Table 1. Zeta potential after labelling aluminium adjuvants with lumogallion.
Aluminium adjuvants were labelled with various concentrations of lumogallion and after washing suspended at a concentration of 4 mg/ml in either 150 mM NaCl or cell culture medium, R10. Number of zeta potential determinations (n) was 6.
Concentration lumogallion (μM)
Alhydrogel® (mV) Adju-Phos® (mV)
150 mM NaCl Culture medium 150 mM NaCl Culture medium
0 34.5±1.1 -19.9±2.1 -11.0±2.1 -23.9±1.5
12.5 32.1±1.5 -19.3±1.9 -11.6±2.1 -26.4±1.2
25 32.4±2.6 -21.2±1.9 -11.2±1.7 -26.7±1.4
50 33.1±1.9 -21.9±0.8 -13.5±1.2 -27.6±1.9
100 32.5±0.8 -22.2±0.8 -10.8±1.8 -29.7±1.3
No significant change of size distribution was observed due to lumogallion labelling, however, re-suspension of both Alhydrogel® and lumogallion labelled Alhydrogel®
in culture medium containing 10% serum, resulted in a significantly increased size distribution of the adjuvant (Fig. 2).
Fig. (2). Size distribution of aluminium adjuvant particles. Aluminium adjuvants, non-labelled and lumogallion labelled, were re-suspended in 150 mM NaCl or cell culture medium containing 10% fetal calf serum (R10) before size determination of the adjuvant particles. A. Alhydrogel® re-suspended in 150 mM NaCl (❍) or in cell culture medium (●). B. Adju-Phos® re-suspended in 150 mM
NaCl (❏) or in cell culture medium (■). C. Lumogallion (100 μM) labelled Alhydrogel® re-suspended in 150 mM NaCl (❍) or in cell
culture medium (●). D. Lumogallion (100 μM) labelled Adju-Phos® re-suspended in 150 mM NaCl (❏) or in cell culture medium
(■).
The size distribution of Alhydrogel®
showed surprisingly large particles after resuspension in culture medium containing serum and this was quite different from the particle size estimated by forward scatter versus side scatter using flow cytometry (Fig. 3), or visualized by light microscopy, in which the Alhydrogel®
particles are clearly smaller than THP-1 cells which have an approximate size of 10-15 μm.
12 10 8 6 4 2 0 Volume (%) 0,25 0,5 1 2 4 8 16 32 64 128
Particle diameter (mm) 0,25 0,5 Particle diameter (mm)1 2 4 8 16 32 64 128
Volume (%) 8 9 7 6 5 4 3 2 1 0 12 10 8 6 4 2 0 Volume (%) 0,25 0,5 1 2 4 8 16 32 64 128
Particle diameter (mm) 0,25 0,5 Particle diameter (mm)1 2 4 8 16 32 64 128
Volume (%) 8 9 7 6 5 4 3 2 1 0
A.
B.
C.
D.
Flow cytometry detects cells and particles by their forward and side scatter and by a gate setting, P3, as outlined in (Fig. 3), information regarding THP-1 cells, such as a number of events and sample volume can be collected and used to calculate the number of cells/ml in the sample. The presence of 16 μm and larger ABA particles, as shown by laser diffraction of Alhydrogel®
suspended in R10 medium (Fig. 2A), would be detected in the same gate as THP-1 cells, but no such particles were detected in the THP-1 gate (Fig. 3). Neither could any particles of this size be observed in light microscope and after incubation of 1.4 x 10⁶
cells per ml with an equal volume of culture medium, Alhydrogel®
or Adju-Phos® suspensions, an expected 50% reduction of the cell concentration, i.e. 0.7 x 10⁶ cells per ml, was obtained
in all incubation mixtures using a gate setting on the THP-1 cells, as P3 shown in (Fig. 3) to calculate the cell concentration.
Fig. (3). Flow cytometry of lumogallion labelled aluminium adjuvants and THP-1. Lumogallion labelled ABAs suspended in R10 medium were incubated with and without THP-1 cells for 1 h at 37°C and then analysed by flow cytometry using forward (FSC) and side (SSC) scatter. Gate setting used to analyse THP-1 cells (P3) and ABA particles (P4). A. Lumogallion labelled Alhydrogel®,
100 μg/ml in R10 medium. B. Lumogallion labelled Adju-Phos®, 100 μg/ml in R10 medium. C. THP-1 cells incubated with R10
medium. D. THP-1 cells incubated with Alhydrogel®, 100 μg/ml in R10 medium. E. THP-1 cells incubated with Adju-Phos®, 100
μg/ml in R10 medium.
3.2. ABA Interactions with Cells
Lumogallion labelled ABAs can be utilized to investigate the interaction between the adjuvants and different leukocyte populations in peripheral blood. By flow cytometry, the various leukocyte populations can be identified and their association with the different types of ABA can be explored (Fig. 4).
Fig. (4) shows cells associated with ABAs in the upper right quadrant after co-culture with a low concentration of ABA (12.5 μg/ml) whereas a summary of leukocyte association with the two main forms of ABA after co-culture with a four times higher concentration of ABAs (50 μg/ml) is presented in (Table 2). Based on experiments with leukocytes from three independent donors (Table 2), a more pronounced cellular association was observed for aluminium oxyhydroxide (Alhydrogel), with B-lymphocytes being the exception.
Cellular association with ABA particles, either adsorbed on the cell surface or endocytosed, may affect the condition and viability of the cells. Further increasing the ABA concentration from 100 to 800 μg/ml showed almost no effect on the recovered and living number of granulocytes whereas decreased recovery was observed for both monocytes and lymphocytes (Fig. 5). A clear difference regarding cell recovery between the two forms of ABA was also observed, showing a much lower recovery after incubation with Adju-Phos®
(Fig. 5) compared to Alhydrogel®
. Side scatter 4.248.615 2.000.000 0 0 5.000.000 10.000.000 15.179.386 Forward scatter P4 3.0% P30.0% Side scatter 4.248.615 2.000.000 0 0 5.000.000 10.000.000 15.179.386 Forward scatter P4 0.1% P3 0.0% Side scatter 4.248.615 2.000.000 0 0 5.000.000 10.000.000 15.179.386 P4 2.7% P3 79.8% Forward scatter Side scatter 4.248.615 2.000.000 0 0 5.000.000 10.000.000 15.179.386 P4 3.8% P3 25.7% Forward scatter Side scatter 4.248.615 2.000.000 0 0 5.000.000 10.000.000 15.179.386 P4 0.3% P3 7.1% Forward scatter
A
B
C
D
E
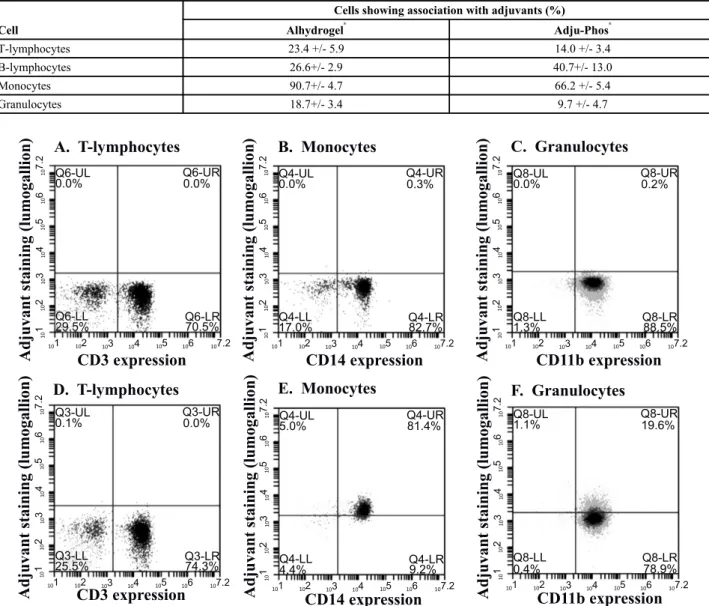
Table 2. Al adjuvant associated with human peripheral leukocytes.
Leukocytes were incubated with 50 μg/ml of lumogallion labelled ABAs and the percentage fluorescent cells of each population, i.e. percentage of lymphocytes, monocytes or granulocytes associated with ABAs, was determined. Results based on leukocytes isolated from three different donors.
Cell
Cells showing association with adjuvants (%) Alhydrogel® Adju-Phos® T-lymphocytes 23.4 +/- 5.9 14.0 +/- 3.4 B-lymphocytes 26.6+/- 2.9 40.7+/- 13.0 Monocytes 90.7+/- 4.7 66.2 +/- 5.4 Granulocytes 18.7+/- 3.4 9.7 +/- 4.7
Fig. (4). Cellular association of aluminium adjuvant determined by flow cytometry. Human peripheral leucocytes were incubated with a low concentration (12.5 μg/ml) of lumogallion labelled Alhydrogel®
or with non-labelled Alhydrogel®
before the cells were stained with fluorescently labelled antibodies against T-lymphocytes, monocytes and granulocytes. Lymphocytes, monocytes and granulocytes were identified by FSC x SSC dot plots and after gate settings on respective populations, their association with fluorescent ABAs was determined. A-C; Cells incubated in the presence of non-labelled Alhydrogel®
. D-F; Cells incubated in the presence of lumogallion labelled Alhydrogel®
. A and D; T-lymphocytes identified by antibodies against CD3. B and E; Monocytes identified by antibodies against CD14. C and F; Granulocytes identified by antibodies against CD11b.
3.3. Tracing Intracellular ABAs
ABAs probed with lumogallion have earlier been shown to be endocytosed by cells [7] and labelling cells with CellTrace™ Far Red makes it possible to trace multiple generations by flow cytometry and dye dilution (Fig. 6A). Intracellular ABAs labelled with lumogallion can clearly be visualized inside cells co-stained with the cytoplasmic stain CellTrace™ Far Red using confocal microscopy (Fig. 6B) and by following the dilution of the CellTrace dye and at the same time also follow the reduction of fluorescence from endocytosed lumogallion labelled ABAs, the elimination of adjuvants from the cells can be investigated.
101 102 103 104 105 106 107.2 10 1 10 2 10 3 10 4 10 5 10 6 10 7.2
Adjuvant staining (lumogallion) CD3 expression 101 102 103 104 105 106 107.2
10 1 10 2 10 3 10 4 10 5 10 6 10 7.2
Adjuvant staining (lumogallion) CD14 expression 101 102 103 104 105 106 107.2
10 1 10 2 10 3 10 4 10 5 10 6 10 7.2
Adjuvant staining (lumogallion) CD11b expression
Q6-UL 0.0% Q6-UR0.0% Q6-LL 29.5% Q6-LR70.5% Q4-UL 0.0% Q4-UR0.3% Q4-LL 17.0% Q4-LR82.7% Q8-UL 0.0% Q8-UR0.2% Q8-LL 1.3% Q8-LR88.5% Q3-UL 0.1% Q3-UR0.0% Q3-LL 25.5% Q3-LR74.3% Q4-UL 5.0% Q4-UR81.4% Q4-LL 4.4% Q4-LR9.2% Q8-UL 1.1% Q8-UR19.6% Q8-LL 0.4% Q8-LR78.9%
A. T-lymphocytes B. Monocytes C. Granulocytes
Fig. (5). Recovered human leukocytes after incubation with various concentrations of adjuvants. Human leukocytes were co-cultured for 2h with different concentrations of Alhydrogel® (black pile) respective Adju-Phos® (grey pile). By means of specific
CD-markers four different populations of leukocytes were identified using flow cytometry and cells of the respective leukocyte population are expressed as % of cells obtained after incubation in culture medium. A. T-lymphocytes. B. Monocytes. C. Granulocytes and D. B-lymphocytes. Data presented as mean +/- SD of three independent donors.
Fig. (6A). Flow cytometry of cells stained with CellTrace™ Far Red immediately after incubation with aluminium adjuvants. THP-1 cells stained with the cytoplasm stain CellTrace™ Far Red were incubated with lumogallion labelled ABAs. The cells were separated from free adjuvant particles and re-suspended in culture medium. Experimental conditions as described in the Materials and Methods section. Left histogram: Aluminium adjuvant fluorescence intensity (lumogallion) associated with THP-1 cells immediately after separation from free ABAs in the culture medium. Black histogram: Cells incubated with lumogallion labelled Alhydrogel®. Grey histogram: Cells incubated with lumogallion labelled Adju-Phos®. White histogram: Cells incubated in culture
medium. Right histogram: Cytoplasm fluorescence intensity (CellTrace™ Far Red) from THP-1 cells immediately after separation from free ABAs in the culture medium. Black histogram: Cells incubated with lumogallion labelled Alhydrogel®. Grey histogram:
Cells incubated with lumogallion labelled Adju-Phos®
. White histogram: Non-stained cells in culture medium. Histograms of cells stained with CellTrace™ Far Red and incubated with the two forms of lumogallion labelled ABAs showed the same fluorescence intensity (black and grey histograms are completely overlapping).
100,0 80,0 60,0 40,0 20,0 0,0
% cells in standard gate
Concentration adjuvant (mg/ml) 0 100 200 400 800 100,0 80,0 60,0 40,0 20,0 0,0
% cells in standard gate
Concentration adjuvant (mg/ml) 0 100 200 400 800 100,0 80,0 60,0 40,0 20,0 0,0
% cells in standard gate
Concentration adjuvant (mg/ml) 0 100 200 400 800 100,0 80,0 60,0 40,0 20,0 0,0
% cells in standard gate
Concentration adjuvant (mg/ml) 0 100 200 400 800 T-lymphocytes Monocytes B-lymphocytes Granulocytes
A.
B.
C.
D.
102.2 103 104 105 106 107.2Fluorescence (lumogallion)
101.5 103 104 105 106 107.2Fluorescence (CellTrace)
0 200 400 600 800Cell number
0 500 1,000 1,200Cell number
Fig. (6B). Visualization of intracellular aluminium adjuvant. Confocal images of the centre sections of THP-1 cells that after staining with CellTrace™ Far Red were incubated with lumogallion labelled ABAs, washed and put back in culture. Experimental conditions as described in the Materials and Methods section. Images show nucleus as blue (DAPI), cytoplasm as red (CellTrace™ Far Red) and aluminium adjuvant as green (lumogallion). Upper left. A cell immediately after incubation with lumogallion labelled Alhydrogel® and removal of non-phagocytosed ABA. Upper right. A cell 3 days in culture after incubation with lumogallion
labelled Alhydrogel® and removal of non-phagocytosed ABA. Lower left. A cell immediately after incubation with lumogallion
labelled Adju-Phos® and removal of non-phagocytosed ABA. Lower right. A cell without any incubation with aluminium adjuvants. However, extracellular, not endocytosed ABA particles, must be removed before commencing the fluorescence measurements. To obtain THP-1 cells with only endocytosed and intra cellular ABAs, extracellular ABAs were removed by density centrifugation, allowing the collection of THP-1 cells in the interphase, whereas ABA particles are centrifuged through the density barrier. (Figs. 6A and 6B) show the fluorescence of CellTrace™ Far Red stained THP-1 cells containing intracellular lumogallion labelled ABAs at day zero before sub-culturing of the cells begins. Cells were then sub-cultured at 37°C in a humidified atmosphere with 5% CO2. Samples were withdrawn every 24 hours and the
cellular fluorescence was examined by flow cytometry and expressed as per cent of the fluorescence intensity obtained at day zero (Fig. 6C).
Fig. (6C). Mean fluorescence intensity from stained THP-1 cells in culture. Cytoplasm stained THP-1 cells continuously cultured after separation from lumogallion labelled adjuvants in the culture medium. At various days, samples were withdrawn, analysed by flow cytometry and the mean fluorescence intensity (MFI) was expressed as % of MFI obtained immediately after separation from free ABAs in the culture medium (Day 0). Experimental conditions as described in the Materials and Methods section. Left graph: Cells incubated with Alhydrogel®; lumogallion fluorescence (■) and CellTrace™ Far Red fluorescence (❍). Right graph: Cells
incubated with Adju-Phos®; lumogallion fluorescence (■) and CellTrace™ Far Red fluorescence (❍).
Day 0
Day3
Day 0
Day 0
20 mm 100,0 80,0 60,0 40,0 20,0 0,0 120,0 0 1 2 3 4 y = 10,016x2 - 60,317x + 99,486 R2 = 0,99894 R2 = 1 y = 5,1039x2 - 43,646x + 100,02 Alhydrogel AdjuPhos y = 10,815x2 - 62,655x + 99,311 R2 = 0,99812 R2 = 0,99986 y = 6,5246x2 - 47,805x + 99,831 100,0 80,0 60,0 40,0 20,0 0,0 120,0 0 1 2 3 4 Time (Day) Fluor escence (% of day 0) Time (Day) Fluor escence (% of day 0)3.4. ABA and MTT Activity
The intracellular presence of ABA will undoubtedly affect the cells and in an earlier report, THP-1 cells showed reduced proliferation on co-culture with ABAs [8]. Reduced proliferation was observed after co-culture of THP-1 cells with the two forms of ABA, as well as after co-culture with zeolite Y (NaY) and with dealuminated zeolite Y (USY). Both Alhydrogel® and USY decreased the cell growth by approximately 13-15% at day 1, and by 25-30% at day 2
(Figs. 7A and 7C). The decrease owing to Adju-Phos® and NaY was approximately the same, 10-15 % at day 1, and
20-30% at day 2.
Fig. (7). MTT activity after co-culture with Alhydrogel® and USY. THP-1 cells were co-cultured with various concentrations of
Alhydrogel®
or dealuminated zeolite Y (USY). At day 1 (■) and day 2 (▲) the number of cells in each of the incubations was counted and an MTT assay was performed. The MTT activity (absorbance) per 106
cells was calculated and to normalize the samples, the ratio between MTT activity per cells in the various cell cultures and the results obtained from cells in culture medium without any further additions at the corresponding day was assessed.
A. Cell number after culture with Alhydrogel®
. Cell number expressed as % of cells obtained after culture in medium without any further additions. B. Normalized MTT activity ratio of THP-1 cells cultured in the presence of Alhydrogel®
. Dotted line shows the expected normalized MTT ratio using the MTT assay to estimate the number of cells in a sample. C. Cell number after culture with USY. Cell number expressed as % of cells obtained after culture in medium without any further additions. D. Normalized MTT activity ratio of THP-1 cells cultured in the presence of USY. Data presented as mean +/- SD of three independent experiments.
The MTT assay is widely used to estimate the number of viable cells in a sample. The assay is based on the assumption that the quantity of formazan produced is directly proportional to the number of viable cells and that formazan production by all the individual cells in the sample is uniform [10]. However, during co-culture of THP-1 cells and ABAs, the MTT assay gives a misleading result showing a too high number of cells in the sample [8]. By calculating the MTT absorbance, i.e. the formazan production, per 106 cells (number of viable cells identified by
counting) in a sample, an escalating value was obtained upon co-culture with increasing concentrations of ABAs. To normalize the samples, the ratio between MTT-activity per 106
cells and the MTT-activity per 106
cells in plain culture medium was calculated for each separate day and in Figs. (7A and 7D) the results after co-culture in the presence of Alhydrogel®
and USY are shown.
All experiments were done in triplicates and the mean values with standard deviations are shown in (Table 3). The table presents values obtained from co-cultures with 10-15% reduced proliferation at day 1, and 20-30% at day 2. The results indicate an apparent increased normalized MTT activity ratio for both ABAs and the aluminium containing zeolite NaY, whereas the USY ratio was close to the expected ratio of one.
100 90 80 70 60 50 40 0 20 40 60 80 100
Number of cells (% of medium control)
Concentration Alhydrogel mg/ml Day 1 Day 2 1,60 1,40 1,20 1,00 0,80 0 20 40 60 80 100 100 90 80 70 60 50 40 0 2 4 6 8 10
Number of cells (% of medium control)
Concentration USY mg/ml Day 1 Day 2 Normalized MTT activity Concentration Alhydrogel mg/ml 0 2 4 6 8 10 Concentration USY mg/ml Day 1 Day 2 Medium control 1,60 1,40 1,20 1,00 0,80 Normalized MTT activity Day 1 Day 2
A.
B.
C.
D.
Table 3. Cellular MTT activity after culture of cells in the presence of Al-adjuvants, zeolites or depleted growth medium. THP-1 cells were cultured in the presence of ABAs, zeolites or in depleted culture medium. At day 1 respectively day 2 the cell numbers were counted and an MTT assay of the various incubations was performed. The MTT activity (absorbance) per 1cells was calculated and to normalize the samples, the ratio between MTT-activity in plain culture medium was assessed for each separate day. Data presented as mean +/- SD of three independent experiments.
Sample Day 1 Normalized MTT activity Day 2 Normalized MTT activity Alhydrogel®, 100 µg/ml 1.10 ± 0.12 1.42 ± 0.15 Adju-Phos® ,100 µg/ml 1.18 ± 0.09 1.47 ± 0.12 NAY, 30 µg/ml 1.39 ± 0.17 1.42 ± 0.21 USY, 10 µg/ml 1.01 ± 0.09 1.10 ± 0.10 Depleted medium 1.15 ± 0.15 1.20 ± 0.12
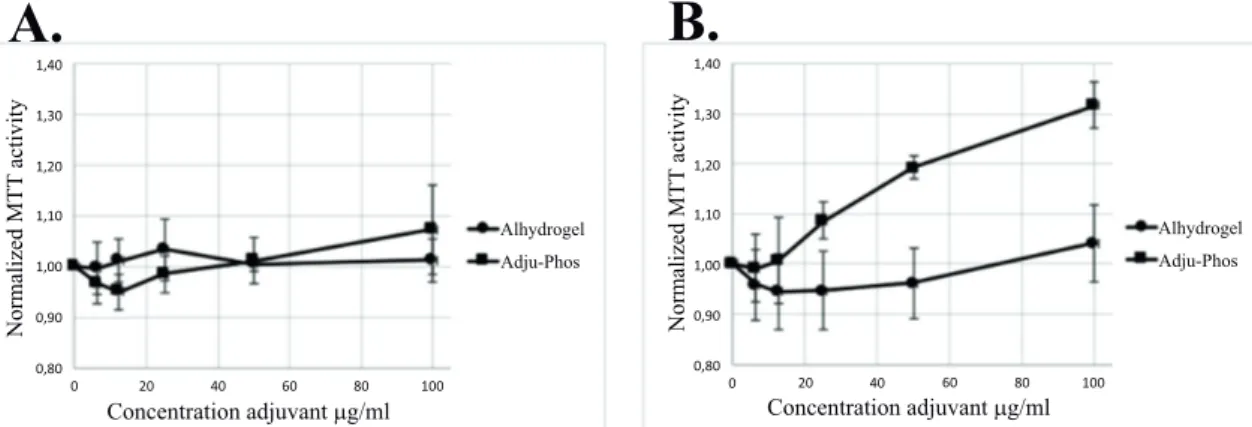
Co-culture with ABAs did not only affect the MTT activity of THP-1 cells but also affected human peripheral monocytes (Fig. 8). Co-culture for one hour (i.e. one-hour incubation with ABAs followed by two hours’ incubation with the MTT reagent) showed no significant increase of the normalized MTT activity, although a prolonged incubation with ABAs showed a significant increase of normalized MTT activity upon co-culture with Adju-Phos®.
Fig. (8). MTT activity by human monocytes after co-culture with Al-adjuvants. Normalized MTT activity ratio of human peripheral monocytes cultured in the presence of Alhydrogel®
(●) and Adju-Phos®
(■). The MTT assay was performed either 1 h (A) or 4 h (B) after addition of ABAs to the monocytes. Data presented as mean +/- SD from three independent donors.
Finally, in an attempt to imitate the increased MTT activity per 106 cells, THP-1 cells were cultured in nutrient
depleted medium, resulting in a slightly increased normalized MTT activity (Table 3). 4. DISCUSSION
Fluorescent ABAs are easily prepared by labelling with lumogallion and the labelling can be done at a standard equipped laboratory. The labelling process doesn’t result in any significant effect on the zeta potential upon re-suspension of the ABA in 150 mM NaCl (Table 1), however, re-re-suspension into medium containing serum drastically changed the zeta potential as earlier reported [11] and the same zeta potential change was obtained regardless the ABA was stained with lumogallion or not (Table 1).
Sedimentation of ABAs commonly used in vaccine formulations can be observed by the naked eye and the sedimentation rate of the ABA particles made, in our opinion, size determination by dynamic light scattering undependable. Instead, laser diffraction, which can be performed under constant stirring, was chosen as method estimating the size distribution of the ABAs before and after labelling with lumogallion to avoid artefacts due to sedimentation of ABA particles. Re-suspension of native as well as lumogallion modified Alhydrogel®
in 150 mM NaCl revealed a bimodal size distribution centred at approximately 0.7 and 2 μm, respectively, whereas Adju-Phos®
suspensions were monodisperse, with an approximate size of 1.5 μm (Fig. 2). ABAs consist of nanoparticles that aggregate into micrometre-sized particles [12, 13] and in the experimental set up ABAs were suspended and stored in a non-buffered 150 mM NaCl solution to avoid any ligand exchange mechanisms. The two forms of ABAs used, have a completely different isoelectric point [14] and upon size determination by Laser Diffraction, the samples became highly
1,40 1,30 1,20 1,10 1,00 0,90 0,80 Normalized MTT activity 0 20 40 60 80 100 Concentration adjuvant mg/ml Alhydrogel Adju-Phos 1,40 1,30 1,20 1,10 1,00 0,90 0,80 Normalized MTT activity 0 20 40 60 80 100 Concentration adjuvant mg/ml Alhydrogel Adju-Phos
A.
B.
diluted with distilled water. The absence of controlled pH and an extremely low ionic strength during size determination may differently affect the aggregation size of the two forms of ABAs and result in the bimodal size distribution of Alhydrogel®
and the monodispersed distribution by Adju-Phos®
shown in (Fig. 2).
In general the size determinations fit well with earlier reported size distributions of non-modified Alhydrogel® and
Adju-Phos® [11], however, Alhydrogel®, both non-modified and labelled with lumogallion, showed a surprising and
unrealistic size distribution profile upon resuspension in cell culture medium containing fetal serum (Fig. 2). The formation of large particles, cell sized and larger, could not be confirmed by either light microscopy or by flow cytometry, and the conclusion was that laser diffraction cannot be used to determine the size distribution of Alhydrogel®
suspended in medium containing serum. No difference in size distribution between non-modified ABAs and ABAs labelled with lumogallion could be observed neither by flow cytometry or by light microscopy and we conclude that labelling ABAs with lumogallion creates traceable ABAs with no or minor physicochemical differences regarding zeta potential and size distribution, compared to non-modified ABAs (Table 1 and Fig. 2).
Lumogallion labelled ABAs proved to be a valuable tool in the investigation of cellular phagocytosis of ABAs. This is exemplified by the incubation with human leukocytes in which monocytes can clearly be identified together with a minor fraction of the granulocytes (Fig. 4). The ABA concentration in human vaccines is considerably higher than the concentration used to identify phagocytosing cells among peripheral leukocytes. The maximal amount of ABA in an administered dose of a vaccine is 1.25 mg Al per dose [15] and generally a vaccine contains 0.5 – 1 mg ABA per dose. A subcutaneous administrated volume is usually 0.5 ml and with an expected 1:1 dilution at the administration site by interstitial fluids, an initial concentration of ABA of approximately 500 μg/ml can be expected at the administration site. This concentration is quite different from the concentration of ABAs used to identify phagocytosing cells (Fig. 4) and by increasing the ABA concentration as shown in (Table 2), interaction with non-phagocytosing cells was noted. Interactions with non-phagocytosing cells, such as B- and T-lymphocytes, were observed as the ABA concentration was increased four times from 12.5 μg/ml (Fig. 4) to 50 μg/ml (Table 2) and increasing the ABA concentrations further, ABAs became toxic, evidenced by the reduced recovery of the various cell populations after co-culture with non-modified ABAs (Fig. 5). Reduced recovery of both phagocytosing and non-phagocytosing cells was obtained, although a surprisingly low reduction of granulocytes was noticed. The most significant reduction was observed upon co-culture with Adju-Phos®
indicating higher toxicity of this form of ABA, as reported earlier by Mold et al . 2016.
Prior to phagocytosis, a surface interaction between cells and ABA particles must occur and this will happen with phagocytosing as well as non-phagocytosing cells. The results indicate that ABAs are not only toxic due to intracellular cellular uptake, but also to interaction with the cell surface since a significant reduction of non-phagocytosing cells as lymphocytes was observed after co-culture of leukocytes with high concentrations of ABAs (Fig. 5). However, no correlation between the toxicity of the two forms of ABA and B- and T-lymphocyte association was found (Fig. 5 and Table 2), and further investigations will reveal the impact of surface interaction with ABA particles and toxicity.
Pre-labelling of ABAs with lumogallion creates fluorescent ABAs that can be easily detected and traced intracellularly. Tracing cell division by a cytoplasmic stain revealed that internalized ABA particles are not excreted from the cells and remain inside the cells even after several cell divisions (Fig. 6). This agrees well with reports utilizing electron microscopy, showing long-time persistence of ABAs inside macrophages in vivo after administration of a vaccine [4, 5, 16, 17]. A persistent intracellular presence of ABA will most probably affect the overall biochemistry within the cells. One important feature is the metabolic activity and the MTT assay measures activity from mitochondrial dehydrogenases such as NADH-reductase [18] and thereby indirectly assesses the metabolic activity of the mitochondria.
The MTT assay, showed an increased mitochondrial activity of both THP-1 cells and peripheral monocytes upon co-culture with ABAs (Figs. 7 , 8 and Table 3). In a nutrient depleted culture medium, an increased de novo synthesis of biomolecules can be expected and thereby an increased metabolic demand. In a depleted culture medium, an increased MTT activity was noted (Table 3) demonstrating that the MTT assay indeed reflects the metabolic activity by the cells.
Two forms of the zeolite Y, USY and NaY, were used as controls. These forms of zeolite Y have approximately the same particle size as the ABAs used [8]. Dealuminated zeolite Y (USY) form almost insoluble particles with a very low content of aluminium whereas the sodium form of zeolite Y (NaY) consists of relatively soluble particles with a high content of aluminium [19]. Upon phagosomal and lysosomal processing some of the ABA particles will be solubilized releasing Al3+ ions. Increased mitochondrial activity was observed on exposure to both ABAs and NaY whereas the
mitochondrial activity. Increased mitochondrial activity will escalate the formation of reactive oxygen species and thereby oxidative stress leading to dysfunctional mitochondria. In comparison, oxidative stress and dysfunctional mitochondria have earlier been implicated in the induction of inflammasomes by ABA [20, 21] and in association with neurodegenerative disorders [22].
In conclusion, lumogallion labelled ABAs is a valuable tool tracing interactions between ABAs and cells. Upon phagocytosis lumogallion labelled ABAs can be traced intracellularly and ABAs persist inside the monocytic cell line THP-1 during several cell cycles. Furthermore, the intracellular presence of ABAs increases the mitochondrial activity, as measured by the MTT assay, in cell lines and peripheral monocytes. The findings also imply that it can be the presence of intracellular Al ions that triggers an increased mitochondrial activity.
ETHICS APPROVAL AND CONSENT TO PARTICIPATE Not applicable.
HUMAN AND ANIMAL RIGHTS
No Animals/Humans were used for studies that are base of this research. CONSENT FOR PUBLICATION
Not applicable.
CONFLICT OF INTEREST
The authors declare no conflict of interest, financial or otherwise. ACKNOWLEDGEMENT
This research received support from the UK MRC. REFERENCES
[1] Glenny AT, Pope CG, Waddington H. U W. Immunological notes. XVII-XXIV. J Pathol Bacteriol 1926; 29(1): 31-40. [http://dx.doi.org/10.1002/path.1700290106]
[2] Exley C, Siesjö P, Eriksson H. The immunobiology of aluminium adjuvants: how do they really work? Trends Immunol 2010; 31(3): 103-9. [http://dx.doi.org/10.1016/j.it.2009.12.009] [PMID: 20153253]
[3] Rinella JV, White JL, Hem SL. Effect of pH on the Elution of Model Antigens from Aluminum-Containing Adjuvants. J Colloid Interface Sci 1998; 205(1): 161-5.
[http://dx.doi.org/10.1006/jcis.1998.5648] [PMID: 9710509]
[4] Morefield GL, Tammariello RF, Purcell BK, et al. An alternative approach to combination vaccines: Intradermal administration of isolated components for control of anthrax, botulism, plague and staphylococcal toxic shock. J Immune Based Ther Vaccines 2008; 6: 5.
[http://dx.doi.org/10.1186/1476-8518-6-5] [PMID: 18768085]
[5] Lu F, Hogenesch H. Kinetics of the inflammatory response following intramuscular injection of aluminum adjuvant. Vaccine 2013; 31(37): 3979-86.
[http://dx.doi.org/10.1016/j.vaccine.2013.05.107] [PMID: 23770306]
[6] Mold M, Eriksson H, Siesjö P, Darabi A, Shardlow E, Exley C. Unequivocal identification of intracellular aluminium adjuvant in a monocytic THP-1 cell line. Sci Rep 2014; 4: 6287.
[http://dx.doi.org/10.1038/srep06287] [PMID: 25190321]
[7] Mile I, Svensson A, Darabi A, Mold M, Siesjö P, Eriksson H. Al adjuvants can be tracked in viable cells by lumogallion staining. J Immunol Methods 2015; 422: 87-94.
[http://dx.doi.org/10.1016/j.jim.2015.04.008] [PMID: 25896212]
[8] Ohlsson L, Exley C, Darabi A, Sandén E, Siesjö P, Eriksson H. Aluminium based adjuvants and their effects on mitochondria and lysosomes of phagocytosing cells. J Inorg Biochem 2013; 128: 229-36.
[http://dx.doi.org/10.1016/j.jinorgbio.2013.08.003] [PMID: 23992993]
[9] Dahm A, Eriksson H. Ultra-stable zeolites--a tool for in-cell chemistry. J Biotechnol 2004; 111(3): 279-90. [http://dx.doi.org/10.1016/j.jbiotec.2004.04.008] [PMID: 15246664]
[10] Mosmann T. Rapid colorimetric assay for cellular growth and survival: Application to proliferation and cytotoxicity assays. J Immunol Methods 1983; 65(1-2): 55-63.
[11] Mold M, Shardlow E, Exley C. Insight into the cellular fate and toxicity of aluminium adjuvants used in clinically approved human vaccinations. Sci Rep 2016; 6: 31578.
[http://dx.doi.org/10.1038/srep31578] [PMID: 27515230]
[12] Johnston CT, Wang SL, Hem SL. Measuring the surface area of aluminum hydroxide adjuvant. J Pharm Sci 2002; 91(7): 1702-6. [http://dx.doi.org/10.1002/jps.10166] [PMID: 12115832]
[13] Burrell LS, Johnston CT, Schulze D, Klein J, White JL, Hem SL. Aluminium phosphate adjuvants prepared by precipitation at constant pH. Part I: Composition and structure. Vaccine 2000; 19(2-3): 275-81.
[http://dx.doi.org/10.1016/S0264-410X(00)00160-2] [PMID: 10930682]
[14] Zhu D, Huang S, McClellan H, et al. Efficient extraction of vaccines formulated in aluminum hydroxide gel by including surfactants in the extraction buffer. Vaccine 2012; 30(2): 189-94.
[http://dx.doi.org/10.1016/j.vaccine.2011.11.025] [PMID: 22107848]
[15] Vecchi S, Bufali S, Skibinski DA, O’Hagan DT, Singh M. Aluminum adjuvant dose guidelines in vaccine formulation for preclinical evaluations. J Pharm Sci 2012; 101(1): 17-20.
[http://dx.doi.org/10.1002/jps.22759] [PMID: 21918987]
[16] Gherardi RK, Coquet M, Cherin P, et al. Macrophagic myofasciitis lesions assess long-term persistence of vaccine-derived aluminium hydroxide in muscle. Brain 2001; 124(Pt 9): 1821-31.
[http://dx.doi.org/10.1093/brain/124.9.1821] [PMID: 11522584]
[17] Verdier F, Burnett R, Michelet-Habchi C, Moretto P, Fievet-Groyne F, Sauzeat E. Aluminium assay and evaluation of the local reaction at several time points after intramuscular administration of aluminium containing vaccines in the Cynomolgus monkey. Vaccine 2005; 23(11): 1359-67.
[http://dx.doi.org/10.1016/j.vaccine.2004.09.012] [PMID: 15661384]
[18] van de Loosdrecht AA, Beelen RH, Ossenkoppele GJ, Broekhoven MG, Langenhuijsen MM. A tetrazolium-based colorimetric MTT assay to quantitate human monocyte mediated cytotoxicity against leukemic cells from cell lines and patients with acute myeloid leukemia. J Immunol Methods 1994; 174(1-2): 311-20.
[http://dx.doi.org/10.1016/0022-1759(94)90034-5] [PMID: 8083535]
[19] Breck DW. Zeolite Molecular Sieves. New York: John Wiley and Sons, Inc New York 1974.
[20] Nakahira K, Haspel JA, Rathinam VA, et al. Autophagy proteins regulate innate immune responses by inhibiting the release of mitochondrial DNA mediated by the NALP3 inflammasome. Nat Immunol 2011; 12(3): 222-30.
[http://dx.doi.org/10.1038/ni.1980] [PMID: 21151103]
[21] Shimada K, Crother TR, Karlin J, et al. Oxidized mitochondrial DNA activates the NLRP3 inflammasome during apoptosis. Immunity 2012; 36(3): 401-14.
[http://dx.doi.org/10.1016/j.immuni.2012.01.009] [PMID: 22342844]
[22] Kumar V, Gill KD. Oxidative stress and mitochondrial dysfunction in aluminium neurotoxicity and its amelioration: A review. Neurotoxicology 2014; 41: 154-66.
[http://dx.doi.org/10.1016/j.neuro.2014.02.004] [PMID: 24560992]
© 2018 Danielsson et al .
This is an open access article distributed under the terms of the Creative Commons Attribution 4.0 International Public License (CC-BY 4.0), a copy of which is available at: (https://creativecommons.org/licenses/by/4.0/legalcode). This license permits unrestricted use, distribution, and reproduction in any medium, provided the original author and source are credited.