Peripheral Dendritic Cells
Peter Hellman and Håkan Eriksson
ABSTRACT: Two major populations of dendritic cells
(DCs), myeloid and plasmacytoid, can be isolated from human peripheral blood, and are distinguished by differ-ential expression of the cell surface markers CD11c and CD123. These two populations of DCs also are different in their expression of Toll-like receptor (TLRs), which are involved in their activation. To investigate the early events during activation of peripheral DCs, the cells were stimulated in vitro with ligands for TLR-4 (as in lipopoly-saccharides [LPS]) or TLR-9 (CpG-containing oligonucle-otide [CpG]). The earliest change in protein expression detected after stimulating peripheral DCs with lipopoly-saccharide (LPS) or CpG was increased production of the chemokine interleukin (IL)– 8. Enhanced production of IL-8 occurred already within 2 hours of stimulation in both myeloid dendritic cells (M-DCs) and plasmacytoid dendritic cells (P-DCs), and preceded expression of the well established activation marker CD40. Although both populations of DCs secreted IL-8 upon activation, the levels of IL-8 produced was several times higher within the M-DCs compared with the P-DCs population. Before
activation, both subsets of DCs expressed the IL-8 recep-tor type B (CD128b); but after stimulation the IL-8 receptor was down-regulated in both populations of DCs. Increased expression of MHC class II molecules is gener-ally regarded as an early activation marker of DCs. How-ever, only the P-DCs showed a significant up-regulation of MHC class II after stimulation. The M-DC population up-regulated MHC class II without any prior activation; thus care should be taken using increased expression of MHC class II molecules as an early activation marker of peripheral M-DCs after activation in vitro.
In conclusion, we propose that during activation of human DCs the production of IL-8 and loss of CD128b are the earliest signs of activation preceding both MHC class II, CD40, CD80, and CD86 expression. Human Immunology 68, 324 –333 (2007). © American Society for
Histocompatibility and Immunogenetics, 2007. Pub-lished by Elsevier Inc.
KEYWORDS: CpG; LPS; MHC expression; IL-8;
My-eloid dendritic cell; Plasmacytoid dendritic cell
ABBREVIATIONS
CpG CpG-containing oligonucleotide
DC dendritic cell
IL interleukin
LPS lipopolysaccharide M-DC myeloid dendritic cell
PAMP pathogen-associated molecular pattern P-DC plasmacytoid dendritic cell
PRR pattern recognition receptor TLR toll-like receptor
INTRODUCTION
Dendritic cells (DCs) play a central role in our immune system [1]. The DCs are the most important cell type responsible for antigen presentation, and as such they control both initiation and maintenance of adaptive immune responses, as well as induction of peripheral tolerance[2–5].
Immature DCs are normally found in peripheral blood. Upon activation these cells will up-regulate surface molecules such as MHC class II, adhesion and co-stimulatory molecules, thereby adopting a mature phenotype [6]. The DCs sample and sense their envi-ronment and pass this information on to the immune system. When pathogenic organisms or substances are encountered, the presence of non-self material will immediately be communicated to the immune system. Pathogens are primarily recognized by a large number of pathogen-associated molecular patterns (PAMPs) that are identified by conserved pattern recognition receptors (PRRs), such as the Toll-like receptors (TLRs) [7]. Several TLRs have been identified and
From the Department of Biomedical Laboratory Science, Health and Society, Malmö University, S-20506 Malmö, Sweden.
Address reprint requests to: Håkan Eriksson, Department of Biomedical Laboratory Science, Health and Society, Malmö University, S-20506 Malmö, Sweden; Fax: ⫹46406658100; E-mail: hakan.eriksson@hs. mah.se.
Received June 30, 2006; revised January 17, 2007; accepted January 17, 2007.
Human Immunology 68, 324 –333 (2007)
© American Society for Histocompatibility and Immunogenetics, 2007 0198-8859/07/$–see front matter
proven to be crititically involved in provoking matu-ration of DCs[8, 9].
In addition, TLRs are also differentially expressed on diverse DC subsets [9, 10]. For example, in human peripheral blood, the two major subpopulations of DCs, the myeloid (M-DCs) and the plasmacytoid (P-DCs) dendritic cells, differently express TLR4 and TLR9 [9, 10]. The initial phenotypic changes that occur after DC activation are important and interesting to study to gain insight in the regulation of our immune system. However, the early events after myeloid and plasmacy-toid DC activation remain relatively unknown. Here, we describe some early activation events at the protein level after in vitro stimulation of DCs using ligands to TLRs.
MATERIALS AND METHODS Cells and Reagents
Peripheral blood buffy coat preparations were obtained from the Blood Bank of the University Hospital of Mal-moe (Sweden). Blood dendritic isolation kit II (MACS), LD and MS columns were from Miltenyi Biotec, Bergisch Gladbach, Germany.
Lipopolysaccharide (LPS, from Escherichia coli O111:B4) was from Sigma (St. Louis, MO). The CpG oligodeoxynucle-otide (ODN) sequences, 5=-tcgtcgttttgtcgttttgtcgtt-3= and
5=-ggGGGACGATCGTCgggggg3=, phosphorothioate
(PTO) linkages between the bases are shown in lower case and phosphodiester linkages are shown in capital letters, were obtained from MWG-BIOTECH AG (Ebersberg, Germany). The ODNs were suspended in sterile dH20 and stored and handled under aseptic con-ditions. A Limulus Amebocyte Lysate (LAL) kit (Charles River Endosafe, Charles River Laboratories, Inc., Charles-ton, SC) was used to determine the amount of endotoxin in the CpG preparation and was shown to be, in 5g/ml solution of CpG, below detection limit of the assay (0.5 ng LPS/ml).
N-hydroxysuccinimide biotin (NHS-biotin) was pur-chased from Bio-Rad Laboratories (Richmond, CA). RPMI 1640 with L-glutamine, gentamicin, Dulbecco’s
PBS without Ca2⫹and Mg2⫹and human serum “off the clot” Type AB, were all purchased from PAA Laborato-ries (Linz, Austria). Ficoll-Paque was purchased from Amersham Pharmacia Biotech AB (Uppsala, Sweden). Fragmin was obtained from Pfizer (Täby, Sweden). Hu-man IgG (h-IgG) (GamHu-manorm) was purchased from Biovitrum AB (Stockholm, Sweden).
The BD Cytofix/Cytoperm Plus (with GolgiStop) cy-tokine intracellular staining, Cytometric Bead Array (CBA) human inflammation kit, Annexin V-FITC Apo-ptosis detection Kit I and 7-Amino-Actinomycin D (7-AAD) were all purchased from Becton Dickinson (San Diego, CA).
Isolation of Human Peripheral Blood Dendritic Cells
Peripheral blood mononuclear cells (PBMCs) were sepa-rated using peripheral blood buffy coat preparations from healthy donors by density-gradient centrifugation on Ficoll-Paque[11] with added Fragmin (20 units/ml).
Isolation of human peripheral DCs was performed by a two-step procedure using the human blood dendritic cell isolation kit II (MACS) using LD and MS columns following the manufacturer’s instructions. Briefly, PBMC were incubated with non–DC depletion cocktail (containing biotin labeled anti BDCA-1 and microbeads conjugated with monoclonal antibodies against human CD14 and CD19) in PBS containing 0.5% bovine serum albumin (BSA) and 2 mmol/L EDTA for 15 minutes at 4°C, washed and applied on a MACS column. The flow through fraction containing pre-enriched DCs, were in-cubated with DC enrichment cocktail (microbeads con-jugated with antibodies against biotin, human BDCA-4 and BDCA-3) in PBS containing 0.5% BSA and 2 mmol/L EDTA for 15 minutes at 4°C and washed once. Labeled dendritic cells were adsorbed on a MACS column and eluted after removal of the column from the mag-netic device. To achieve highest purity of the DC pop-ulation, the positively selected cells were after elution, separated over a second MACS column as a standard procedure.
In Vitro Stimulation of Isolated Peripheral Blood
Dendritic Cell Preparations
Cells were suspended in culture medium; RPMI 1640 supplemented with 10% human serum “off the clot,” Type AB, and 100 g/ml of gentamicin. Isolated den-dritic cells were incubated at a final concentration of 1⫻ 106/ml in Eppendorf tubes rotated with short rotation intervals using a Triomix-rotator (Triolab AB, Sweden) in the presence or absence of LPS 1 g/ml or CpG 5 g/ml.
The CpG sequences used in this study were 5=-tcgtcgttttgtcgttttgtcgtt-3=, which corresponds to the
B-class ODN-2006 [12] and
5=-ggGGGACGATC-GTCgggggg3=, which corresponds to the A-class ODN 2216 [13], both used in previous studies. The CpG sequence of the B-class was used throughout in this paper except in experiments inducing production of ␣-interferon where the CpG sequence of the A-class was used. All cells were incubated at 37°C in a humidified atmosphere containing 5% CO2for up to 8 hours. Stim-ulated or un-stimStim-ulated isolated dendritic cells were upon end of incubation tested for signs of necrosis or apoptosis using 7-AAD and Annexin-FITC. Briefly, ac-cording to the manufacturer’s instruction, cells, final concentration 1 ⫻ 106/ml, were washed twice in cold PBS and resuspended in 1 ⫻ binding buffer, 5 l
Annexin V-FITC and 0.5l 7-ADD of supplied solution was added. The solution was then incubated in RT in the dark for 15 minutes. Finally cells were resuspended in 500l of 1⫻ Binding buffer, final volume, and analyzed by flow cytometry.
Flow Cytometry
Monoclonal antibodies used were FITC conjugated anti-CD4 (MT30), FITC conjugated anti-CD11c (KB90) from DakoCytomation (Glostrup, Denmark). PE-conjugated anti-CD11c (B-ly6), PE-Cy5 conjugated anti-IL-8 Rec. B (CD128b) (6C6), PE-Cy5 conjugated anti-CD123 (9F5), PE-Cy5 conjugated anti-CD80 (L307.4) FITC conju-gated CD33 (HIM3-4), FITC conjuconju-gated anti-CD86 (FUN-1), FITC conjugated anti-CD40 (5C3), and its recommended isotype control FITC conjugated (MOPC-21) were all purchased from Becton Dickinson (San Diego, CA). PE conjugated anti–HLA-DR, DQ (WR18) were obtained from Serotec (Oxford, United Kingdom). FITC conjugated anti-BDCA-2 (AC144), PE conjugated anti BDCA-4 (AD5-17F6), and FITC and PE conjugated anti-CD123 (AC145) were all purchased from Miltenyi Biotec (Bergisch Gladbach, Germany). Biotin conjugated anti–IL-8 Rec. A (CD128a) (NVR1) was obtained from Novus Biologicals Inc. (Littleton, CO). Hybridomas producing antibodies against human MHC class I (Hb149) and MHC class II (Hb104) were obtained from ATCC/LGC-Promochem (Teddington, United Kingdom). After purification of the antibodies by proteinG-Sepharose, the antibodies were labeled with N-hydroxysuccinimidebiotin [14].
Streptavidin-peridinin chlorophyll-a protein conju-gate (SAV-PerCP) was purchased from Becton Dickinson (San Diego, CA).
Briefly, after incubation at 37°C or on ice, cells (1⫻ 105to 2⫻ 105) were washed with 1 ml PBS containing 0.1% (w/v) BSA (PBS-BSA), re-suspended in 100l PBS containing 0.1% (w/v) BSA and 0.1% (w/v) h-IgG (PBS-BSA-hIgG) and stained with fluorescent labeled primary antibodies for 30 minutes on ice in the dark. Finally the samples were washed with 1 ml PBS-BSA, re-suspended in 500l of PBS-BSA and analyzed by flow cytometry. After incubation with biotin labeled antibodies the cells were washed with 1 ml PBS-BSA, re-suspended in 100l of PBS-BSA-hIgG containing SAV-PerCP, final dilution 1:400 and incubated for 30 minutes on ice in the dark. Finally the samples were washed with 1 ml PBS-BSA, re-suspended in 500 l of PBS-BSA and analyzed by flow cytometry.
For intracellular staining, cells were stained for cell surface antigens, before the intracellular staining proce-dure. Briefly, cells (1 ⫻ 106/ml, final concentration) in medium or stimulated with LPS or CpG were incubated for 2, 4, 6, or 8 hours. To accumulate intracellular IL-8,
GolgiStop was added to the cell incubations in a final dilution of 1:1500 2 hours before harvesting the cells and staining with antibodies. After harvesting, the cells (1⫻ 105 to 2 ⫻ 105) were washed with PBS-BSA-hIgG, stained with fluorescent labeled antibodies against CD11c and CD123, permeabilized and fixed according to the manufacturers instructions (Becton Dickinson, San Diego, CA). Finally the cells were stained with PE con-jugated antibodies against IL-8 at a final concentration of 0.5g/ml (G265-8, Becton Dickinson) and analyzed by flow cytometry.
Intracellular IL-8 receptor type B (CD128b) was an-alyzed 4 hours after incubation with LPS or CpG 37°C. As a control, cells were incubated in medium at 37°C and at 4°C. The cells were harvested, washed, stained for surface expression of CD11c and CD123, permeabilized, and fixed. Finally the cells were stained for intracellular CD128b and analyzed by flow cytometry.
Cells were analyzed by FACScan using standard set-tings and CELLQuest version 3.3 (Becton Dickinson).
Detection of Secreted Cytokines
Cytokine content in the medium after stimulation with CpG of the class B or LPS was assayed using the Cyto-metric Bead Array (CBA) human inflammation kit from BD Pharmingen/Becton Dickinson. Briefly, cell culture (1⫻ 106/ml, final concentration) medium supernatants were collected upon end of an incubation period and stored at⫺20°C. The concentration of IL-8, IL-1, IL-6, IL-10, TNF-␣, and IL-12p70 were then determined in the supernatants (50l) according to the manufacturer’s instruction using a FACScan flow cytometer and BD Software (Becton Dickinson).
The content of ␣-interferon was determined by an enzyme-linked immunosorbent assay kit purchased from PBL Biomedical Laboratories (Piscataway, NJ). In brief, collected supernatants (100l in duplicates and stored at ⫺20°C) from CpG-conditioned cell culture medium (1⫻ 106/ml, final concentration) after 8 or 16 hours of stimulation were analyzed for ␣-interferon using a hu-man interferon-␣ enzyme linked immunosorbent assay kit according to the manufacturer’s instruction. Results were analyzed with KC-Junior Software version 1.41.4 (Bio-tek Instruments, Winooski, Vermont).
In Vitro Activation of DCs Before Isolation
From PBMCs
The PBMCs were suspended in culture medium. A 60-ml quantity of PBMCs at a final concentration of 1⫻ 107/ml was incubated 4 hours in two 50-ml tubes in the presence or absence of LPS 10 g/ml in a humidified atmosphere containing 5% CO2 for 4 hours at 37°C. During incubation the tubes were rotated using a MACS mix (Mx001, Miltenyi Biotec, Bergisch Gladbach,
Ger-many). Upon end of incubation dendritic cells were isolated using the human blood dendritic cell isolation kit II (MACS) as previously described. Expression of CD40, MHC class II and intracellular accumulation of IL-8 by the isolated DCs were then analyzed by flow cytometry. For intracellular staining, cells were washed ones with PBS containing 0.1% (w/v) BSA (PBS-BSA) and then re-suspended in culture medium containing GolgiStop (final dilution of 1:1500) and left to incubate for 2 hours at 37°C in a humidified atmosphere contain-ing 5% CO2, before intracellular staining of IL-8 was performed. Before the intracellular staining procedure cells were stained with antibodies against CD11c and CD123 to identify the DC populations.
RESULTS
As previously described, after isolating DCs from human peripheral blood, two major populations of DCs could be identified. The preparations of DCs showed on average 56⫾ 13% CD11c⫹and 36 ⫾ 10% CD123⫹dendritic cells (n⫽ 10) and these cells correspond to myeloid and plasmacytoid DC based on the differential expression of the CD markers CD11c (M-DCs) and CD123 (P-DCs)
[4]. The M-DC and the P-DC populations showed the phenotype CD4⫹, CD11⫹, CD33⫹ and CD4⫹, CD123⫹, BDCA2⫹, and BDCA4⫹, respectively. To fur-ther verify the CD123⫹ cells as plasmacytoid DC, iso-lated DCs were stimuiso-lated with CpGs of the A and B class. A clear production of␣-interferon was observed by the cells after 16 hours of stimulation (Table 1), and it should also be stressed that in accordance with Tomoki
et al.[13]a clear difference between CpG of the A and B class was observed. Very low production of␣-interferon was obtained after stimulation with CpG of the B class whereas the A class induced very low up-regulation of the co-stimulatory molecules CD40, CD80, and CD86. The two subpopulations of human peripheral DCs have been shown to differentially express TLRs impor-tant for the activation of DCs. The M-DC population express TLR-4 while the P-DCs express TLR-9 [9, 10].
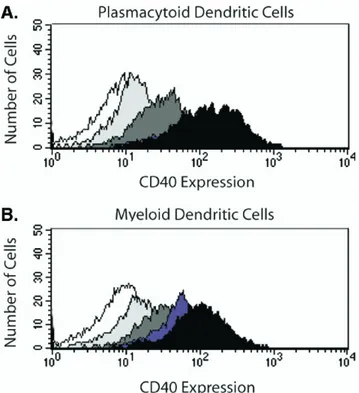
To follow the early activation in peripheral DCs, the cells were stimulated in vitro with ligands for TLR-4 (LPS) or TLR-9 (CpG). As expected, the stimulation with LPS and CpG induced up-regulation of CD40, CD86 and CD80 in myeloid and plasmacytoid DCs, respectively. Expression of CD40 was used to verify activation of the DC populations (Figures 1 and 2) and was clearly up-regulated in the P-DC population after stimulation with CpG. No or almost no up-regulation of CD40 in the P-DC population was observed with LPS (Figure 2A). Although the M-DC population has not been reported to express TLR-9 [8], there was an unexpected up-regulation of CD40 after incubation with CpG in the M-DCs population (Figure 2B) However, compared with stimulation with LPS, the up-regulation of CD40 was delayed by approximately 2 hours after incubation with CpG (Figure 2B).
Activation of peripheral DCs with LPS or CpG of the B-class also resulted in production of several cytokines
FIGURE 1 CD40 expression after in vitro activation. Iso-lated dendritic cells were stimuIso-lated in culture medium for up to 8 hours at 37°C with CpG or LPS. At indicated time periods the cells were harvest, washed, and stained with antibodies against CD123, CD11c, and CD40. CD40⫹cells were distin-guished based on a relevant isotype control after incubation at 4°C. The histograms show from the left to right isotype control (white curve), cells stimulated for 2 hours (light-gray curve), 4 hours (medium-gray curve), 6 hours (dark-gray curve) and 8 hours (black curve) in culture medium at 37°C. (A) Gated on P-DCs after CpG stimulation. (B) Gated on M-DCs after LPS stimulation. The figures show one represen-tative experiment out of three.
TABLE 1 Secretion of ␣-interferon by isolated human peripheral dendritic cells after stimulation with CpG of class A and B
Stimulation time (hours)
Concentration␣-interferon (pg/ml) Medium control CpG class A CpG class B
16 23 ⬎8,500 140
Abbreviations: CpG⫽ CpG-containing oligonucleotide.
Purified dendritic cells (DCs) (1⫻ 106/ml, final concentration) were stimu-lated with 5g CpG /ml. After 16 hours at 37°C the cells were removed and the content of␣-interferon in the medium was analyzed.
(Table 2). TNF-␣, 1b, 6, 8, 10, and IL-12p70 were analyzed and both LPS and CpG induced secretion of TNF-␣, IL-6, and high amounts of IL-8. An almost identical secretion of IL-6 was obtained by both PAMPs and compared with stimulation using CpG, stimulation with LPS resulted in higher production of IL-8. On the other hand, stimulation with CpG caused a clearly enhanced production of TNF-␣, compared with LPS (Table 2).
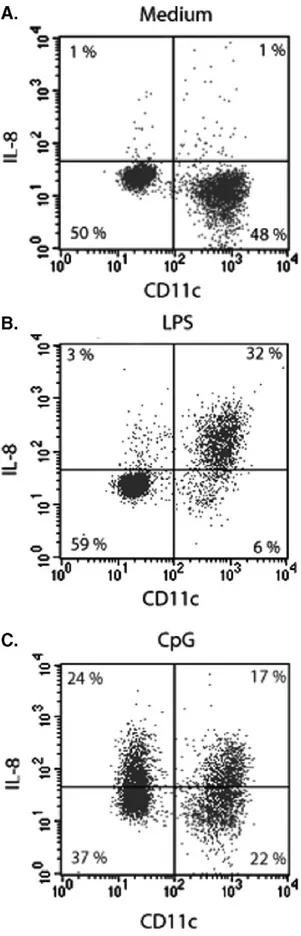
Incubation with LPS or CpG of the B-class rapidly induced production of IL-8. The cellular production of IL-8 was analyzed by intracellular staining of the DC populations. Depending on the type of stimuli used, a clear difference between the M-DCs and the P-DCs in the amount of intracellular IL-8 accumulated was ob-served (Figure 3). The kinetic production of IL-8 by the two DC populations was investigated by arresting the secretion of IL-8 using GolgiStop for 2 hours at various times after activation. The P-DCs responded only to stimulation with CpG and after 4 hours a maximal production of IL-8 was reached (Figure 4A). The M-DCs produced IL-8 after stimulation with both of LPS or CpG (Figure 4B). However, the production of IL-8 after in-cubation with CpG, was delayed by 2 hours, similar to the delayed expression of CD40 as described above ( Fig-ures 2B and4B). Almost all of the M-DCs produced IL-8 (80%–90% of the cells) after stimulation with LPS, whereas only 40%–50% of the P-DCs produced IL-8 after incubation with CpG.
Before activation with LPS or CpG both subsets of DCs weakly expressed the IL-8 receptor type B (CD128b). However, upon stimulation, the IL-8 receptor was down-regulated and became undetectable in P-DCs and mearly detectable in M-DCs (Figure 5). Intracellular staining of non-stimulated and stimulated DCs was also performed, but the IL-8 receptor could not be detected intracellular in either DC population.
Increased surface expression of MHC class II are gen-erally regarded as an early activation marker of DCs. Stimulation of the P-DCs with CpG of the B class induced a clearly higher up-regulation of MHC class II compared with stimulation by LPS (Figure 6A). Surpris-ingly, the M-DC population rapidly up-regulated MHC
FIGURE 2 CD40⫹DCs after activation. Cells incubated in culture medium were stimulated with LPS () or CpG (□) for up to 8 hours at 37°C. At 2-hour intervals samples were withdrawn, the cells were harvested, washed and stained with antibodies against CD11c, CD123, and CD40. The CD40⫹ cells were distinguished based on a relevant isotype control after incubation at 4°C. (A) Gated on P-DCs. (B) Gated on M-DCs. The figures show one representative experiment out of three.
TABLE 2 Cytokine secretion in isolated human peripheral dendritic cells after stimulation with LPS or CpG Stimulation Cytokinea (pg/ml) Time (hours) 0 2 4 6 8 LPS IL-8 7 514 2929 ⬎5000 ⬎5000 IL-6 3 5 71 142 235 TNF-␣ 3 13 61 44 38 CpG IL-8 11 131 1676 3184 3866 IL-6 5 4 63 139 174 TNF-␣ 3 195 458 473 368
Abbreviations: CpG⫽ CpG-containing oligonucleotide; LPS ⫽ lipopolysac-charide; IL⫽ interleukin; TNF ⫽ tumor necrosis factor.
Purified dendritic cells (1⫻ 106/ml, final concentration) were stimulated with 1g LPS/ml or 5 g CpG /ml. After the indicated time points at 37°C the cells were removed and the cytokine content in the medium was analyzed. The presence of TNF-␣, IL-1b, IL-6, IL-8, IL-10, and IL-12p70 were assayed. The cytokine concentration as pg/ml of one representative experiment of three is shown.
class II after conditioning in medium at 37°C. This up-regulation was almost identical to the up-regulation after stimulation with PAMPs (Figure 6B andTable 3). No up-regulation of MHC class II was observed within the P-DCs population after conditioning in medium and no significant up-regulation of MHC class I was observed in either of the DC populations (Figure 6A andTable 3). To verify our observed early activation events of DCs in the presence of other cells, PBMCs were stimulated with LPS for 4 hours before DCs were isolated using magnetic separation (MACS). DCs isolated from PBMCs stimulated with LPS showed the same activation markers as seen after stimulation of purified DCs. Briefly, up-regulation of CD40 and high level of intracellular IL-8 by the M-DC population. The expression of MHC class II was equal to what was observed on M-DCs isolated from PBMCs incubated in control medium, confirming an early MHC-II expression independent of PAMP stimu-lation by the M-DC popustimu-lation.
DISCUSSION
The early events after peripheral DC activation are not well investigated. Plasticity and crossregulation during DC maturation events makes it important to understand and then in the future be able to regulate these events so that the final effector function of the dendritic cells can be controlled. This could perhaps generate more effective vaccines for treating infectious diseases or controlling and maintaining immune tolerance, or even providing us with effective methods for treating tumours.
Stimulation of purified peripheral DCs by CpG or LPS resulted in an up-regulation of the co-stimulatory mol-ecules CD40 (Figures 1and 2), CD86 and CD80 (data not shown). CD40 was the earliest up-regulated co-stimulatory molecule and was used to verify activation of the DC populations. LPS and CpG involve pathogen-associated molecular patterns and mediate activation of DCs by binding to different TLRs expressed by the DCs. Up-regulation of co-stimulatory molecules on P-DCs after stimulation with CpG, and on M-DCs after stim-ulation with LPS was expected and correspond well with the reported expression of TLR-9 by P-DCs and TLR-4
4™™™™™™™™™™™™™™™™™™™™™™™™™™™™™™™™™™™
FIGURE 3 Production of IL-8 by activated DCs after 4 hours of stimulation. Dendritic cells (DCs) were incubated in culture medium at 37°C in the presence of LPS or CPG. After 4 hours the cells were harvest, washed and stained for the surface antigens CD123 and CD11c before intracellular stain-ing for IL-8. Two hours before harveststain-ing, GolgiStop (monen-sin) was added to the culture medium. (A) DCs in culture medium at 4°C; (B) DCs stimulated with LPS; and (C) DCs stimulated with CpG in culture medium at 37°C for 4 hours. The figures show one representative experiment out of three.by M-DCs[9, 10]. Although some reports have indicated no or low expression of TLR-4 by M-DCs [15], our results showed that there is a clear up-regulation of co-stimulatory molecules after stimulation with LPS within this population.
P-DCs has not been reported to express TLR-4[10]. In the presence of LPS, a weak up-regulation of co-stimulatory molecules by the P-DCs was obtained (Figure 2A). However, this up-regulation was similar
when the P-DCs were incubated in medium (data not shown), suggesting that LPS does not induce activation of these cells.
Similarly, M-DCs have not been shown to express TLR-9 [8]. However, the cells showed a clear up-regulation of co-stimulatory molecules after incubating the purified DC preparation with CpG (Figure 2B). Stimulation of the DCs with CpG resulted in a slower kinetic expres-sion of CD40 by the M-DC population compared with the P-DCs, and the M-DCs after stimulation with LPS (Figure 2).
Activation of P-DCs through TLR-9 induced secretion of TNF-␣ into the medium that was detected already after 2 hours of stimulation (Table 2). The M-DC population express TNF-␣ receptors of the type TNF-␣RII[16], and TNF-␣ released by activated P-DCs may stimulate and
FIGURE 4 Dendritic cells producing IL-8 after activation. Isolated DCs were incubated in culture medium in the pres-ence of CpG or LPS. At indicated time (0, 2, 4, 6, and 8 hours) after activation by CpG or LPS, produced IL-8 was accumu-lated intracellular for 2 hours by the addition of GolgiStop (monensin). The cells were then harvest and stained with antibodies against cell surface antigens, CD11c and CD123, before intracellular staining of IL-8. DCs incubated at 4°C were used as negative control. (A) P-DC after stimulation with CpG (□) or LPS () and (B) M-DC after stimulation with CpG (□) or LPS (). The figures show one representative experiment out of three.
FIGURE 5 Interleukin (IL)– 8 receptor expression by DCs. Isolated DCs were incubated in culture medium in the pres-ence or abspres-ence of CpG or LPS. After 4 hours at 37°C the cells were harvest and stained with antibodies against CD11c, CD123, and the IL-8 receptor (CD128b) or a relevant isotype control. DC populations were identified by flow cytometry and expression of the IL-8 receptor was analyzed. (A) M-DCs after incubation in medium (dark-gray curve), after stimulation with LPS (medium– dark-gray curve) and isotype control (light-gray curve). (B) P-DCs after incubation in medium (gray curve), after stimulation with CpG (medium dark-gray curve) and isotype control (light-dark-gray curve). The figures show one representative experiment out of three.
activate the M-DC population. This could explain the observed up-regulation of co-stimulatory molecules by the M-DC population after stimulation with CpG and also their slower kinetic expression of CD40.
Production of IL-8 by activated DCs has been reported earlier [17, 18], and a major release of IL-8 into the
medium was observed after stimulation of purified DCs with CpG or LPS (Table 2). Although both PAMPs induced high amounts of IL-8 in the medium, LPS induced much more IL-8 than did CpG. Intracellular staining of IL-8 revealed 80%–90% of the M-DCs to produce IL-8 after activation with LPS whereas only 40%–50% of the P-DCs produced IL-8 after activation with CpG (Figure 4). Although the preparations of DCs contained a lower amount of P-DCs compared with M-DCs , the reduced number of P-DCs producing IL-8 is probably the major explanation of the lower amount of IL-8 detected in the medium after stimulation with CpG.
Intracellular staining for IL-8 was performed on cells after accumulation of produced IL-8 during a period of 2 hours at various times after activation. The highest num-ber of DCs producing IL-8 was seen after 4 hours of activation for both M-DCs and P-DCs. However, the number of P-DCs producing IL-8 peaked after 4 hours of activation (Figure 4A), whereas the M-DCs showed a more or less steady state in the number of cells producing IL-8 already after 4 hours of activation (Figure 4B).
PAMP induced production of IL-8 showed a faster kinetic rate than the corresponding up-regulation of co-stimulatory molecules and was observed already after 2 hours of stimulation with CpG or LPS (Figure 4). TLR-4 is expressed both intracellular and in the cell
FIGURE 6 MHC class II expression by DCs after activation. Isolated DCs were incubated for up to 8 hours in culture medium () or in the presence of LPS () or CpG (□). At 2-hour intervals samples were withdrawn, washed and stained with antibodies in order to identify the P-DC and M-DC population and their MHC II expression. MHC class II ex-pression was determined as MFI values and the MFI value of nonstimulated cells incubated at 4°C was set as 100%. (A) MHC class II expression by P-DCs. (B) MHC class II expression by M-DCs. The figures show one representative experiment out of three.
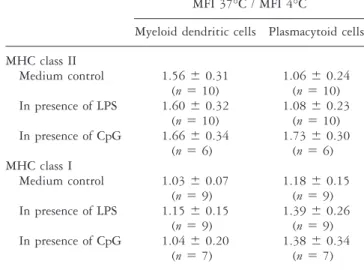
TABLE 3 Surface expression of MHC class I and II by dendritic cells after stimulation with LPS or CpG
MFI 37°C / MFI 4°C
Myeloid dendritic cells Plasmacytoid cells MHC class II Medium control 1.56⫾ 0.31 (n⫽ 10) 1.06⫾ 0.24 (n⫽ 10) In presence of LPS 1.60⫾ 0.32 (n⫽ 10) 1.08⫾ 0.23 (n⫽ 10) In presence of CpG 1.66⫾ 0.34 (n⫽ 6) 1.73⫾ 0.30 (n⫽ 6) MHC class I Medium control 1.03⫾ 0.07 (n⫽ 9) 1.18⫾ 0.15 (n⫽ 9) In presence of LPS 1.15⫾ 0.15 (n⫽ 9) 1.39⫾ 0.26 (n⫽ 9) In presence of CpG 1.04⫾ 0.20 (n⫽ 7) 1.38⫾ 0.34 (n⫽ 7)
Abbreviations: CpG⫽ CpG-containing oligonucleotide; DC ⫽ dendritic cell; LPS⫽ lipopolysaccharide; MFI ⫽ mean fluorescence intensity.
Results are presented as mean⫾ SD. Myeloid and plasmacytoid dendritic cells (DC) were identified by flow cytometry using antibodies against CD11c and CD123. Expression of MHC class I and class II by M-DCs and P-DCs were analysed and the mean fluorescence intensity (MFI) of the cell populations were determined. MFI values were determined after; incubation in medium, stimulation with 1g LPS/ml or stimulation with 5 g CpG/ml. The MFI ratios were calculated between cells incubated at 37°C for 4 hours and cells incubated in medium at 4°C.
membrane whereas TLR-9 is an intracellular receptor. The different localization of the receptors does not seem to affect the activation rate of the DC populations, be-cause the production of IL-8 and up-regulation of co-stimulatory molecules occurred with similar kinetics in both populations. A recent paper has also shown the importance of endocytosed LPS in the activation process of M-DCs [19].
The production of IL-8 by the M-DCs after stimula-tion in the presence of CpG showed a similar kinetic pattern as the up-regulation of their co-stimulatory mol-ecules. This further strengthens the hypothesis that ac-tivation of the M-DC population after incubation with CpG is mediated by TNF-␣ or any other secondary stimulatory molecule produced by activated P-DCs. However, it should be noted that although 80%–90% of the M-DCs up-regulated their expression of CD40 after incubation with CpG (Figure 2B), only about 50% of the M-DCs produced IL-8 after incubation with CpG (Figure 4B). This may well reflect a different sig-nalling pathway and response mechanism by the M-DCs after stimulation by a PAMP mediated danger signal as LPS compared with an inflammation signal such as TNF-␣[19].
To investigate a possible autocrine function of IL-8, the expression of IL-8 receptors type A and B by the DCs were investigated (Figure 5). Only a weak expression of IL-8 receptor type B (CD128b) was observed on the surface of un-stimulated DCs[18]and the expression was quickly down-regulated after stimulation with LPS or CpG. Since no up-regulation of the receptor and no intracellular receptor could be detected, our results do not support any autocrine function of IL-8 produced after activation of the DC populations. Although a conforma-tion change of the receptor after binding IL-8 resulting in the disappearance of the epitope recognized by the antibody cannot be ruled out. However, the down-regulation of surface expression of CD128b by the DCs could be used as an early sign of in vitro activation of peripheral DCs.
Up-regulation of MHC class II is generally considered as an activation marker of DCs and as expected, the P-DCs showed an increased expression of MHC class II after activation with CpG compared with incubation with LPS (Figure 6A andTable 3). The M-DC popula-tion however, up-regulated MHC class II regardless of stimulation, even by merely conditioning in medium (Figure 6B and Table 3).
P-DCs have an overall lower expression of MHC class II molecules compared with M-DCs [4] and the P-DCs have been shown to differ from all other DC subsets in their regulation of MHC class II gene expression[20]. This may have a functional consequence regarding the up-regulation of MHC class II molecules between P-DCs and
M-DCs during the first hours after PAMP mediated acti-vation, and our results clearly show that up-regulation of MHC class II cannot be used as an early marker of TLR mediated in vitro activation of peripheral M-DCs. The preparation of DCs, using positive selection with mag-netic beads, may induce some form of activation of the M-DC population. However, the antibodies used in the purification process have not been reported to have any substantial effect on the isolated cells[21]and our results agrees with a report by O’Doherty et al., showing a CD11c⫹subset of DCs, obtained by negative panning, up-regulating their MHC class II after culture in me-dium for 36 hours [22].
Incubation of PBMCs with LPS before isolation of DCs verified the early activation events observed using purified DCs. In conclusion activation of peripheral blood DCs with PAMPs induce the production of IL-8 already within 2 hours of stimulation. The production of IL-8 preceded the up-regulation of the activation marker CD40 in both M-DCs and P-DCs and was several hours before any secretion of ␣-interferon was observed into the medium by the P-DCs. Disappear-ance of the IL-8 receptor type B (CD128b) and pro-duction of IL-8 were the first changes in protein ex-pression that were observed during the activation process of peripheral DCs.
Up-regulation of MHC class II molecules in response to TLR mediated activation were only observed by the P-DC population. The M-DC population showed an up-regulation of MHC class II without any prior activa-tion, and care should be taken using increased expression of MHC class II molecules as an early in vitro activation marker of peripheral M-DCs.
REFERENCES
1. Banchereau J, Steinman RM: Dendritic cells and the control of immunity. Nature 392:245, 1998.
2. Liu Y-J, Kanzler H, Soumelis V, Gilliet M: Dendritic cell lineage, plasticity and cross-regulation. Nat Immunol 2:585, 2001.
3. Colonna M, Trinchieri G, Liu Y-J: Plasmacytoid cells in immunity. Nat Immunol 5:1219, 2004.
4. Rossi M, Young JW: Human dendritic cells: potential antigen-presenting cells at the crossroads of innate and adaptive immunity. J Immnol 175:1373, 2005.
5. Sousa CR: Dendritic cells in a mature age. Nat Rev Immunol 6:476, 2006.
6. Hart DNJ: Dendritic cells: unique leukocyte populations which control the primary immune response. Blood 90: 3245, 1997.
7. Akira S, Takeda K: Toll-like receptor signalling. Nat Rev Immunol 4:499, 2004.
8. Loré K, Betts MR, Brenchley JM, Kuruppu JK, Khojasteh S, Perfetto S, Roederer M, Seder RA, Koup RA: Toll-like receptor ligands modulate dendritic cells to augment cytomegalovirus- and HIV-1-specific T-cell responses. J Immunol 171:4320, 2003.
9. Matsumoto M, Funami K, Tanabe M, Oshiumi H, Shingai M, Seto Y, Yamamoto A, Seya T: Subcellular localization of Toll-like receptor 3 in human dendritic cells. J Immunol 171:3154, 2003.
10. Hornung V, Rothenfusser S, Britsch S, Krug A, Jahrsdörfer B, Giese T, Endres S, Hartmann G: Quantitative expres-sion of Toll-like receptor 1-10 mRNA in cellular subsets of human peripheral blood mononuclear cells and sensi-tivity to CpG oligodeoxynucleotides. J Immunol 168: 4531, 2002.
11. Böyum A: Separation of leukocytes from blood and bone marrow with special reference to factors which influence and modify sedimentation properties of hematopoietic cells. Scand J Clin Lab Invest 21 (Suppl):97, 1968. 12. Rothenfusser S, Hornung V, Ayyoub M, Britsch S,
Towarowski A, Krug A, Sarris A, Lubenow N, Speiser D, Endres S, Hartmann G: CpG-A and CpG-B oligonucleo-tides differentially enhance human peptide-specific pri-mary and memory CD8⫹ T-cell response in vitro. Blood 103:2162, 2004.
13. Tomoki I, Kanzler H, Duramad O, Cao W, Liu Y-J: Specialization, kinetics and repertoire of type 1 interferon responses by human plasmacytoid predendritic cells. Blood 107:6, 2006.
14. Harlow E, Lane D: Antibodies: A Laboratory Manual. Cold Spring Harbor, NY: Cold Spring Harbor Laboratory, 1988. p. 341.
15. Jarrossay D, Napolitani G, Colonna M, Sallusto F, Lan-zaveccchia A: Specialization and complementarity in
microbial molecule recognition by human myeloid and plasmacytoid dendritic cells. Eur J Immunol 31:3388, 2001.
16. Gomez J, Borras FE, Singh R, Rajananthanan P, English N, Knight SC, Navarrete CV: Differential up-regulation of HLA-DM, invariant chain, and CD83 on myeloid and plasmacytoid dendritic cells from peripheral blood. Tissue Antigens 63:149, 2004.
17. Almeida J, Bueno C, Alguero MC, Sanchez ML, Canizo MC, Fernandez ME, Valquero JM, Laso FJ, Escribano L, San Miguel JF, Orfao A: Extensive characterization of the immunephenotype and pattern of cytokine production by distinct subpopulations of normal human peripheral blood MHC II⫹/lineage⫺ cells. Clin Exp Immunol 118: 392, 1999.
18. Penna G, Vulcano M, Sozzani S, Adorini L: Differential behavior and chemokine production by myeloid and plas-macytoid dendritic cells. Hum Immunol 63:1164, 2002. 19. Blander JM, Medzhitov R: Toll-dependent selection of microbial antigens for presentation by dendritic cells. Nature 440:808, 2006.
20. LeibundGut-Landmann S, Waldburger J-M, Sousa CR, Acha-Orbea H, Reith W: MHC class II expression is differentially regulated in plasmacytoid and conventional dendritic cells. Nat Immunol 5:899, 2004.
21. Dzionek A, Inagaki Y, Okawa K, Nagafune J, Röck J, Sohma Y, Winkels G, Zysk M, Yamaguchi Y, Schmitz J: Plasmacytoid dendritic cells: from specific surface marker to specific cellular functions. Hum Immunol 63:1133, 2002.
22. O’Doherty U, Peng M, Gezetler S, Swiggard WJ, Betjes M, Bhardwaj N, Steinman RM: Human blood contained two subsets of dendritic cells, one immunologically ma-ture and the other immama-ture. Immunology 82:487, 1994.