Electronic Research Archive of Blekinge Institute of Technology
http://www.bth.se/fou/
This is an author produced version of a conference paper. The paper has been peer-reviewed
but may not include the final publisher proof-corrections or pagination of the proceedings.
Citation for the published Conference paper:
Title:
Author:
Conference Name:
Conference Year:
Conference Location:
Access to the published version may require subscription.
Published with permission from:
User-oriented Assessment of Classification Model Understandability
Hiva Allahyari, Niklas Lavesson
11th Scandinavian Conference on Artificial Intelligence
2011
IOS Press
User-oriented Assessment of Classification
Model Understandability
Hiva ALLAHYARI and Niklas LAVESSON1
Blekinge Institute of Technology, SE-371 79 Karlskrona, Sweden Niklas.Lavesson@bth.se
Abstract. This paper reviews methods for evaluating and analyzing the
understandability of classification models in the context of data mining. The motivation for this study is the fact that the majority of previous work on evaluation and optimization of classification models has focused on assessing or increasing the accuracy of the models and thus user-oriented properties such as comprehensibility and understandability have been largely overlooked. We conduct a quantitative survey to examine the concept of understandability from the user’s point of view. The survey results are analyzed using the analytic hierarchy process (AHP) to rank models according to their understandability. The results indicate that decision tree models are perceived as more understandable than rule-based models. Using the survey results regarding understandability of a number of models in conjunction with quantitative measurements of the complexity of the models, we are able to establish a negative correlation between the complexity and understandability of the classification models, at least for one of the two studied data sets.
Keywords. Keyword, keyword
Introduction
Data mining can be described as the nontrivial process of identifying valid, novel, potentially useful, and ultimately understandable patterns in data [1]. Data mining algorithms are commonly only evaluated in terms of predictive accuracy [2]. There are a number of other factors, such as interpretability, comprehensibility, usability, and interestingness, which could be considered during analysis and optimization [3]. The model accuracy is obviously an important criterion, but should not be considered as the only dimension by which models should be evaluated to determine their suitability for a particular task. For example, if the objective is to use the discovered knowledge in human decision-making, there are other criteria that need to be considered as well [4]. If domain experts cannot understand the generated models they may not be able to use them effectively even though they are accurate [5]. In principle, the need for understandable models arises when the model itself, not just its predictions, should be interpreted. For example, a physician needs to understand the decision process of the model before trusting it as a decision support tool for diagnosis. If we are serious about our trials to discover useful knowledge, we have to take into account understandability and associated quality attributes even if such criteria are considerably harder to
measure in a formal and objective way [2]. Even though many researchers have pointed at understandability as a basic requirement in the knowledge discovery process, we could not identify any studies devoted to measuring the understandability of classification models, which is the motivation for this study.
In this paper, we review previous work related to the aforementioned criteria and briefly describe various approaches to measuring understandability. Since properties such as understandability, comprehensibility and usability can conceptually be regarded as quality attributes [3] and moreover, since quality attributes are evaluated using quality metrics, we use these concepts to denote evaluation criteria and ways to assess such criteria. We conduct a quantitative survey in which respondents are asked to compare pairs of classification models in terms of how understandable they appear to be and we then apply the analytic hierarchy process (AHP) [6] to prioritize the classification models according to their perceived understandability. Since the concept of understandability has been associated with complexity in many previous works, we try to establish whether there is a correlation between our obtained measurements of understandability and some common complexity metrics.
1. Background
Classification represents one of the most common data mining tasks and supervised learning (SL) has been shown to be a suitable approach for classification problems. The objective of SL is to generate a function, or mapping between inputs and outputs by generalizing from training data that features example inputs and presumably correct outputs. For classification problems, this function is denoted a classifier. The generated classifier should be able to classify new, unseen instances correctly [3]. For example, an SL algorithm may be given a database consisting of patient data (inputs) and the associated diagnosis of each patient (outputs). The algorithm can then generate a classifier, which in turn can be used to diagnose new patients. An algorithm may be more or less suitable for a certain classification task depending on which quality attributes are important for the task [7]. As most of the properties we focus on in this paper are qualitative in nature and may also be regarded as quite subjective, it is important to identify characteristic aspects and distinguishable levels of conformity for such properties in order to use them for evaluation. Such an approach would of course require deep theoretical analyses of the original definitions, which could be scattered in such areas as: psychology, statistics, and information retrieval [3].
1.1. Quality Attributes
There is a list of attributes that are often relevant in the consideration of which learning model to apply to a given task, e.g.: performance, complexity, extendibility, compactness, comprehensibility, and understandability [2][3]. There are different approaches to measure each of the mostly subjective qualitative aspects (such as: usefulness, interestingness, comprehensibility and understandability). For any case, where a human user needs to make important decisions based upon discovered patterns, the comprehensibility of the patterns improves their potential usefulness, although it does not mean that comprehensibility by itself guarantees the usefulness of the patterns from the user’s point of view [2]. In some studies, simplicity together with other factors
has been identified as the basic part of interestingness, usefulness and understandability [8]. Attributes such as interpretability and explainability are often used as synonyms for comprehensibility and understandability [9] but sometimes their descriptions expose trivial differences [3]. In determining understandability, some researchers state that understanding means more than just comprehension; it also demands grasping the context. The more rational way of using a classification model is to engage the user in understanding what is going on so that they will be able to directly bring the model into effect [10]. If the user cannot understand what has been exposed, e.g., in the context of her business issues, she cannot trust or make use of the newly acquired knowledge. A few studies have been dedicated specifically to the introduction of the human cognitive processes into data mining [11][12] and it has been stated that consistency with existing knowledge is a factor that influences the comprehensibility and is one of the biases of human learners. For example, prior knowledge might tell us that most of the people are affected by a long-sightedness problem when they get older. However the data might tell us that contact lenses, in 60% of cases are not recommended for patients who have been diagnosed as shortsighted. Without such a previous piece of knowledge, we might have instead noticed that in general short-sighted patients have less chance to receive contact lenses in comparison to long-sighted patients (because many of the patients who visit an optician are older than 40). Knowing how people assimilate new knowledge and why they prefer a model consistent with prior knowledge, could help us to design better learning models [11].
1.2. Related Work
It has not been possible to identify any studies devoted to measuring the understandability of classification models, which is the motivation for the presented study. The majority of previous work has concentrated on producing accurate models as well as the assessment of other aspects such as running time and space used, with a slight consideration for ranking the value of patterns and evaluating effectiveness from a user point of view [1][13][14]. In most of the related work, model understandability and other properties such as comprehensibility and usability [15] have been stated as important attributes to consider in model evaluation and selection. However, researchers have largely overlooked the problem of measurement and analysis of these factors [1]. One reason may be that the aforementioned factors are difficult to quantify. A number of studies have been carried out in the area of human learning and categorical representation and other related subjects. Although these areas are undoubtedly relevant to data mining and the acceptability of learned models from users, there are still no general solutions presented. Moreover, a few tangible suggestions have been presented on how to measure the understandability of patterns and on how to make patterns and models more understandable [11].
2. Method
It is not enough to provide a set of metrics to assess what has really been perceived by the users of classification models. There is a need to observe which assumptions are correct and which are not, and to determine whether or not previously defined metrics are valid. Since empirical evaluations play a significant part in improving measurement
methods and we could not find any such empirical evaluation that was relevant to our study, we decided to conduct a quantitative survey to observe the users’ point of view.
2.1. Survey Design
The purpose of this survey is to establish a quantification of classification model understandability based on a user’s point of view. By generalizing from the survey results, it may be possible to identify some metrics or characteristics associated with model understandability. The questionnaire and the appendices are available for download2. The basic design of the survey is this: we generate a number of
classification models, using a set of SL algorithms and two commonly available data sets. We opted to select common algorithms that produce human readable models For each data set, we used three algorithms that produce decision trees and three that produce decision rules.
For each data set, we then generate pairs so that each model is paired with each of the remaining models. We adopt a scale of understandability, ranging from one extreme (the first model in the pair is absolutely the most understandable), via lesser grades pointing in the same direction, to increasingly positive grades toward the second model, and finally to the other extreme (the second model is absolutely the most understandable). We hand out the questionnaire concerning the first data set to one group of participants and similarly hand out the questionnaire concerning the second data set to another group of participants. We perform a systematic analysis of the survey results in order to prioritize the classification models from each data set according to their perceived understandability.
2.2. Participants
We selected 100 survey participants that were students at the Bachelor or Master’s level programs in software engineering or computer science at the School of Computing at Blekinge Institute of Technology in Sweden. 51 students were selected to work with models from data set A (see below, under Section 2.3) and 49 students were selected to work with models from data set B. The purpose of selecting participants with this particular background in addition to their availability was their presumed familiarity with models such as: trees, rules, and graphs. Since the students were presumably familiar with these types of presentation, they could focus on the actual comparison of the models rather than on the structure of the models themselves.
2.3. Data and Material
The featured data sets were downloaded from the UCI machine-learning repository3. Data set A (Contact Lenses) contains statistical data concerning patients and contact lens prescriptions. Data set B (Labor) contains statistical data regarding labor workers and job conditions. The Contact Lenses data set contains three classes: the patient should be fitted either with hard contact lenses, soft contact lenses, or no contact lenses at all. The data set contains four attributes: age, spectacle prescription, tear production-rate, and astigmatism. The Labor data set contains two classes: work is categorized
2 Survey questionnaire, http://www.bth.se/com/nla.nsf/sidor/resources 3 UCI machine learning repository, http://archive.ics.uci.edu/ml/
either as good or bad. The categorization is based on 16 attributes regarding, e.g.: salary, vacation, accessibility to health services, educational allowance, and other related attributes.
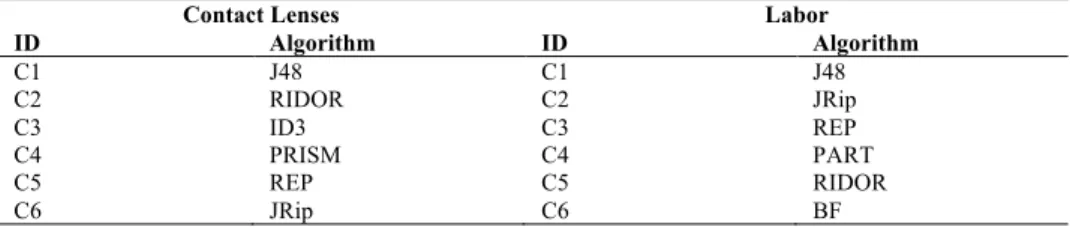
We applied six SL algorithms to obtain six classifiers to prioritize for each data set. We opted to use the SL algorithm implementations available from the Weka machine-learning workbench [38]. Although we would have preferred to apply the same algorithms on both data sets, it was not possible: some algorithms are restricted in terms of which type of data can be processed (e.g., numeric or nominal input attributes). Thus, four of the applied algorithms are identical for both data sets (J48, REP, JRip, and RIDOR) and the other two are chosen on the basis of the requirements of the particular data sets but we tried to apply the two closest matches (ID3 and PRISM for Contact Lenses; BF and PART for Labor). Out of the six algorithms for each data set, three generate decision rules and the remaining algorithms generate decision trees. The algorithms have been assigned random identification numbers as described in Table 1.
Table 1. Algorithm Identification Number Assignment.
Contact Lenses Labor
ID Algorithm ID Algorithm C1 J48 C1 J48 C2 RIDOR C2 JRip C3 ID3 C3 REP C4 PRISM C4 PART C5 REP C5 RIDOR C6 JRip C6 BF
In order to make the generated Weka models readable, we transformed the decision trees from ASCII text format to a graphical presentation of arrows and text boxes. For decision rules, minor changes were applied, such as: adding space and parentheses. In some cases we added conjunctions such as “otherwise”. All conducted changes were applied equally for all provided rules or all decision trees. For the Contact Lenses data set, medical terms, such as: Myopic, Hypermetrope, and Presbyopic were replaced with known synonyms as Short-sighted, Long-sighted and Old-sighted.
2.4. Data Analysis
We use the analytical hierarchy process (AHP) [6] to create a prioritized list of the generated classifiers on the basis of the subjective quantification of understandability, obtained from the survey. AHP establishes priorities among the elements of the hierarchy by making judgments based on pairwise comparisons of the elements. A numerical weight is derived for each element of the hierarchy, allowing various elements to be compared to one another in a rational and consistent way. This capability in addition to the ability of measuring the assessment errors, distinguishes AHP from other decision-making techniques [17].
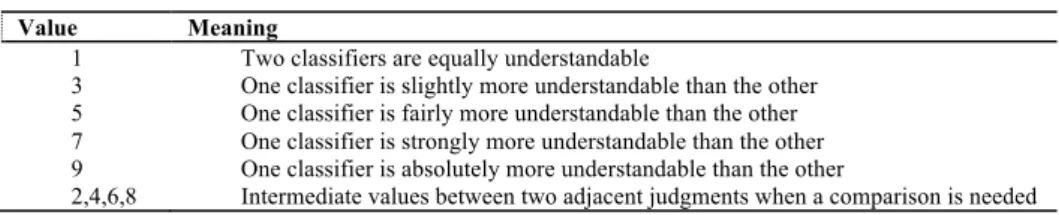
Using AHP requires following a number of steps: the first step is to set up the n classifiers as rows and columns of an n × n matrix (i.e., a 6 × 6 matrix for each data set). The second step is to perform pairwise comparisons of classifiers according to the measurement scale. The fundamental scale used for this purpose is shown in Table 2. For each pair of classifiers (starting with C1 and C2, for example) we insert their determined relative score in the position (C1, C2). In position (C2, C1), we insert the mutual value, and in all positions in the main crossways, we insert a value of 1. For a matrix of order n, n (n-1)/2 comparisons are required. Thus, in this example, 16
pairwise comparisons are required. The third step is to use averaging over the normalized columns to estimate the eigenvalues of the matrix (which represent the criterion distribution) [6]. The approach is to first calculate the sum of the n columns in the comparison matrix and then divide each number in the matrix by the sum of the related column, and finally to calculate the sums of each row.
Table 2. Scale for Pairwise Comparison Value Meaning
1 Two classifiers are equally understandable
3 One classifier is slightly more understandable than the other 5 One classifier is fairly more understandable than the other 7 One classifier is strongly more understandable than the other 9 One classifier is absolutely more understandable than the other
2,4,6,8 Intermediate values between two adjacent judgments when a comparison is needed
The next step is to normalize the sum of the rows by dividing each row sum with the number of classifiers. The result of this calculation is referred to as the priority vector and it is an estimation of the eigenvalues of the matrix. We assign each classifier its relative value based on the estimated eigenvalues. If we were able to accurately determine the relative value of all classifiers, the eigenvalues would be perfectly consistent. The redundancy of the pairwise comparisons makes AHP much less responsive to assessment errors in comparison to some alternative methods [17]. In addition, however, the method allows us to measure assessment errors by calculating the consistency index (CI) of the comparison matrix, and then calculating the consistency ratio. CI is a first indicator of the accuracy of the pairwise comparisons and is calculated as:
!" =!!"#− ! ! − 1
The !!"# represents the maximum principal eigenvalue of the comparison matrix. The
closer the value of !!"# is to the number of classifiers, the smaller the critical error and
accordingly, the more consistent the result. To calculate !!"#, we first need to multiply the comparison matrix by the priority vector. In our case, !!"# is equal to 6.54 and
thus CI is equal to 0.10. In order to evaluate if the resulting consistency index is acceptable, we need to calculate the consistency ratio (CR). The consistency indices of the randomly generated mutual matrices from the scale 1 to 9 are denoted the random index (RI) and CR is the ratio of CI to RI [6]. The allied RIs for matrices of order n are presented in Table 3. The first row shows the order of the matrix, and the second the corresponding RI value. According to Table 3, the RI for matrices of order 6 is 1.24. Thus, the consistency ratio in our case is: CR= CI/RI=0.10/1.24=0.08. As a general rule, a consistency ratio of 0.10 or less is considered acceptable. This means that the result for our example is in the ideal range.
Table 3. Consistency ratios.
1 2 3 4 5 6 7 8 9 10
3. Results
We summarize the results obtained through the survey and the subsequent AHP analysis in Table 4. In this table, we have also included classifier complexity measures, as calculated in a study on exception directed acyclic graphs (EDAGs) [18] in order to compare understandability with complexity. The correlation between understandability and complexity as well as between understandability and classifier size (i.e., the number of rules or the number of nodes) for Contact Lenses are both equal to -0.163, which means that we cannot establish any correlation. The correlation between understandability and complexity on Labor is equal to -0.932. The obtained result demonstrates a strong negative correlation between the complexity metric and understandability. Likewise, the correlation between understandability and classifier size for Labor is equal to -0.942, which means that there are strong negative correlations between understandability and both complexity and classifier size. Interestingly, this means that the larger or more complex a model was, participants seem to feel it was more understandable. According to Saaty [17], as a general rule, a consistency ratio of 0.10 or less is considered acceptable, however Saaty states that in practice consistency ratios exceeding 0.10 occurs frequently. In a random control of the results from the survey, with regard to the inconsistency in the priority order, the CRs equal to 0.25, 0.53 and 0.72 demonstrated no inconsistency regarding priority order selection (out of 15 pairwise comparisons). Thus, we decided not to exclude any CRs higher than 0.10 from our survey results. Another interesting result is that trees were generally thought of as more understandable than rules and this result holds for both data sets.
4. Discussion
The obtained results for the two data sets are quite different in that there was a correlation between understandability and complexity and classifier size for the Labor data set whereas, for the Contact Lenses data set, no correlation between understandability and the other properties could be established.
Participants seemed to think that the larger and more complex models were more understandable (at least for the Labor data set). Perhaps, in the studied case, the more complex classifiers provided a more detailed information of the classification task, and involved more attributes that could help in understanding the decision making process in comparison to what was the case for smaller or simpler classifiers.
This result shows that the assumption that users think that simpler models are more understandable, is not always true. Regarding the type of the provided information in the Labor data set, participants probably had a relatively good level of background knowledge about the context (in comparison to what was the case for Contact Lenses). Consistency with background knowledge has been associated with understandability in previous studies. Due to this reason we thus suggest that the larger or more complex classifiers did not diminish the understanding of the decision process, but may have even increased it through providing more steps and including more attributes for each decision step. However, the provided data in Contact lenses fit in to a more specific area of knowledge (e.g., healthcare or medicine). Many participants have probably never heard about any of the medical terms if they have not experience an eyesight deficiency problem.
Since the learning algorithms used for generating the classifiers were not identical for the two data sets, we are unable to draw any general conclusions regarding specific learning algorithms and their respective understandability. However, there are some notable assumptions to consider: if we observe the three least popular classifiers for the two data sets (with regard to understandability), we can see that the JRip has the highest score while RIDOR has the lowest score. Consider the Labor data set where there is a high correlation between complexity and understandability. For this particular case, JRip and PART share the same complexity score but JRip outperforms PART with regard to understandability. This indicates that the difference in scores is related to the representation of the rules. RIDOR is the least complex model but, as mentioned earlier, it has the lowest understandability score. A possible explanation is that, unlike the other decision rules, RIDOR makes use of exception clauses rather than conditional clauses. Probably, users are less likely to understand counterintuitive rule declarations of RIDOR. However, subsequent studies involving additional data sets, perhaps in conjunction with more open-ended questions that focus on why different choices were made, could give us better explanations to these and similar results.
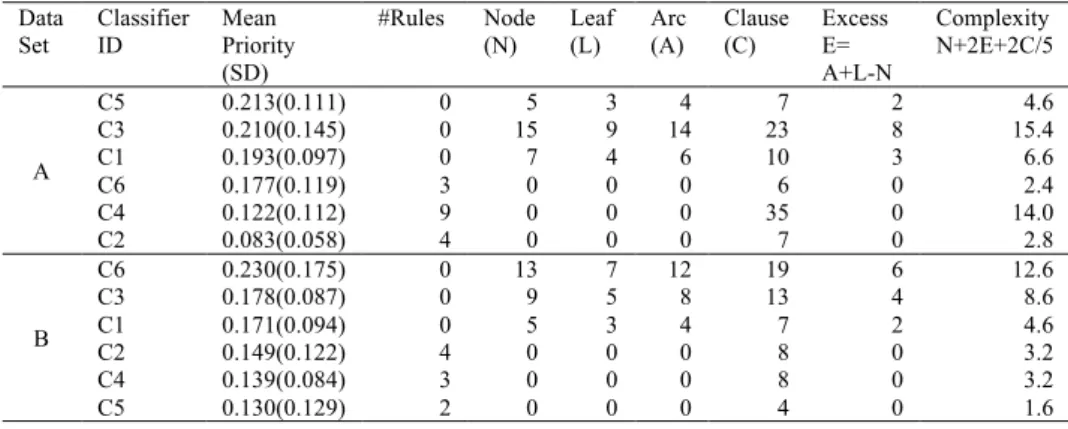
Table 4. AHP results ordered on mean priority for the Contact Lenses data set (A) and the Labor data set (B).
The #Rules and Node (N) columns represent estimates of classifier size for rules and trees, respectively while the last column represent an estimate of model complexity.
Data Set Classifier ID Mean Priority (SD) #Rules Node (N) Leaf (L) Arc (A) Clause (C) Excess E= A+L-N Complexity N+2E+2C/5 A C5 0.213(0.111) 0 5 3 4 7 2 4.6 C3 0.210(0.145) 0 15 9 14 23 8 15.4 C1 0.193(0.097) 0 7 4 6 10 3 6.6 C6 0.177(0.119) 3 0 0 0 6 0 2.4 C4 0.122(0.112) 9 0 0 0 35 0 14.0 C2 0.083(0.058) 4 0 0 0 7 0 2.8 B C6 0.230(0.175) 0 13 7 12 19 6 12.6 C3 0.178(0.087) 0 9 5 8 13 4 8.6 C1 0.171(0.094) 0 5 3 4 7 2 4.6 C2 0.149(0.122) 4 0 0 0 8 0 3.2 C4 0.139(0.084) 3 0 0 0 8 0 3.2 C5 0.130(0.129) 2 0 0 0 4 0 1.6
5. Conclusions and Future Work
Data mining algorithms are increasingly used in real world applications. There are a number of quality attributes that are used to evaluate the efficiency of the generated models but some other attributes (such as: understandability) are often disregarded in evaluation process. The goal of this study was to examine the possible assumptions behind measuring model understandability and to identify quantitative or qualitative attributes associated with understandability. We conducted a quantitative survey to establish model understandability from a user’s point of view. The results indicate that users seem to think that decision trees are generally more understandable than rule-based models. The results also suggest that, at least in some cases, understandability is negatively correlated with the complexity, or the size, of a model. This implies that, the more complex or large a model is, the more understandable it is. A plausible reason for this counterintuitive result is that the studied data sets are fairly small and thus even the
most complex or large models are not exceedingly difficult to grasp. What this also means is that the simpler models were too simple, that is, they did not provide the users with enough information to understand the problem or the decision process.
Certainly, there is a need to conduct additional work to learn how to evaluate more qualitative aspects of data mining models. For future work, we aim to expand our study to include a larger population of participants, as well as more algorithms and data sets. We also hope to compare different approaches for prioritizing models. There are, for example, alternative pairwise comparison methods to evaluate and, additionally, it is possible to make use of alternative methods to pairwise comparison in itself.
References
[1] U. Fayyad, G. Piatetsky-Shapiro, and P. Smyth, 1996, “From Data mining to knowledge discovery in database,” AI Magazine, vol. 17, pp.37-54.
[2] A. A. Freitas, 2006, “Are we really discovering ''interesting'' knowledge from data?” Expert Update (the
BCS-SGAI Magazine), vol. 9, pp.41-47
[3] N. Lavesson, 2008, “On the Metric-based Approach to Supervised Concept Learning” Blekinge Institute of Technology, Sweden.
[4] C. Giraud-Carrier, 1998, “Beyond Predictive Accuracy: What?” Proc. ECML’98 Workshop
Notes-Upgrading Learning to the Meta-Level: Model Selection and Data transformation, pp.78-85.
[5] U. M. Fayyad. 1996. “Data Mining and Knowledge Discovery: Making Sense Out of Data”. IEEE
Intelligent Systems, vol. 11, pp. 20-25.
[6] T. L. Saaty, 1980, “The Analytic Hierarchy Process: Planning, Priority Setting, Resource Allocation,”
McGraw-Hill.
[7] N. Lavesson & P. Davidsson, 2007, “An Analysis of Approaches to Evaluate Learning Algorithms and Classifiers”, International Journal of Intelligent Information & Database Systems, vol.1, pp. 37–52. [8] U. M. Fayyad, G. Piatetsky-Shapiro, P. Smyth, 1996, “Knowledge Discovery and Data Mining:
Towards a Unifying Framework”. Proc. Knowledge Discovery and Data Mining (KDD-96), pp. 82-88. [9] G. Nakhaeizadeh & A. Schnabl, 1997, “Development of Multicriteria Metrics for Evaluation of Data
mining Algorithms”, Proc. Fourth International Conference on Knowledge Discovery and Data Mining, pp. 37-42, AAAI Press.
[10] K. Thearling, B. Becker, D. DeCoste, B. Mawby, M. Pilote, and D. Sommerfield, 2001, “Visualizing Data Mining Models”, Information Visualization in Data Mining and Knowledge Discovery, Morgan Kaufman.
[11] M. Pazzani, 2000, “Knowledge Discovery from Data?” IEEE Intelligent Systems, vol. 2000, pp. 10-13. [12] M. Pazzani, 1991, “Influence of prior Knowledge on Concept Acquisition: Experimental and
Computational Results”, Journal of Experimental Psychology Learning Memory and Cognition, vol. 17, pp. 416-432.
[13] K. McGarry, 2005, “A survey of interestingness measures for knowledge discovery,” Knowledge
Engineering Review, vol. 20, pp. 39-61.
[14] S.Y. Chen and X. Liu, 2004, “The contribution of data mining to information science,” Journal of
Information Science, vol. 30, pp. 550-558.
[15] G. Piatetsky-Shapiro, W. J. Frawley, C. J. Matheus, 1992, “Knowledge Discovery in Databases: An Overview”, Al Magazine, vol. 13, AAAI press.
[16] G. Holmes, A. Donkin, & I. H. Witten, 1994, “Weka: A Machine Learning Workbench,” Proc. Second
Australia and New Zealand Conference on Intelligent Information Systems, Brisbane, Australia.
[17] J. Karlsson & K. Ryan, 1997, “Cost-Value Approach for Prioritizing Requirements,” IEEE Software
Archive, vol. 14, pp. 67-74.
[18] B. Gaines, 1996, “Transforming Rules and Trees into Comprehensible Knowledge Structures,”