Analyzing network monitoring systems and
objects for a telecommunications company
Thesis for the Degree of Bachelor Program in Computer Network Engineering 180 credits
Mälardalen University
School of Innovation, Design and Engineering
Västerås, Sweden
Student: David Arvedal
Student mail:
dal13001@student.mdh.se
Examiner: Mats Björkman
Mälardalen University, Västerås, Sweden
Supervisors: Robert Suurna
Mälardalen University, Västerås, Sweden
Company Supervisor: Per Hubinette
Cellip AB, Stockholm, Sweden
Abstract
The goal with this thesis work has been to identify what a telecommunications company should monitor and to find a network monitoring system that can monitor these identified objects on two different platforms: Windows and Linux. The network monitoring system has been implemented in a telecommunications company’s environment and this thesis presents how the system monitors their environment. The subject for this thesis work is within network monitoring. The problem formulation has been answered by conducting a literature study and by testing network monitoring systems’ features in a lab environment. The sources used in the literature study consists of scientific articles and other articles found on the web. The lab environment consisted of virtual machines that runs Linux or Windows as an operating system.
The purpose of the work was to enlighten Cellip in what objects they should monitor and to help the company to monitor them by implementing a network monitoring system. Cellip is a
telecommunications company that provides IP-telephony services through Session Initiation Protocol. The limits of this thesis work are based on what their environment supports in terms of monitoring. Cellip’s environment consists of Linux and Windows servers, Cisco switches and firewalls, and Sonus Session Border Controllers.
In summary, the result of this thesis gives the reader information about what a
telecommunications company with a similar environment to Cellip should monitor, what three systems that can monitor these objects, which of the three systems that has most automatized features and finally how the chosen system Datadog monitors and presents the objects. Some of the objects that are important to monitor is: memory, disk storage, latency, packet loss. In
conclusion, this thesis presents a monitoring baseline for telecommunication companies with a similar environment to Cellip.
Foreword
The layout of the report is designed with a “Result” section that provides information to answer the problem formulations. This design is chosen because the work’s execution itself is a result. I have read information and compiled all necessary information from various sources into the thesis, hence the layout of this report where “Results” answers all the problems stated in the “1.2 Problem Formulation”. This is in difference to reports that have a layout where the work’s
execution is first presented and then the result from this execution is presented. In my opinion the latter design option for the thesis is less pedagogic to the reader and the “work’s execution” was deemed unnecessary for this thesis work and could not have lead the reader to the results in a better way. The information from the literature study either scientifically states that objects is of value to monitor or if it’s not of value to monitor. If it is not of value, why present it in this report?
Table of Contents
1. Introduction ... 1
1.1 Cellip ... 1
1.2 Problem Formulation ... 2
1.3 Limitations... 2
1.4 Ethics ... 2
2. Background ... 2
2.1 Network Monitoring Objects... 2
2.2 Network Monitoring System ... 3
2.3 Voice over Internet Protocol ... 3
2.3.1 Session Initiation Protocol... 3
2.3.2 Measuring VoIP ... 3
2.4 Simple Network Management Protocol ... 4
2.4.1 Object Identifiers ... 5
2.4.2 Management Information Base ... 5
2.4.3 SNMP communities and commands ... 5
2.5 Windows Management Instrumentation ... 5
2.6 Unix shell and commands ... 6
2.7 The environment... 6
3. Related research ... 8
3.1 State of the Practice ... 8
4. Method... 9
5. Results ... 10
5.1 Network monitoring objects ... 10
5.1.1 Standard network monitoring objects for servers... 10
5.1.2 VoIP network monitoring objects ... 11
5.1.3 Network monitoring objects for network devices ... 12
5.2 Network Monitoring Systems ... 15
5.3 Monitoring the network monitoring objects ... 17
5.4 Graphical network map ... 17
5.5 Implementation ... 18
6. Discussion ... 19
7. Conclusion ... 20
7.1 Future work ... 21
8. References ... 22
9. Appendix ... 26
9.1 Datadog pictures ... 26
9.1.1 Firewall dashboard ... 26
9.1.2 SBC dashboard ... 27
9.1.3 Linux server dashboard ... 28
9.1.4 Disks dashboard ... 29
9.1.5 Host map... 30
9.1.6 Alarms ... 31
9.1.7 Sip stats... 32
9.2 Sip stats datadog custom script ... 33
1. Introduction
Network monitoring provides key features to a business’s success. With monitoring, a company can detect slow or failing systems in their company’s structure. An active monitoring system is set with actions to take when a monitored object presents different values, that is, to let network administrators know when something is failing. By monitoring crucial services/devices a company can make sure that they deliver the expected quality of their services. Telecommunication
companies deliver voice services that demand certain aspects of communication to make voice calls perceptible and of high quality. By monitoring these aspects, the company will know when their services fail and will also be provided a quicker way to act on these failures. Not only does monitoring provide a quicker way to act on failing services/devices, it’s also a great tool for security and troubleshooting. Monitoring can be applied to check anything from users currently logged in, to changes made on a server [1] [2].
The need of monitoring is easy to confirm, but how to deploy network monitoring systems and what to monitor are two challenging aspects that needs to be addressed. This thesis work seeks to address these problems in forms of: a literature study, testing in a lab environment and an actual implementation at a telecommunications company.
The target group for this thesis are telecommunication companies that use Session Initiation Protocol (SIP) to deliver Voice over Internet Protocol (VoIP) services. VoIP is the technology in which voice travels over IP networks whereas SIP is a protocol that provides a procedure to deliver VoIP. Earlier works in the same area focuses on VoIP and does not consider the
environment which VoIP is built upon, e.g. server/network device capacities. This thesis work will address the baseline monitoring problems of the whole environment and not just VoIP specific monitors. This work is unique in the way VoIP monitoring is combined with monitoring the underlying structure which VoIP is built upon. After reading this thesis you will be provided with results which gives a baseline as of what to monitor in a business’ environment that uses SIP, but also which monitoring system that can fulfill the monitoring needs.
1.1 Cellip
Cellip is a company that provides telecommunication solutions to companies and homes. Some of the services they provide are: IP-telephony, LYNC and skype-for-business (the two later services are tools to connect with work – sharing files, video conferencing, chat and calls). As of now the company have two different monitoring solutions for their server-platforms. Today the company is using a Nagios system to monitor their Linux platforms and a SCOM system to monitor their Windows platforms. Cellip is looking for a single monitoring system that can monitor both server-platforms and at the same time upgrade their outdated Nagios system. In addition to finding a single monitoring system for both server-platforms, the company wants an evaluation to be done on which objects that are important to monitor on their servers. The actions to be taken on these objects is already decided. Currently, the actions taken on objects that report failing data are to send a notification in form of a text message and a mail to the one(s) responsible of
monitoring the servers - the same notification system will be used for the new monitoring system as well.
1.2 Problem Formulation
The problems to be addressed for this thesis work are the following:
• Identify which objects that are essential to monitor for an IP-telephony service company (Cellip AB).
• Find a network monitoring system that provides features to monitor both Linux and Windows servers. The monitoring system must be able to monitor all the identified objects.
• How to monitor these objects with the network monitoring system
• Implement and configure a network monitoring system for Cellip AB, either physically at the company’s site or on a server within the cloud provided by a server hosting company. • Create a graphical map over the servers’ health statuses.
1.3 Limitations
The addressed problems in the problem formulation is limited to what Cellip’s environment supports in terms of monitoring. The implementation of monitors on the VoIP specific objects is very limited due to time constraints of this thesis work. The chosen network monitoring system is limited to only gather data from the Linux environment, this is due to the cost of each deployed agent; the total monetary sum of monitoring the windows environment via agents is too
expensive. The windows platforms can be monitored via agentless monitoring but requires too much time to fit in this thesis work in the scheduled course time.
1.4 Ethics
As this thesis work is done at a company, some matters of discretion need to be stated. For security reasons, names of servers, IP addresses and SNMP (Simple Network Management Protocol) strings will be replaced to not give eventual “hackers” a gateway in to Cellip’s network via this thesis work. Also, the software version running on the different servers will not be
included in this thesis. A more general term will be used to address the servers such as their role-name, e.g.: DB (database) server, Web server, Phone server. This is all accordingly to an
agreement between the author of this thesis and the company Cellip AB.
2. Background
This section presents information needed to understand the content of this thesis work. The section includes information that defines what Network Monitoring Objects and Network
Monitoring Systems are. Additionally, Voice over Internet Protocol with focus on Session Initiation Protocol is introduced with relevant factors and how to measure voice quality. Simple Network Management Protocol architecture is shortly presented along with ways to monitor Linux platforms and Windows platforms.
2.1 Network Monitoring Objects
There are many things that can be monitored in today’s networks. These monitored ‘things’ can be hardware that tells us their status in different values such as voltages, temperatures and ampere. There are also many other things that can be monitored: memory usage, disk usage and traffic flows are some examples. “Network Monitoring Objects” is a definition used to define all the different thing(s) that can be monitored. The idea comes from SNMP which defines ‘things to monitor’ as object identifiers (more information about SNMP later in this section). The idea is partly derived from ‘SNMP object identifiers’ to generalize a term that can be used to define objects that needs to be monitored by using any means available and not just with SNMP.
Network monitoring objects deliver metric(s) that tells us what is going on with a certain object by presenting values. The metrics from an ‘network interface monitoring object’ could be the
type of metric, it could deliver many several types of metrics, e.g. an interface could also have a packet loss-metric.
In difference to SNMP, an object identifier is one metric from an ‘object’ (using the definitions just stated) instead of one object that can deliver metric(s) [3].
2.2 Network Monitoring System
Throughout this thesis, “Network Monitoring System” is used as a definition to define the
monitoring system that receives data by monitoring the network. This system presents the data in some type of ‘user interface’ - most commonly a web interface. Network, a broad definition as it is means in this case the different servers and network devices that exists in an environment.
2.3 Voice over Internet Protocol
VoIP demands various aspects of communication to provide good voice quality. There are three important things to consider when it comes to delivering good perceptive voice calls with VoIP. These three are: Latency (i), jitter (ii) and packet loss (iii). Latency (i) is the time it takes for a roundtrip of a packet in a communication. The latency starts to affect VoIP communication when it surpasses 150 ms (milliseconds). Jitter (ii) is the variations of delay in roundtrips for packets. Packet loss (iii) is what it implies - when packets are lost in a session (e.g. discarded packets or dropped packets). One percentage of packet loss is enough to degrade communication quality for VoIP. Also, an important note is that codecs play a part in how tolerant the traffic is to packet loss [4]. Two primary functions of codecs within VoIP is to encode/decode voice signals and to
compress voice data to lessen the load on the network
2.3.1 Session Initiation Protocol
Cellip is using Session Initiation Protocol (SIP) to deliver their VoIP services. This protocol is based on Session Description Protocol (SDP). SIP is text-based and has its heritage from two legacy protocols: Hypertext Transfer Protocol (HTTP) and Simple Mail Transfer Protocol (SMTP). SIP is mainly used to start and terminate a media session with either unicast or multicast
messages. SIP transactions start with a request, and for every SIP request there are one or more response types depending on the request. There are 13 different request types and 6 different response types [5].
The standardized SIP architecture consists of different roles. The body of the SIP architecture contains the following:
• User Agent Client (UAC), another term used is “SIP client”. • User Agent Server (UAS), another term used is “SIP server”.
The UAC can be a phone or a gateway whereas the phone is an end user’s terminal and the gateway is translating functions between SIP clients. To these gateways Private Branch Exchange (PBX) systems and Public Switched Telephone Network (PSTN) networks can be connected. The UAS can either be a proxy server, redirect server or a registrar server. The purpose of a proxy server in a SIP architecture is to forward, authenticate, route SIP messages and to add reliable request retransmission and network access control functionalities. The redirect server provides information about the next hop. The registrar server is used for different registrations provided by registration requests [6].
2.3.2 Measuring VoIP
Mean Opinion Score (MOS) were first introduced in 1996 by ITU-T Recommendation P.800 and is the first procedure to measure quality of speech. MOS values range from 1 to 5 where 1 is bad quality and 5 is excellent quality. With this procedure, the quality of speech can be benchmarked by using the MOS values [7].
The most common methods to measure voice quality automatically is by using PSQM, PESQ or PAMS algorithms. All these algorithms require a copy of the transmitted traffic to compute the influence caused by a system. This influence are factors that affect the quality of the voice call. The algorithms calculate the quality of the voice traffic and represents the quality as MOS [8].
Perceptual Analysis Measurement System (PAMS) is a model used to evaluate perceived speech quality. This model uses objective methods to benchmark speech quality in end-to-end networks. PAMS is the first model to use objective methods to benchmark speech quality in end-to-end networks. The values for quality of speech is represented in two ways with PAMS: (i) listening effort and (ii) listening quality [7].
Perceptual Speech Quality Measure (PSQM) was developed by KPN Research and was specified in the ITU-T Recommendation P.861. This model defines methods to benchmark the speech quality of a codec. This model is primarily used in environments that use speech compression, digital speech interpolation and packet-based transmission. [7] The problem with PSQM is that the reference signal and the test signal is not a constant in VoIP networks and have problem in benchmarking quality of speech with varying delays [9].
To better comprehend the evaluation of two-way speech quality which PSQM had difficulties in doing, the ITU-T introduced the Perceptual Evaluation of Speech Quality (PESQ) in P.862. This method combines features of PAMS and PSQM to better evaluate the factors that affect voice quality in IP networks. The drawback with measuring speech quality with PESQ is that it is not designed to measure streaming applications. [10] The PESQ method became a recognized standard in measuring speech quality stated in the article “Quality of Service in VoIP
Communication” from 2004 [7].
Both PSQM and PESQ benchmarks the speech quality in their own values. However, these values can be converted to MOS-values and used as a standard for benchmarking. PSQM value “6.5”, which is the highest value represents the lowest MOS value “1”. The lowest PSQM value “0” represents the highest MOS value “5”. For PESQ the highest value, “4.5” represents the highest MOS value “5”. The lowest value for PSQM “1” also represents the lowest MOS value “1” [7].
With PESQ being the standard to measure speech quality in 2004, a more up-to-date approach to measure speech quality is by using the extension of the Real-Time Control Protocol (RTCP) called RTCP-XR (where XR stands for Extended Reports) [10]. This approach is defined in RFC3611 [11] and was released in 2003. The RTCP-XR reports all the values that VoIP is dependent on to deliver high quality calls, these include: Jitter, delay, packet bursts and packet loss. New layers have been built up on how to monitor VoIP traffic by using RTCP. The RFC6035 defines a SIP event package that enables VoIP quality measurements for SIP sessions. This RFC gives information about how the RTCP-XR and the call information from SIP sessions can be collected by a third party called the “collector” [12].
The ITU-T Recommendation G.107 presents the R-Factor to calculate the MOS from metrics such as packet loss, latency and jitter. The R-Factor is used to quickly assess the quality of speech for VoIP calls in a network. The scores ranges typically from 50 to 90 where a higher score is better. These R-Factor scores can be converted to MOS and used to benchmark quality of speech. A value of 90 in R-Factor represents a MOS value of 4.3 [13]. Many VoIP-monitoring applications use the R-Factor to monitor VoIP quality of speech. The way these different
applications gather the metrics to use in the R-Factor algorithm differs from each other.
2.4 Simple Network Management Protocol
To monitor most hardware and software today, the SNMP architecture is used. SNMP have become a standard way of monitoring any device from nearly any manufacturer. The architecture of SNMP contains two components; (i) Network Management Station (NMS) and an (ii) agent.
The NMS (i) is software that collects metrics from the network. Most commonly, the NMS is polling the various devices on the network for information. These NMS will present the data in a ‘user interface’ but can also send email or SMS text alerts when the monitored objects fail. The agent (ii) collects information and sends it to the NMS when polled. Agents can also act on itself and send information without being polled when an error occurs [14].
NOTE: The abbreviation NMS used in this thesis means “Network Monitoring System” as a general term. I.e. the system that receives ALL the metrics; from SNMP and from other sources. It is only in this section “Simple Network Management Protocol” that it means “Network
Management Station” to explain the SNMP architecture.
2.4.1 Object Identifiers
To poll data from various devices the SNMP architecture introduced means of doing so by using object identifiers. The Object Identifiers (OID) are different ‘things’ that can be monitored [15]. An example of an OID is the ifDescr. This object presents a: “textual string containing information about the interface. This string should include the name of the manufacturer, the product name and the version of the hardware interface” [16]. A device usually has many OIDs that can be used to gather data. All SNMP objects are numbered, meaning that OIDs have a number associated with them. ifDescr that was mentioned earlier have an ‘identifier value’ of “1.3.6.1.2.1.2.2.1.2”. The SNMP identifiers are numbered. The top level of ifDescr is “1” (also called ISO), and that level is the first level after root. The next level in the structure is “3” (i.e 1.3) which is called ORG. Each number is associated with a category. Most OIDs will always start on “1.3.6.1”
[15]
.2.4.2 Management Information Base
To manage OIDs, different databases exists that compiles these objects. These databases are called Management Information Base (MIB) [17]. A manufacturer may create their own OIDs to monitor their devices. These OIDs are put into a MIB and can be used to gather specific data. For an example, the OID “1.3.6.1.4.1.311” is Microsoft’s MIB - the last value “.311” is Microsoft’s database for their specific OIDs. Any number added after “1.3.6.1.4.1.311.” belongs to Microsoft’s MIB [15].
2.4.3 SNMP communities and commands
Communities within SNMP are like passwords - and like all passwords; it’s used to authorize users to access a certain media. In SNMP, these communities are used to authorize SNMP requests. These requests occur when a NMS is polling an agent for information. There are various SNMP requests a NMS can make towards an agent depending on what information that needs to be gathered [15]. Using Net-SNMP these different commands can be used to request information from an agent:
• Snmpwalk - Returns values from the defined level. This request will walk through all the OIDs and indexes at the specified level. Commonly used to see what indexes exist on an OID.
• Snmptranslate - Used to learn about the MIB tree, translates OID to numeric form. • Snmpget - Returns value from a specific OID.
• Snmpgetnext - Retrieves values from unknown indexed data, usually the next OID from the retrieved value
• Snmptable - Displays the OID table.
• Snmpset - Performs a write operand on an OID
• Snmptrap - Used to send and receive traps, but also to act upon them [18].
Net-SNMP is a suite of applications used to implement the various versions of SNMP [19].
2.5 Windows Management Instrumentation
Windows platforms have built in support for Windows Management Instrumentation (WMI). This infrastructure is used for management data and operations on Windows platforms. The use for
WMI is wide and can be used in all Windows-based applications [20]. WMI is the standard technology to gather management information in a Windows enterprise environment. To obtain data from WMI, a programming language needs to be used. Many different languages can be used to obtain this data, some of them are: Windows Powershell, Visual Basic, C++, C#, .NET [21].
2.6 Unix shell and commands
To communicate with the computer, human to computer, a shell is usually the method to do so in Linux environments. The shell is based on GNU and brings utilities that can be used to do useful things on a Linux machine. GNU is a collection of computer software and an operating system. As penguintutor explains: “Without the kernel the computer cannot run and without the GNU utilities it can't do anything useful which is why the operating system is sometimes called
GNU/Linux”. There are various shells out there that are included in most Linux distributions. The most common shells are:
• Bourne shell • Korn shell • C shell • Bash shell • Tcsh
These different shells provide utilities to work with the Linux machine. Many of these utilities are commands that can be used to gather information about specific things in the machine [22]. From a monitoring perspective, some of these commands provides valuable information about the machine’s health. Some common commands used to gather information about the machine are: top, htop, iostat and ifstat - all of which provides useful information about the system [23].
2.7 The environment
To understand what the environment consists of, the environment is analyzed under this section. By analyzing the environment one will understand what crucial factors exists to monitor. The environment this thesis addresses is built on two different server platforms; Windows and Linux. On these two platforms Cellip uses different services to provide solutions to their customers. The Linux servers consists of:
• SIP-servers (PortaSip) • Application servers • Utility servers • Transcoding servers • Response group servers • Database servers • Web servers • Backup servers • Asterisk servers
In summary, the servers that handle VoIP mainly are the SIP-servers. To add extra functionality to VoIP sessions these SIP-servers connects to other servers in a chain of communication. If a caller got a service which includes Interactive Voice Response, the SIP-servers will route the communication to the asterisk servers. To transcode between codec(s) the VoIP traffic routes through to the transcoding servers. Each of these servers is used and added into the
communication flow based on what functionalities the call has.
The Windows servers consists of:
• Domain Name System (DNS), Certificate Authority (CA), Domain Controller (DC) servers • Lync Edge servers
• Lync Mediation servers • Lync Frontend servers • Lync Backend servers • Lync Director server • Database servers
• Backup servers
• Reverse Proxy servers
The Lync servers have distinct roles in the Lync server role architecture. This architecture is based on Microsoft services and their LYNC-VoIP solution is built accordingly to their setup. The network devices within the environment consists of layer 2 switches, layer 3 firewalls and Session Border Controllers (SBC). The layer 2 switches and layer 3 firewalls are Cisco devices. The Session Border Controllers (SBC) are of the Sonus brand.
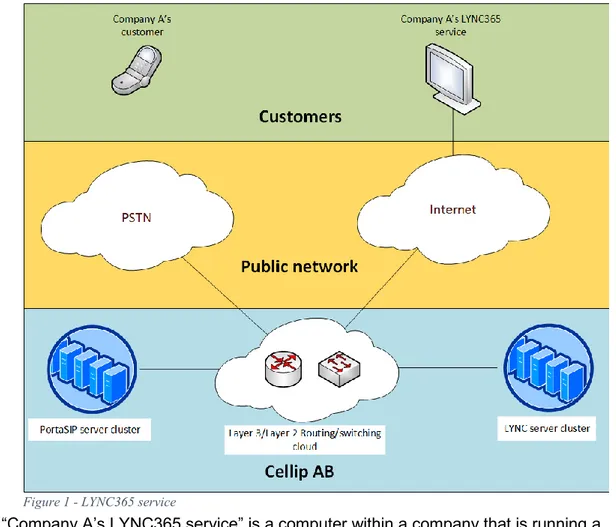
When Cellip is delivering a service to a company it acts as an Internet Telephony Service Provider (ITSP). Figure 1, is an overview of the segments that are included for VoIP traffic when Cellip is providing services to their customers. A service has been chosen for this figure to ease the understanding of the environment. The service used is called “LYNC365”.
• “Company A’s LYNC365 service” is a computer within a company that is running a LYNC365 application. With this service, the user can make and receive calls via the application instead of using a physically installed phone.
• “Company A’s customer” is a customer to the company. This customer makes a telephone call to the company’s telephone number.
• “PSTN” is the different networks that telephone traffic is being routed through before arriving at Cellip.
• “Internet” is the different networks that IP traffic is being routed through.
• “Layer 2/Layer 3 Routing/switching cloud” is various devices that switches and routes traffic at the different layers (MAC/IP). These devices are layer 2 switches and layer 3 firewalls.
• “PortaSIP server cluster” is different SIP servers within the SIP server role architecture. • “LYNC server cluster” is different LYNC servers within the LYNC server role architecture.
In a scenario where a call is made from the customer to the company, the traffic arrives at the PSTN which routes the traffic to Cellips environment. Before arriving at Cellip, the traffic has been added with various information, encapsulating the traffic into IP-packets. Arriving at Cellips
environment, the call’s traffic is routed from the switching and routing cloud to the PortaSip server cluster. From there the servers route the traffic back to the switching and routing cloud which in turn routes the traffic to the LYNC server cluster. The LYNC server cluster handles the packet and transform it into suitable headers for LYNC service communication and sends it out to the Internet and onto the Company A’s LYNC365 service. The user within the company receives the call within the application and the communication between the two can begin.
Another scenario is when the company is making a call to the customer. In this scenario, the communication flow is reversed. When the call is being initiated by a user at the company with a LYNC365 service, the traffic is firstly sent to the Internet cloud. At the Internet cloud the traffic is being routed throughout the cloud and eventually ends up at Cellip’s environment. When the traffic arrives to Cellip it firstly arrives at the routing and switching cloud which in turn routes the traffic to the LYNC server cluster. Within the LYNC cluster the specific LYNC headers are being de-encapsulated and routed towards the PortaSip server cluster (via the routing and switching cloud again). At this stage, the traffic is being processed by various SIP servers and then sent on to the routing and switching cloud to finally be routed to the PSTN. From the PSTN the traffic is being routed to the customer’s telephone and the communication can start.
3. Related research
Voice over Internet Protocol (VoIP) communications are dependent on many different elements to provide high quality calls. Companies that deliver VoIP services are challenged by network
environments to deliver services accordingly to their Service-Level Agreements (SLA) [24]. The importance of monitoring comes into play when a business need to ensure that their VoIP services follow their corresponding SLAs. By monitoring crucial information such as jitter, packet loss, delays, speech quality and codec types, a network manager within the company can understand the environment better and change certain parameters to keep the quality of the company’s services [25].
The companies that provides VoIP solutions are usually built on a multi-platform-environment. Today, there’s a big range of different platforms that can be used to deliver services; Linux, Windows, Cisco and Juniper operating systems are some of these varying platforms. Solutions companies provide to customers are either built on a singular platform or on various platforms to deliver a final product. The differing platforms brings a challenge to network monitoring systems if the certain system must monitor all the platforms. For instance, WMI can be used to monitor Windows platforms [21] and SNMP can be used to monitor Linux [26]. These protocols are completely different from each other and brings complexity to a monitoring system.
3.1 State of the Practice
The work within this thesis are subject to various research areas. Network monitoring as a subject is large and there are many factors to be considered even though the unique monitoring perspective of this thesis is on VoIP. As the previous content of this thesis presented, the common divider for VoIP and all its protocols are that it’s heavily reliant on “good” network
communication, and that’s where most research is joined and give importance to monitoring VoIP networks. Some academic journals [25] [27] [8] show that a certain way of monitor deployment is efficient in each environment. There is no standard best practice for the subject since VoIP environments differ from each other, partly through differentiating platforms and protocols. However, there are academic journals and models developed by organizations and individuals that brings forth valuable elements to consider for this thesis work. Valuable research information that some of these academic journals brings to the table will be presented below. An important note is that research in the area are based on some state of the practice, in form of models provided by organizations.
There are various protocols that can be used to deliver VoIP. Some of the protocols that supports VoIP are H.323, SIP and Media Gateway Control Protocol (MGCP) [28]. However, SIP is one of
the most common protocols in the VoIP environment [29]. The organizations that unifies VoIP development are the Internet Engineering Task Force (IETF) and International
Telecommunications Union (ITU). IETF is a community that standardizes protocols and ITU is an organization that coordinate global telecom networks and services [28].
ITU-T G.107 – The E-Model [13] provides a computational model for use in transmission planning. This model introduces means to estimate the Mean Opinion Score (MOS), which is used to rate the quality of calls. The result from using this model is the calculation of something defined as the “R-factor”, which is used to measure voice quality ranging from 0 to 100, where 0 is the worst case. It is the R-factor that determines the MOS. This rating system is divided into five different scores: 5 equals “excellent” quality, 4 is equal to “good”, 3 equal to “fair”, 2 is equal to “poor” and 1 equal to “bad” [27]. The R-factor is calculated from different parameters. These parameters consist of: (i) basic signal-to-noise ratio, (ii) a combination of all impairments which occur simultaneously with the voice signal, (iii) impairments caused by delay and equipment impairment factor, (iiii) impairments caused by low bit-rate codecs. Each of these parameters have their own factors which defines them. The academic journal “Voice over IP performance” [27] uses a reduction of the ITU’T’s E-Model to estimate conversational voice quality with monitoring. The same article discusses the trade-offs on placing the monitors within a VoIP gateway or by placing the monitors within the transport path, based on the work’s result.
The academic journal “A framework for network quality monitoring in the VoIP environment” [25] proposes a monitoring architecture based on Management Information Base (MIB) and Simple Network Management Protocol (SNMP) to gather information from MIBs. The journal discusses the value of using MIBs to monitor VoIP environments. IETF have developed specified MIBs to manage equipment, protocols, services and applications.
The journal gives information about agents that could be used to monitor and analyze speech quality in VoIP networks. Additionally, the work presents a “Related studies” section which is based on state of the art. Within this section different works are being presented, some of these works are: (i) a work that presents certain tools used to generate and monitor data to evaluate VoIP networks, (ii) a survey about available MIBs for VoIP management, (iii) a tool used to gather speech quality information such as packet loss, delay, MOS and the R-factor. The (iii) tool is based on the Real-Time Protocol (RTP) to gather the information. Many of these works uses the standardized ITU-T E-model to build their own research.
4. Method
To address the problem formulation within this thesis a simple work structure will be used. The structure contains the following:
1. Collect and evaluate information about which objects that are necessary to monitor for a telecommunications company.
2. Collect and evaluate information about different monitoring systems that support different server platforms (Windows and Linux)
a. If a monitoring system that supports multi server-platforms is found, it will be configured to monitor the necessary objects found in the (1) section of this framework.
b. If no fitting monitoring system is found for the multi-server-platform environment, a monitoring system will be configured to monitor the necessary objects found in the (1) section of this work structure for their different Linux servers. This also means that the company’s current Nagios system will be replaced or used as an option to their new monitoring system.
3. After finding a monitoring system, the way it can monitor these objects will be presented. 4. Lastly, a graphical network map will be created as an “add-on” to the monitoring system
for a more graphical view of the servers’ health status. In case of (b) the graphical network map will only be implemented to show the Linux servers’ health.
It is important to note that this work structure firstly contains a research and secondly an
browsing scientific databases and websites. To get information about the environment at Cellip’s site, employees at Cellip will be addressed for their respective area of expertise. The information gathered within the research will be used for the implementation.
5. Results
This section contains three subsections: (i) a literature study on network monitoring objects, (ii) an evaluation on network monitoring systems and an implementation (iii) will be presented to show the results of the implemented network monitoring system in Cellip’s environment. The work presented in this section is the results from the various stated methods in “3. Method”. The information stated under this section answers the problem formulation under “1.2 Problem Formulation”.
5.1 Network monitoring objects
This section of the report provides information about various important objects to monitor for Cellip’s environment. The research about network monitoring objects are divided into three sections to structure the data from various literature studies.
5.1.1 Standard network monitoring objects for servers
To ensure some baseline quality in an environment, there are some standard objects that should be monitored regardless of the services run on the servers that are being monitored. The
standard objects to be monitored in Windows addressed by Tom Carpenter in his article “Monitor Windows Server with Performance Counters” [30] does not differ much from the Linux
perspective of standard network monitoring objects which Drago Z Kamenov addresses in his article “Key Linux Performance Metrics” [31]. The information from both articles are merged within this section to find network monitoring objects for the Linux and Windows platforms. The website “serverdensity” have presented a valuable article called “Monitoring physical server
environments” [32] which addresses monitoring aspects on physical server deployment. The article gives insight into some essential network monitoring objects in addition to the previous articles. The baseline network monitoring objects that are presented in this section are for both Windows and Linux platforms.
When a server is degrading, the first place to look is the CPU performance. With modern
systems, most CPUs have several cores. One important object to monitor is the CPU utilization. There are many different values of interest in CPU performance. When deploying network
monitoring in an environment the number of objects easily add up and overloads the system with information, making the environment harder to monitor. The network monitoring object “CPU” should be a summary of these different CPU values [30] [31].
Memory usage is another standard network monitoring object that should be monitored. One can monitor the usage of memory to avoid virtual memory bottlenecks. If a Windows or Linux platform runs out of physical memory, the system will use a process to create virtual memory. This virtual memory uses disk access instead of RAM access, which creates a bottleneck. The RAM usage of a system is therefore an important network monitoring object [30] [31].
The hard disk has three important objects to monitor. These are disk queue length, disk bytes/sec (read/write) and free space. The disk queue length reveals if a disk can keep up to the demand of running processes. Disk bytes per second reveals how fast other services can use or write data to the disk. The free space is important to monitor, allowing room to plan for expansion [30]. Network interface(s) is another standard object to monitor to understand the load on networks and servers, network attacks, failure in load balance, trends of data usage and much more. The input and output data stream of the interface(s) are a standard network monitoring object [30].
The hardware within the server are heat sensitive and high temperature can destroy or create bottlenecks for the server and is therefore a standard network monitoring object. Another important physical related factor to monitor are the voltages within the server’s motherboard. A correlated object to temperature is fan speed, which is also a standard network monitoring object [32].
5.1.2 VoIP network monitoring objects
Much of the information in this section uses information from the article “A framework for network quality monitoring in the VoIP environment”. The article presents valuable information about crucial factors that should be monitored [25].
As stated by the “ITU-T Rec. G.114” [33], an end-to-end VoIP call should not exceed a 150 ms delay to be qualified as a good voice call. There are some factors to be considered upon the mention of delay in VoIP sessions. One must first state what end-to-end communication really is in this case. End-to-end communication in VoIP is when voice waves hit the receptioning
microphone and gets delivered to the end node’s/nodes’ (unicast or multicast) speakers. Delay in VoIP environments contain three factors. These three factors are: Network delay,
encoding/decoding delay and de-jitter buffer delay [25].
These three factors are of importance for successful VoIP sessions and should therefore be divided into three network monitoring objects: Network delay object, encoding/decoding delay object and de-jitter buffer delay object.
The codec type used in a SIP session is of importance to monitor. Two primary functions of codecs within VoIP is to encode/decode voice signals and to compress voice data to lessen the load on the network. There are a variety of different codecs that can be used to compress voice data. Codecs differ from each other in ways they handle packet loss, voice quality, bitrate, and delay. In a case where a VoIP session is using a codec that fails to meet the environment, the call quality could provide a low MOS score. By monitoring the codec type used for a session an administrator can intervene in cases where the wrong type is used and change to a more suitable codec for that environment. The codec type is therefore an important network monitoring object for VoIP communication. The “codec type” monitoring object has a relation to the delay [25], and should similarly to Network delay object, encoding/decoding delay object and de-jitter buffer delay object be placed among them to monitor the delay.
Jitter being one of the factors that affects VoIP perceived quality, makes it an important network monitoring object. De-jitter buffer is an important function for VoIP sessions to counter some of the jitter occurrence in a session. However, should this de-jitter buffer be filled to its maximum size, it will start dropping packets and immediately affect the perceived voice quality [25]. Therefore, the de-jitter buffer size should be a network monitoring object.
In connection to the de-jitter buffer, packet loss is an important network monitoring object to monitor. Packet loss should never exceed 5% during the entire session. If packet loss exceeds 5% speech quality issues may occur. Packet loss in its nature is bursty, meaning that during a call the average packet loss could be within the acceptable margin, but still cause quality issues [25]. The time frame for the occurrence of packet loss plays a valuable role in monitoring this object. By monitoring the packet loss regularly in a session, the issue that comes with the packet loss’ burstiness (in monitoring perspective) can be countered, e.g. if 25 packets in a VoIP session are lost in total and does not exceed the 5% mark, it might still affect the perceived quality if all these 25 packets are lost in a sequence.
Delivering VoIP services with SIP gives the possibility to monitor valuable SIP specific information. The SIP response codes give valuable information about the VoIP sessions. All response codes contain three integers. The following response codes have been selected to be of importance to become network monitoring objects:
• Response code 481. This response occurs when the server receives an existing call and the server has no state or information about the call. [34]
• Response code 500. The server cannot process the request.
• Response code 502. If this message is sent as a response code, the request is having problems with the other network and cannot be processed.
• Response code 504. This occurs when there’s a timeout to the other network where the gateway connects or if there’s a failure in accessing resources outside the SIP network. • Response code 513. This occurs when the request size is too large. [35]
• Response code 606. The UAS denies the desired session. [36]
5.1.3 Network monitoring objects for network devices
As Cellip’s environment has layer 2 switches, layer 3 firewalls and SBCs that needs to be monitored, this section will contain information on network monitoring objects for these devices. To determine what should be monitored, the supply must be analyzed. The layer 3 firewalls support monitoring via NetFlow, SNMP and logs. The switches only support monitoring via SNMP and logs. To monitor the SBCs, SNMP must be used as it only supports SNMP to send monitor-data over the network. This section will only include network monitoring objects provided by SNMP for these devices.
To see what objects that are available for monitoring the MIBs must be browsed on the different network devices. To check what OIDs that exist on the Cisco devices the command ‘show snmp oid’ can be used. By running this show-command in Cisco Command-line Interface (CLI) all available OIDs will be shown. Running this command on one of the firewalls gives an output of 972 different OIDs.
To browse these different MIBs a MIB-browser can be used or a website that posts the contents of these MIBs. Devices can have support for different MIBs and all its OIDs but lacking hardware to gather values from the OIDs, e.g. a device can have SNMP support to gather temperature values on the device but have no sensor to collect the temperature data.
The following MIBs were browsed to find the network monitoring objects for the switches and firewalls: • RFC1213-mib2 [37] • Cisco-firewall-mib [38] • Cisco-remote-access-monitor-mib [39] • Altiga-ssl-stats-mib [40] • Cisco-ipsec-flow-monitor-mib [41] • Cisco-process-mib [42] • Cisco-memory-pool-mib [43]
To find the network monitoring objects for the SBCs the following MIBs were browsed: • RFC1213-mib2 [37]
• Host-resources-mib [44] • UCD-snmp-mib [45] • UX_callstats [46]
5.1.3.1 Cisco switches network monitoring objects
The MIBs used to find the network monitoring objects for the switches are: RFC1213-mib2, Cisco-process-mib and Cisco-memory-pool-mib. Note that the OID value and the metric value are two different things. The metric value is the return-value from using a SNMP request such as ‘snmpget’. The ‘snmpget’ can use the OID-value as an address to poll the correct metric-value from the device.
To monitor the amount of incoming traffic on interfaces the OID ifInOctets can be used. This OID returns values of how many octets that have been received on an interface and refers to the number of bits that have been received; one octet represents 8 bits. This OID is index based,
each index represents an interface on the device. OID value for this object is: “1.3.6.1.2.1.2.2.1.10”. The object resides in the MIB: RFC1213-mib2 [37].
IfOutOctets is an OID that can be used to monitor the amount of transmitted octets on an
interface. Similar to the IfInOctets, this OID uses octets as its value. This OID is also index based; each index represents an interface. OID value for this object is: “1.3.6.1.2.1.2.2.1.16”. The object resides in the MIB: RFC1213-mib2 [37].
To monitor errors on different interfaces the OIDs ifInErrors and ifOutErrors can be used. Both OIDs store the amount of errored packets in the indexed interface. ifInErrors stores the amount of inbound errored packets and ifOutErrors stores the amount of outbound errored packets. Both are also index based for the interfaces. OID value for ifInErrors is: “1.3.6.1.2.1.2.2.1.14”. OID value for ifOutErrors is: “1.3.6.1.2.1.2.2.1.20”. The objects reside in the MIB: RFC1213-mib2 [37].
The two OIDs ifInDiscards and ifOutDiscards can be used to monitor the discarded packets on an interface. These two OIDs store the discarded packets that occurred even though no errors were detected. ifInDiscards stores the inbound packets and ifOutDiscards stores the outbound packets. As the other OIDs presented thus far in this section, these two OIDs are index based for correlation with the interfaces. OID value for ifInDiscards is: “1.3.6.1.2.1.2.2.1.13”. OID value for ifOutDiscards is: “1.3.6.1.2.1.2.2.1.19”. The objects reside in the MIB: RFC1213-mib2 [37].
The CPU load can be monitored with the cpmCPUTotal5min. This OID stores the CPU load average over 5 minute intervals. The value is a decimal value of the percentage on the load that the CPU has. This OID is also index based; each index represents the cores used on the
devices. OID value for cpmCPUTotal5min is: “1.3.6.1.4.1.9.9.109.1.1.1.1.5”. The object resides in the MIB: Cisco-process-mib [42].
To monitor the amount of free memory on the device ciscoMemoryPoolFree can be used. This OID stores the amount of free memory in bytes. OID value for ciscoMemoryPoolFree is:
“1.3.6.1.4.1.9.9.48.1.1.1.6”. The object resides in the MIB: Cisco-memory-pool-mib [43].
In correlation with the free memory network monitoring object the used memory on the device can be monitored with ciscoMemoryPoolUsed. This OID stores the amount of used memory in bytes. OID value for ciscoMemoryPoolUsed is: “1.3.6.1.4.1.9.9.48.1.1.1.5”. The object resides in the MIB: Cisco-memory-pool-mib [43].
5.1.3.2 Cisco firewalls network monitoring objects
The MIBs used to find the network monitoring objects for the firewalls are: RFC1213-mib2, Cisco-firewall-mib, Cisco-remote-access-monitor-mib, Altiga-ssl-stats-mib, Cisco-ipsec-flow-monitor-mib, Cisco-process-mib and Cisco-memory-pool-mib.
All of the objects under the section “Cisco switches network monitoring switches” are also supported on the firewalls and should be considered as network monitoring objects. These objects are:
• ifInOctets and ifOutOctets • ifInErrors and ifOutErrors • ifInDiscards and ifOutDiscards • cpmCPUTotal5min
• ciscoMemoryPoolFree • ciscoMemoryPoolUsed
In addition to these objects more have been added due to the amount of support the firewalls have compared to the switches. The firewalls within Cellip’s environment also have additional features compared to the switches. The objects ifInDiscards and ifOutDiscards play an important role on Cisco firewalls because access lists discards packets that are not allowed, i.e. the deny rule on an access list discards packets that matches the deny rule [47]. The additional network
monitoring objects on the firewalls are within the “Cisco-firewall-mib”, “Cisco-remote-access-monitor-mib”, “Altiga-ssl-stats-mib” and “Cisco-ipsec-flow-monitor-mib”.
To monitor how many active connections that exist on the firewall the OID
cfwConnectionStatValue can be used. This OID stores the current active connections on the device. OID value for cfwConnectionStatValue is: “1.3.6.1.4.1.9.9.147.1.2.2.2.1.5”. The object resides in the MIB: “Cisco-firewall-mib” [38].
To monitor the amount of VPN sessions used by Cellip employees (Cisco AnyConnect) the OID crasSVCNumSessions can be used. This OID stores the current active AnyConnect sessions to the device. OID value for crasSVCNumSessions is: “1.3.6.1.4.1.9.9.392.1.3.35.0”. The object resides in the MIB: “Cisco-remote-access-monitor-mib” [39].
To monitor the amount of total SSL sessions on the device the OID alSslStatsActiveSessions can be used. This OID stores the number of active SSL sessions. OID value for
alSslStatsActiveSessions is: “1.3.6.1.4.1.3076.2.1.2.26.1.2”. The object resides in the MIB: “Altiga-ssl-stats-mib” [40].
Another VPN object to monitor is the current lan-to-lan (or site-to-site sessions). The OID crasL2LNumSessions stores the amount of active lan-to-lan VPN sessions. The OID value for crasL2LNumSessions is: “1.3.6.1.4.1.9.9.392.1.3.29.0”. The object resides in the MIB: “Cisco-remote-access-monitor-mib” [39].
To monitor the amount of IPsec tunnels the OID cipSecGlobalActiveTunnels can be used. This OID stores the current amount of active IPsec tunnels on the device. The OID value for
cipSecGlobalActiveTunnels is: “1.3.6.1.4.1.9.9.171.1.3.1.1.0”. The object resides in the MIB: “Cisco-ipsec-flow-monitor-mib” [41].
5.1.3.3 Sonus SBC network monitoring objects
The Session Border Controllers differ from the regular switches and firewalls when it comes to features. These devices are used for their VoIP features and supports different type of MIBs to monitor these specific features. These devices at Cellip’s site had many deprecated OIDs that could have been of value to monitor. The Session Border Controllers supports the “RFC1213-mib2” and the previously mentioned objects should be considered as network monitoring objects for the SBCs. These objects are:
• ifInOctets and ifOutOctets • ifInErrors and ifOutErrors • ifInDiscards and ifOutDiscards
To monitor the processes currently running on the SBCs the OID hrSystemProcesses can be used. This OID stores the current running processes on the device. The OID value for
hrSystemProcesses is: “1.3.6.1.2.1.25.1.6.0”. This object resides in the MIB: “Host-resources-mib” [44].
To monitor the CPU load on the device the OID hrProcessorLoad can be used. This OID stores the average percentage of time over the last minute that the CPU was not idle. The OID value for hrProcessorLoad is: “1.3.6.1.2.1.25.3.3.1.2”. This object resides in the MIB: “Host-resources-mib” [44].
To monitor the memory usage on the device two different OIDs can be used in correlation with each other. To get the total memory that the device has the OID memTotalReal can be used. This OID stores “the total amount of physical memory installed on the host”. To monitor the total amount of free memory on the device the OID memTotalFree can be used. This OID stores “the total amount of free memory or available for use on this host”. The OID value for memTotalReal
is: “1.3.6.1.4.1.2021.4.5” and the value for memTotalFree is: “1.3.6.1.4.1.2021.4.11”. Both of these objects resides in the MIB: “UCD-snmp-mib” [45].
There are five available OIDs on the SBCs to monitor the VoIP traffic. These objects only store statistical information about calls, not the speech of quality. The statistical information that these objects store is: current active calls, the total amount of calls processed, the total amount of calls refused, the total amount of errored calls and lastly the total amount of blocked calls. These OIDs resides in the MIB: “UX_callstats”. These OIDs uses indexes where each index represents a port. The OID uxPTCurrentCalls stores the amount of current calls active on the device. The OID value for uxPTCurrentCalls is: “1.3.6.1.4.1.177.15.1.5.1.2.1.5”.
uxPTTotalCalls is an oid that can be used to monitor the total amount of processed calls on the device. This object stores the total amount of processed calls. The OID value for uxPTTotalCalls is: “1.3.6.1.4.1.177.15.1.5.1.2.1.6”.
To monitor the refused calls on the device the OID uxPTRefusedCalls can be used. This OID stores the number of refused calls on a port. The OID value for uxPTRefusedCalls is:
“1.3.6.1.4.1.177.15.1.5.1.2.1.8”.
The OID uxPTErroredCalls stores the number of errored calls on a port. By using this OID the amount of errored calls can be monitored. The OID value for uxPTErroredCalls is:
“1.3.6.1.4.1.177.15.1.5.1.2.1.9”.
The last object, uxPTBlockedCalls can be used to monitor the amount of blocked calls on the device. This object stores the amount of blocked calls. The OID value for uxPTBlockedCalls is: “1.3.6.1.4.1.177.15.1.5.1.2.1.18” [46].
5.2 Network Monitoring Systems
When considering the supply of network monitoring systems today, one will discover that there is a broad supply to pick from. To sort out some of the network monitoring systems a list of
requirements was created and used:
• If the NMS is open source, the NMS should provide a community that can be used to contact other users.
• If the NMS is not open source, the NMS must provide a support/customer service. Preferably the NMS should provide a community or documentation in addition to the support.
• The NMS should be able to gather metrics from all these different network monitoring objects discovered in the literature study.
• The NMS should have multi-platform support. Both Linux and Windows should be able to provide metrics to the system.
• As there are many common network monitoring objects used throughout the monitoring arena, the NMS should have ready configurations/scripts for these objects - making the configuration/scripting overhead for the administrator lesser.
• The NMS must support encryption/authentication of data sent between the NMS and all the devices it monitors.
• The NMS needs to support custom scripts to gather metrics. Also, the NMS must support SNMP.
• Graphical network map must be supported by the NMS.
• The NMS must support alerts in forms of emails/phone messages.
• The overall design must be suitable for Cellip. Design in this case means: configuration directory structure, agent installations, web interface design, graphs, graphical network map.
By following this list when evaluating, three different network monitoring systems passed on for further investigation. These three network monitoring systems are: Shinken [48], Zabbix [49] and Datadog [50].
Both Shinken and Zabbix are free non-cost projects. Zabbix have extra functionalities that can be paid for. Datadog differs from the other two systems by being a system that takes monetary charges for the use of their services. The charges are either an annual cost or a monthly cost
(decided by the customer). Shinken and Zabbix are network monitoring systems that are installed on one of the local servers or in the cloud. Datadog differs from Zabbix and Shinken by statically being installed in the cloud (cannot be installed locally at the company’s site). In the environment of Zabbix and Shinken, the administrator installs software on a server that will act as the NMS. Datadog uses a web interface to configure the NMS for the environment to be monitored. The server that receives all the monitoring data are provided by Datado.
Datadog solves Cellip’s problem when it comes to data storage, hosting the server in the cloud and by providing something Datadog defines as integrations [51]. These integrations are ready-to-use scripts that can be used to monitor many different objects. By using these integrations, the administrator that implements monitors in an environment will save time that the administrator would have lost when writing these scripts. If Cellip were to use Shinken or Zabbix, Cellip would have to solve the problems that comes with data storage and the cloud-hosting of the NMS.
Each of these monitoring systems were implemented in a lab environment. This lab environment consists of virtual 6.8 CentOs (Linux) machines and one physical Windows 10 machine. The virtual linux machines has either Shinken software, Zabbix software or Datadog software installed on them. All three systems went through testing in this lab environment. The tests consisted of:
• Examining how custom scripts can be created to monitor network monitoring objects. • Examining the overhead of adding devices for monitoring in the NMS.
• Checking what scripts already exist to monitor different objects. • Checking custom poll cycle and SNMP parameters.
• Specific to Shinken - examining monitoring software integration (Graphite) [52] overhead.
All three systems can collect data from custom written/programmed scripts. By being provided the flexibility of creating custom scripts to monitor objects, the administrator can monitor all the objects provided in this thesis work. However, the overhead of creating these scripts still exists as a problem.
When installing Shinken agents in the lab environment, the various languages used by Shinken had to be upgraded on the operating system as the system is installed via pip or from sources. The installation scripts for Shinken that comes in the source file also requires Python 2.6 or higher [53]. Datadog and Zabbix supports installation with repositories [54], making the
installation very easy by just using the terminal with appropriate commands. Zabbix and Datadog agent installations on Windows machines are done by downloading an installer and running the installer. Shinken does not provide any specific installer for Windows machines, instead the source-installation method is used for Windows [53].
All three systems provide scripts that can monitor the standard network monitoring objects mentioned under the “Standard network monitoring objects for servers” for both Linux and Windows platforms [55] [56] [57]. Custom parameters for poll cycles [58] [59] [60] and SNMP configuration [61] [62] [63]can be done with all the three systems. To set these parameters configuration files need to be filled with the correct information.
To test the integration of other software in Shinken, Graphite was used. The installation of Graphite on its own brought a big overhead in terms of time consumption. Additionally, to install graphite many requirements [64] must be met. The possibility to integrate is there but the time consumption to integrate software into Shinken made it a non-valid option for Cellip.
After testing the features of the three network monitoring systems, Cellip chose to use Datadog as their new NMS to monitor their environment. The deciding factor of choice was the overhead reducing features of Datadog: cloud hosting, data storage and integrations.
5.3 Monitoring the network monitoring objects
The information provided in this section presents how Datadog monitors the network monitoring objects found in the literature study. This section will also provide specific information on methods to monitor the VoIP network monitoring objects.
To monitor the standard network monitoring objects on a server a Datadog agent is installed on the server. The Datadog agent has ready-to-go scripts that can monitor all the objects found in the “Standard network monitoring objects” section of this thesis. Datadog monitors these objects in Linux by using the unix shell utilities or opening and reading files which the server saves information in [65].
To monitor the standard network monitoring objects on a Windows machine, Datadog uses WMI [66].
To monitor the SNMP-based devices with Datadog, the SNMP integration [61] is used. This integration is based on a ‘.yaml file’ which is the configuration file for a background script that runs SNMP-get requests to poll data from hosts. This configuration file is filled with host IP addresses and different OIDs that are to be polled for data. By filling this configuration file with all the OIDs and their respective correct indexes, all the network monitoring objects found in the “Network monitoring objects for network devices” can be monitored.
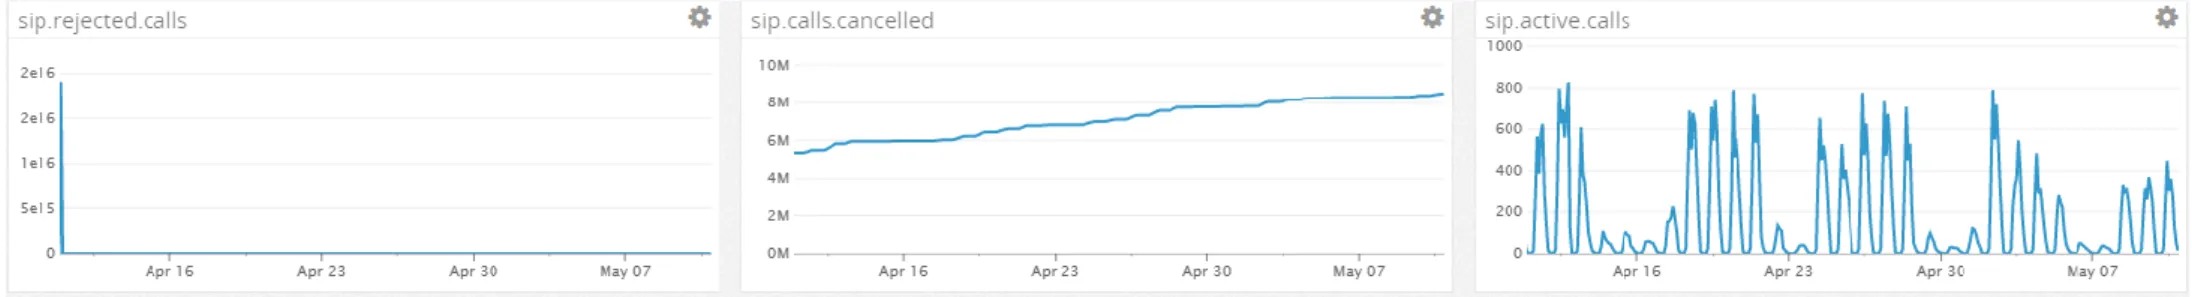
Datadog supports monitoring of the VoIP network monitoring objects using custom scripts [67] (i.e. custom agent check). There are no ready-to-go scripts that are preconfigured by Datadog that can be used for this type of monitoring. In Appendix A, “Sip stats datadog custom script” a custom script for Datadog is provided. This script opens a file and sorts out information from this file and then sends the data to Datadog. The script’s purpose is to show how custom scripts can be used and the custom scripts possibilities. The script is used to send statistical SIP information to the NMS from one of the SIP-servers. The underlying SIP software that runs on this server saves information in different files that can later be used for e.g. monitoring purposes. The last lines of the script show that the script sends the amount of active calls, rejected calls and calls_cancelled that occurs on this server.
To perform monitoring on VoIP, the performance counters for the calls first must be collected and then run through an algorithm like the R-factor (if a summarized value like MOS is the preferred presentation of the traffic) to later be sent on to Datadog via custom scripts. To be certain that the overhead of monitoring the VoIP traffic does not disturb the performance, a ‘network tap’ [68] can be used. By using a network tap the RTCP information about each call can be extracted and parsed through a collector to later be sent to Datadog. Using the network tap method however would require hardware resources that supports its features.
How the metrics should be sent to Datadog is also per design choice. One can run e.g. the R-factor algorithm and send MOS values to Datadog or each VoIP network monitoring object can be sent separately for each call instance (jitter, packet loss, delay etc.).
5.4 Graphical network map
When deploying Datadog agents on various servers, each agent will appear in the web interface of Datadog under ‘Host Map’ [69] automatically. The host map plots a hexagon symbol for each server with an installed agent. The symbol is colored green-gray-red depending on the health status of the server. The determining factor for the coloring of the hexagon (or host), is specified in the host map. The coloring is done based on metrics values from a network monitoring object, e.g. CPU utilization. If CPU utilization is selected as the coloring method, the color will be
dependent on the values that are represented by the CPU utilization network monitoring object. Any network monitoring object within the NMS can be chosen as the coloring method for the servers.
5.5 Implementation
Part of the results from the literature study and the lab took shape in form of an implementation in Cellip’s environment with the network monitoring system ‘Datadog’. The implementation is limited to only monitor the Linux environment. The VoIP network monitoring objects are also very limited within this implementation. This section includes text correlated to pictures that resides under “Appendix, Datadog pictures”. The pictures’ size is too big to be presented directly within this section. The devices that are monitored in this implementation are: Linux servers, Cisco firewalls and Sonus SBCs
The network monitoring objects that are monitored within this implementation are all the objects within “Network monitoring objects for network devices” and all but three objects within “Standard network monitoring objects for servers”. The temperature, voltage and fan speed objects are not monitored because the “sensor platform” that collect these values does not have a supported SNMP MIB for it. None of the network monitoring objects within “VoIP network monitoring objects” are monitored.
The firewall network monitoring objects are presented as “Figure 2” in the appendix “Datadog pictures, 9.1.1 Firewall dashboard”. This picture shows graphs of all the network monitoring objects within the section “Cisco firewalls network monitoring objects”. Each graph has a
describing title of what values are being plotted in the graph. Each vector has a unique color and presents a specific value from an index, e.g. in the graph “Bytes outgoing traffic | All interfaces” each vector represents outgoing traffic from a specific interface. There are graphs that only have one index, e.g. “CPU utilization percentage” which presents in a percentage the CPU utilization on the device.
The SBC network monitoring objects are presented as “Figure 3” in the appendix “Datadog pictures, 9.1.2 SBC dashboard”. The picture presented in this appendix shows all the network monitoring objects within the section “Sonus SBC network monitoring objects”. The plotted graphs presented in this picture uses indexes for the vectors where each index represents an interface or a logical port on the device.
In the appendix “Datadog pictures, 9.1.3 Linux server dashboard” the standard network
monitoring objects for servers is presented as “Figure 4”. As all the other pictures presented thus far - the graphs are also index based, e.g. in the graph “Cpu usage %” each index is either a user on the system or the amount the cpu is idle.
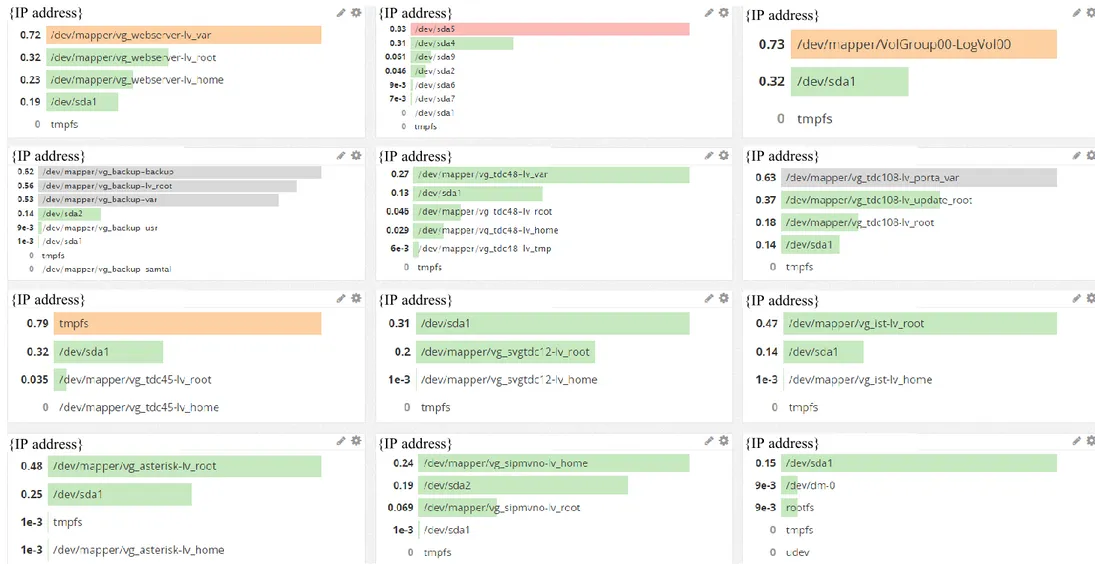
To see the amount of disk usage on all the servers in the implementation a dashboard was created that presents as “Figure 5” the disk usage for all the servers. In the appendix “Datadog pictures, 9.1.4 Disks dashboard” all the servers disk usage is presented in a factor value where 0.7 represents 70%. A coloring method is used for these queried values where green is low usage, gray is medium usage, orange is medium-high usage and red is high usage.
The host map of all the Linux servers is presented in the appendix “Datadog pictures, 9.1.5 Host map”. This picture (Figure 6) shows how the host map looks like with its hexagon symbols and coloring.
In the appendix “Datadog pictures, 9.1.6 Alarms” different alarms are shown in “Figure 7”. These alarms (or monitors) have been set to send an alert when a threshold is met. The alerts are sent to Cellip’s administrative team in form of a text message and an email.
The last picture presented as “Figure 8” in the appendix “Datadog pictures” is the “9.1.7 Sip stats” which shows the graphs created from the custom script made in this thesis work. The created script that activates monitoring for these graphs can be found in the appendix “Sip stats datadog custom script”.