THE RELATIONSHIP BETWEEN ROAD CHARACTERISTICS AND
SPEED COLLECTED FROM FLOATING CAR DATA
Camilla Sloth Andersen
Assistant Professor, Aalborg University Sofiendalsvej 11, 9200 Aalborg, Denmark Phone: +45 2534 2191 E-mail: csa@civil.aau.dk
Co-authors(s); Kristian Hegner Reinau, Associate Professor, Aalborg University; Niels Agerholm, Associate Professor, Aalborg University
ABSTRACT
Speed is of great importance to the safety level of a road. Speed choice is strongly influenced by the road environment and the drivers’ assessment of safe speed level at a specific location. This paper presents an analysis of the relationships between speed and road characteristics and speed and driver characteristics. The analysis is based on big data on speed and driver characteristics combined with data on road characteristics on 49 secondary rural two-lane roads in Denmark. Data is modelled using multivariate linear regression. The results show a primarily influence from road and shoulder width, the extent of road markings and the section lengths on speed. Secondly, they also show the presence of woodland and intersections influencing speed as do gender, age of vehicle and time of day.
1.
INTRODUCTION
It is widely accepted that speed is a major contributing factor to road accidents. The relationships between speed and road accidents and between speed and the severity of accidents are well established, amongst others by Elvik, Nilsson and Rosen et al. (Elvik, 2012; Nilsson, 1981; Rosen et al., 2011). Research on speed and the effect of the road environment on the speed is extensive.
Despite the well-documented relationship between speed and risk, speeding is still common amongst road users. An Australian study showed that a large proportion of drivers did not believe it to be risky to drive 30 km/h above the speed limit in both urban and rural roads (Fildes et al., 1991). Also a more recent Scandinavian study shows that 45-72 % of all drivers violate the speed limit with more than 10 km/h on rural roads (Eksler et al., 2009). In general drivers underestimate the risk of speeding and base their speed choice primarily on an assessment of the road and traffic environment (Várhelyi, 1997). A Danish study found that drivers interpret road characteristics related to the lanes – wideness, alignment and longitudinal profile but not characteristics connected to the road sides (Havarikommissionen for Vejtrafikulykker, 2011). Results from research projects support the fact that road alignment is very important for the driver risk perception (Kanellaidis et al., 2000) and that inconsistencies in road alignment affect drivers (Zervas et al., 1998).
The Danish Road Accident Commission has studied accidents involving severe speeding and found that drivers misinterpret the road and overlook important elements when choosing their speed (Havarikommissionen for Vejtrafikulykker, 2011). The Danish Accident Investigation Board (Haverikommissionen for Vejtrafikulykker) based their study on 99 accidents involving severe speeding and interviews of 38 drivers. The safety problem is that drivers primarily interpret road elements that invite high speed, for example wide lanes, presence of central reserve and multiple lanes. On the other hand, the drivers misinterpret or fail to recognize other elements that constitute risk, for example rigid obstacles, steep slopes, narrow shoulders and the number of road access. The Danish Accident Investigation Board further found that drivers interpret road characteristics related to the lanes, such as wideness, alignment and longitudinal profile, but not characteristics connected to the sides of the road (Havarikommissionen for Vejtrafikulykker, 2011). Results from other research projects support the finding that road alignment is very important for the driver risk perception (Kanellaidis et al., 2000) and that inconsistencies in road alignment affect drivers (Zervas et al., 1998). Several studies have analysed the relationship between road characteristics and speed. These studies vary in multiple dimensions, for example on how data is collected and which analytical methods are deployed. Some studies gather speed data from measurements on specific locations, i.e. spot speed and combine this with data on road characteristics for the specific road (i. e. Lobo et al., 2013). Others conduct studies in simulators gathering speed data from participants driving through roads constructed for the simulator (i.e. Melo et al., 2012). The studies all find that several road characteristics influence the speed level of the road despite differences in data gathering and method of analysis.
Speed data collected in specific locations using loop detectors, lidar or radar guns etc. has the disadvantage of only representing the speed in the exact location and not necessarily representing the average speed in the analysed road section. The use of simulators gives the advantage of controlling even small variations in road characteristics and thereby corresponding variations in speed. However, using simulators will always be an artificial environment, and Francesco Bella (2008) shows the demand for careful validation.
Pérez-Zuriaga has used GPS equipment in cars to collect speed data in a study in 2013. Cars are stopped at a check point before each analysed section and equipped with a GPS. The cars are then stopped again at a point after the section where the GPS equipment is collected. This method is
regarded as valid and having the advantage of reaching every driver, thereby presenting the opportunity of combining speed data collection with collection of data through questionnaires (Pérez-Zuriaga et al., 2013). This method, however, still requires a large setup at every section analysed; hence the data collection will be quite expensive or the number of analysed sections limited. Also, the results here might be affected by the Hawthorne Effect– drivers might have drove more according the regulation than normal because they were aware of the assigned equipment.
This paper will add knowledge about the relationship between road characteristics and speed choice by analysing GPS-based speed data called Floating Car Data (FCD) from a large-scale research project including 425 cars. The FCD is combined with data about a number of road characteristics.
The objective of the paper is to answer the following research question:
Is it possible to document a relationship between road characteristics, driver/vehicle characteristics and vehicle speed on two-lane rural roads in Denmark?
The advantage of using FCD is that the speed data is retrieved from drivers in a natural road environment, driving their own car without any specific instructions or interventions. Various research on traffic behaviour indicate that any effect from installed equipment hardly affect the driving behaviour after the first few trips (Agerholm, 2011; Jørgensen, 2009). Others have used FCD in studies of speed. The effect of speed calming measures has been assessed using FCD which allows for analysis of driver speed behaviour along a section compared to spot data (Jørgensen et al., 2013).
2.
METHOD
The main objective of this paper is to analyse the relationship between vehicle speed, driver/vehicle characteristics and road characteristics and to identify the influence of a range of specific variables on the choice of speed. For the drivers’ choice of speed to be influenced by road characteristics, it must be a free choice on the sense that the speed should not be restricted by e.g. congestion, weather conditions or unnatural situations. FCD gives us the speed choice in the driver’s natural environment, although it does not detect if weather or other road users’ behaviour affects the measured speed. However, the extent of congestion is limited since the road sections are in rural areas and known congestion-exposed sites are eliminated from data.
FCD data is selected for a number of road sections. The sections are of homogeneous design, which is assured by keeping the following features constant within one section: Administrative class, Annual Average Daily Traffic, carriageway width, ribbon development, forest stand along the road, biking facilities, and the extent of road markings along the road. The sections are unequal in length since the homogeneity is of greater importance than equal length. Sections do include intersections with local roads, but intersections with roads of same or higher classifications are eliminated from data.
The following functional relationship is presumed:
𝑆𝑝𝑒𝑒𝑑 = 𝑓(𝑋𝑣𝑎𝑟) = 𝛽0 + 𝛽1 ∙ 𝑋1 +. . . . +𝛽𝑛∙ 𝑋𝑛+ 𝜀 Where
𝑋𝑛1 = Road and driver characteristics 𝛽𝑛0 = Regression coefficients
To analyse the relationship a multivariate linear regression is performed. The regression is performed stepwise at first in order to exclude variables not adding to the explanation of the variance in the speed. Lastly, a multivariate linear regression is performed with the variables contributing to the explanation of the variation in speed entered. Multicollinearity is considered by exam of the variance inflation factor.
All statistical analysis is performed in IBM SPSS statistics 23.
3.
DATA
Speed data is obtained from a recently finalized Big Data study in the northern part of Denmark. This study included 425 cars from which GPS-based speed data has been collected for an average of 2 years and cover around 14 million km of driving in total. Each car had a board unit, which among others registered the position and speed of the vehicle with 1 Hz (Tøfting et al., 2014).
Data in this paper is from the period April to October in both 2013 and 2014. The period November to March is eliminated so as to avoid icy and snowy roads influencing the choice of speed. The data includes 49,539 trips registered by 354 different cars.
The same study provides the information about the drivers and vehicles. Data on driver age, gender and yearly mileage is available as well as age of car.
Data about road characteristics is collected for 49 road sections in the northern part of Denmark. All sections are secondary two-lane rural roads with a speed limit of 80 km/h (the general speed limit on rural roads in Denmark). To rule out the effect of curves on speed choice, all sections are straight stretches of road. The following road characteristics are registered for the sections: carriageway width, shoulder width, strip width, density of intersections, density of road access, presence of woodland along the section, presence of bicycle path and the extent of road markings.
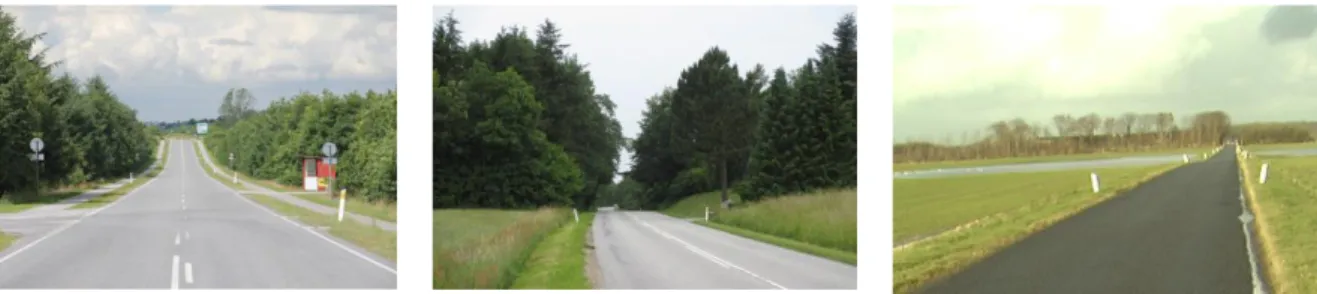
Road characteristics are collected by direct observation from a slow moving vehicle. The data is originally collected as a part of a PhD thesis regarding accident modelling (Andersen, 2014). Figure 1 shows examples of road sections in the study.
Figure 1: Examples of road sections in the data
Speed data, data about driver/vehicle characteristics and data about road characteristics for each trip on a given road section speed are joined. The analysis is thus based on individual trips on each of the 49 road sections. This is different from the normal approach in the literature, where the analysis is often based on aggregated speed data for each section. This aggregation has the disadvantage of erasing the information about the variation of trip speeds on a given section. As an example, two road sections may have the same average speed, where in reality almost all driver on the one of the two drives around the average speed, whereas some drivers on the other drive really fast and others really slow. The approach in this paper, based on speed of individual trips, captures this information in the statistical regression analysis.
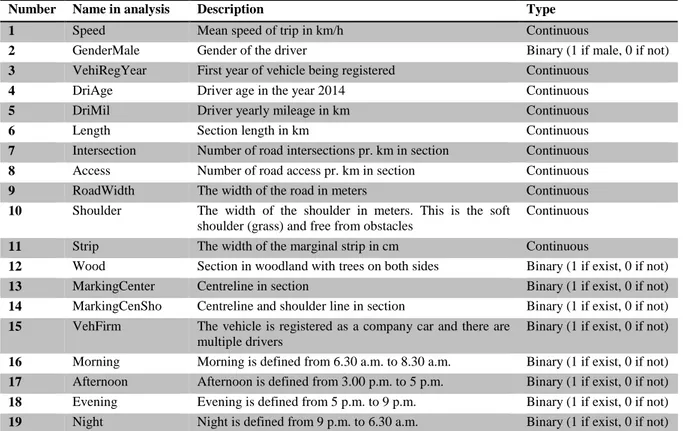
Table 1 shows the final list of variables for the analysis. The process also included estimation of the effect of other variables such as information about the surrounding area of the road – including buildings, rigid obstacles and solitary trees. However, these added no explanatory power to the model.
Table 1: Variable names, Description and Types
Number Name in analysis Description Type
1 Speed Mean speed of trip in km/h Continuous
2 GenderMale Gender of the driver Binary (1 if male, 0 if not)
3 VehiRegYear First year of vehicle being registered Continuous
4 DriAge Driver age in the year 2014 Continuous
5 DriMil Driver yearly mileage in km Continuous
6 Length Section length in km Continuous
7 Intersection Number of road intersections pr. km in section Continuous
8 Access Number of road access pr. km in section Continuous
9 RoadWidth The width of the road in meters Continuous
10 Shoulder The width of the shoulder in meters. This is the soft
shoulder (grass) and free from obstacles
Continuous
11 Strip The width of the marginal strip in cm Continuous
12 Wood Section in woodland with trees on both sides Binary (1 if exist, 0 if not)
13 MarkingCenter Centreline in section Binary (1 if exist, 0 if not)
14 MarkingCenSho Centreline and shoulder line in section Binary (1 if exist, 0 if not)
15 VehFirm The vehicle is registered as a company car and there are
multiple drivers
Binary (1 if exist, 0 if not)
16 Morning Morning is defined from 6.30 a.m. to 8.30 a.m. Binary (1 if exist, 0 if not)
17 Afternoon Afternoon is defined from 3.00 p.m. to 5 p.m. Binary (1 if exist, 0 if not)
18 Evening Evening is defined from 5 p.m. to 9 p.m. Binary (1 if exist, 0 if not)
19 Night Night is defined from 9 p.m. to 6.30 a.m. Binary (1 if exist, 0 if not)
To ensure that data reflects the drivers’ choice of speed based on the road characteristics in the particular road section, there are three situations excluded from the data. Exclusion from data involves trips with a mean speed below 60 km/h since speeds below this value are not considered free flow and could be influenced by for example congestion, slow moving vehicle or a turning vehicle. An earlier study of FCD in Denmark used a limit of 65 km/h (Agerholm et al., 2008a; Agerholm et al., 2008b). The limit used in this study is lower because the roads studied are merely secondary roads and mean speeds are, in general, lower compared to the entire road network including primary roads.
Trips shorter than 10 seconds are also excluded from the data. This ensures that the analysis is not influenced by data from vehicles crossing the road. The raw data include data points from vehicles crossing the road sections since it takes a few seconds to cross a road and GPS position is recorded with one Hz. If not removed the trip made by a vehicle crossing will be included as a trip made on the particular road section. This problem is handled by excluding the very short trips in the analysed data. If speed in a trip involves large variations over a fairly short section, the trip is excluded. Large variation in one trip can imply that turning vehicles, sudden appearance of obstacles in the road or turning to a side road influence the vehicle speed. In result individual trips with a standard deviation on a road section exceeding 9 km/h are excluded from data.
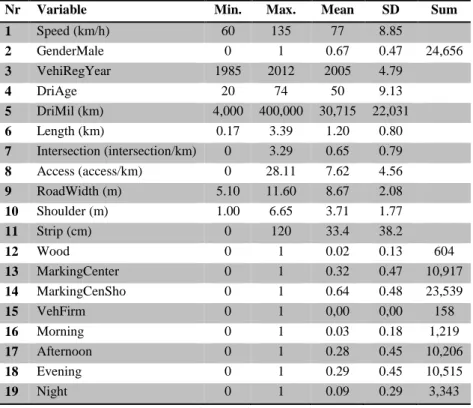
As a result of the elimination of trips, the analysis is based on 34,972 trips by 349 vehicles. Table 2 shows the descriptive statistics of all variables.
Table 2: Descriptive statistics for variables
Nr Variable Min. Max. Mean SD Sum
1 Speed (km/h) 60 135 77 8.85 2 GenderMale 0 1 0.67 0.47 24,656 3 VehiRegYear 1985 2012 2005 4.79 4 DriAge 20 74 50 9.13 5 DriMil (km) 4,000 400,000 30,715 22,031 6 Length (km) 0.17 3.39 1.20 0.80 7 Intersection (intersection/km) 0 3.29 0.65 0.79 8 Access (access/km) 0 28.11 7.62 4.56 9 RoadWidth (m) 5.10 11.60 8.67 2.08 10 Shoulder (m) 1.00 6.65 3.71 1.77 11 Strip (cm) 0 120 33.4 38.2 12 Wood 0 1 0.02 0.13 604 13 MarkingCenter 0 1 0.32 0.47 10,917 14 MarkingCenSho 0 1 0.64 0.48 23,539 15 VehFirm 0 1 0,00 0,00 158 16 Morning 0 1 0.03 0.18 1,219 17 Afternoon 0 1 0.28 0.45 10,206 18 Evening 0 1 0.29 0.45 10,515 19 Night 0 1 0.09 0.29 3,343
4.
RESULTS
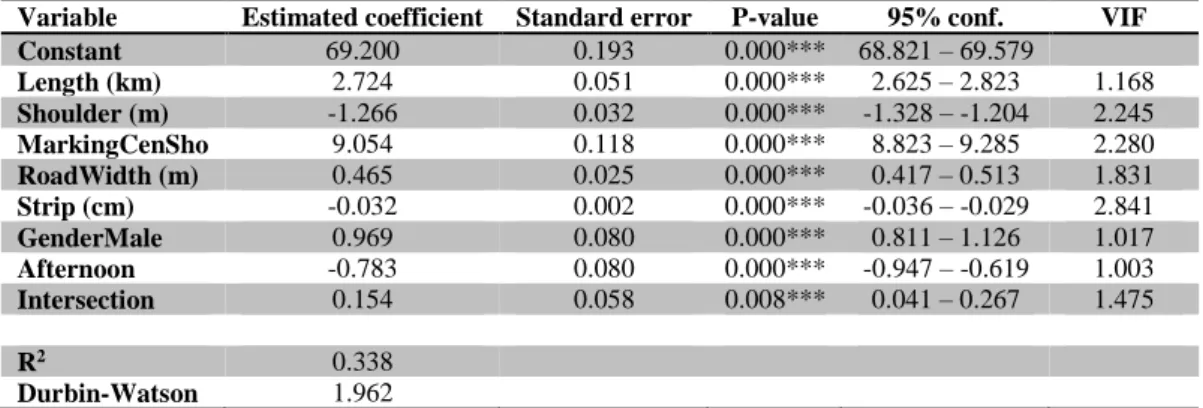
This study involved a multivariate linear regression to model speed for secondary two-lane rural roads on the northern part of Denmark. Table 3 shows the regression coefficients, standard errors, p-value and 95% confidence intervals and variance inflation factor (VIF).
The coefficient of determination for the model is 0.34; hence the model explains 34 % of the variation in speeds among the analysed trips. This is not a particularly high explanation rate; however, a low explanation rate was expected since the individual driver is not accounted for in the model. It is plausible, that the individual driver style – aggressive, slow, calm etc. – account for relatively large a proportion of the variation in speed. This means that a higher explanation rate would require more variables describing the of driver’s style in the model. The only information available on the drivers is, however, age and gender.
Ten of the variables were excluded from the model. This includes DriMil, VehFirm, DriAge, Access, Wood, Morning, Evening and Night. DriMil, VehFirm were insignificant while DriAge, VehiRegYear Access, Morning, Evening and Night were significant but did not increase the explanation of the variation in speeds when entering the variables stepwise. Wood was significant. Yet, only a little more than 600 of the more than 34,000 trips are made through woodland; hence the skewness of data is considered too large. Analysis of this variable should preferably be done on a set of data with more trips through woodland. MarkingCenter, describing sections with only centreline, was excluded from the regression due to collinearity with MarkingCenSho. The collinearity between the two variables is most likely due to the fact that trips on sections with no markings only represent a very small part of all trips as most trips probably were carried out on arterial rods with higher standard.
The results presented in Table 3 show that when there are road markings in both centreline and along the shoulder drivers go faster (9 km/h) than when there are no markings or only markings in the centre of the road. The explanation could be that roads with markings on both centre and along the shoulder are often wide roads with good maintenance-level. Another view could be that the markings guide drivers on the road. Both explanations give drivers the impression that it is safe to drive faster.
Table 3: Results from multivariate linear regression of trips with speed as depended variable.
The results also show that the wider the road the faster the vehicles; a common result in studies of the relationship between speed and road characteristics (i. e. Lobo et al., 2013; Melo et al., 2012). This also verifies the result regarding the road markings since the most extensive markings often are on the widest roads.
Sections in this analysis are of different lengths, and this seems to have some impact on the result. The length of sections can explain some of the speed variation, and for each kilometre extra road the speed is increased by 2.7 km/h. An explanation for this could be that road environment upstream and downstream of the section affects speed on the section. This study only included straight sections, which means sections before and after most likely have a poorer sight distance for instance. Lobo et al (2013) present the effect of up and downstream features, which show that increased constrained visibility downstream, bendiness and density of intersections upstream result in reduction in speed. The widths of the shoulder and strip also affect the speed. The wider the shoulder, the lower the speed; the speed is lowered by 1.3 km/h for each meter of shoulder. The same tendency applies to the wideness of the strip: the wider the strip, the slower vehicles are – 0.3 km/h for each 10 cm extra strip. This result is unexpected since the wideness of the road has the opposite effect.
The speed increases with 0.2 km/h as the number of intersections pr. km road increases by 1. This is not especially logic since crossing/turning traffic would be expected to lower the speed, which is documented in other studies (Correia and Silva, 2011; Lobo et al., 2013). However, this result could be affected by the fact that the data does not include trips with low speeds as well as trips with a high variation in speed. This means that the analysis only counts for a portion of trips actually influenced by the number of intersections, so the result could be biased by this fact.
Gender has a significant effect on speed choice. The model shows that males on average drive 1 km/h faster than women. The last variable with a significant influence on the speed is time of day. Trips carried out during the afternoon between 3 p.m. and 5 p.m. tend to be 0.8 km/h slower than the rest of the day. A large proportion of the trips are carried out during these 2 hours (approx. 30%) so an explanation could be that drivers slow down with more traffic on the road. Even though none of the sections included in this study suffer from congestion there are more trips in the 2 hours of afternoon Variable Estimated coefficient Standard error P-value 95% conf. VIF
Constant 69.200 0.193 0.000*** 68.821 – 69.579 Length (km) 2.724 0.051 0.000*** 2.625 – 2.823 1.168 Shoulder (m) -1.266 0.032 0.000*** -1.328 – -1.204 2.245 MarkingCenSho 9.054 0.118 0.000*** 8.823 – 9.285 2.280 RoadWidth (m) 0.465 0.025 0.000*** 0.417 – 0.513 1.831 Strip (cm) -0.032 0.002 0.000*** -0.036 – -0.029 2.841 GenderMale 0.969 0.080 0.000*** 0.811 – 1.126 1.017 Afternoon -0.783 0.080 0.000*** -0.947 – -0.619 1.003 Intersection 0.154 0.058 0.008*** 0.041 – 0.267 1.475 R2 0.338 Durbin-Watson 1.962
than any other 2-hour period during the day. This means drivers will not see as many road users the rest of the day as they do between 3 and 5 p.m.
5.
CONCLUSIONS AND FUTURE WORK
Road safety experts have major interest in the relationships between speed and road characteristics and between speed and driver characteristics. This paper presents a model of the relationship on two-lane rural roads in Denmark including 6 variables on road characteristics, 1 variable on driver characteristics and 1 variable representing time of day.
The lessons learnt from this study are that the drivers tend to drive faster on longer, wider straight sections. Firstly, the results show a primary influence on speed from the road and shoulder widths, the extent of road markings and the section lengths. Secondly, the presence of intersections also influences speed as do gender and time of day.
The model explains approximately 34 % of the variation. There will always be a proportion of unexplained variation because there will be an element of randomness when dealing with human behaviour. There are most likely more explanatory variables than the ones involved in this study, but information on especially driver’s attitude and preferences are not available – variables which reasonable cause large effects on the speeding pattern.
Working with FCD in this type of analysis provides the opportunity to study lesser exposed variables such as woodland or roads without road markings. The ability to analyse the lesser exposed variables require large amount of trips in order to get enough exposure on sections with for example woodland. This study included more than 34.000 trips and still no useful results were produced for the variables woodland or roads without road markings alone.
Due to the large amount of data a large number of variables show a statistically significant effect on speed; nevertheless, this might not imply inclusion of all these variables in the model. It is necessary to carefully study the added explanatory value to the model by including the variable and the logical explanation for the result.
In future studies of speed and the relationship to road characteristics and to driver characteristics, we will seek to include more explanatory variables. New explanatory variables could be from both road and driver characteristics. The curvature of the road is an example of an important variable to include in future studies. This study is made on straight sections which naturally only make up part of the entire road network; hence, a variable expressing the curvature of the road will be of importance in order to get the full picture of characteristics affecting driver’s choice of speed. In addition, future research should include scrutiny of the functional form of the relationship. Perhaps a regression based on a cubic functional form could improve the explanation rate.
REFERENCES
Agerholm, N. (2011) Speed regulating Effects of Incentive-based Intelligent Speed Adaptation in the short and medium term. Aalborg University, The Faculty of Engineering and Science, Traffic Research Group (Planning).
Agerholm, N., Waagepetersen, R., Tradisauskas, N., and Lahrmann, H. (2008a) Intelligent speed adaptation in company vehicles. Intelligent Vehicles Symposium, 2008 IEEE, , pp. 936-943.
Agerholm, N., Waagepetersen, R., Tradisauskas, N., Harms, L., and Lahrmann, H. (2008b) Preliminary results from the Danish Intelligent Speed Adaptation Project Pay As You Speed. IET Intelligent Transport Systems, 2, 143-143-153.
Andersen, C.S. (2014). Udpegning af risikolokaliteter på det tosporede vejnet i åbent land baseret på data om vejens karakteristika: Identification of hazardous road locations on secondary rural roads in Denmark based on the characteristics of the road. Aalborg: Department of Civil Engineering, Aalborg University. (DCE Thesis; Nr. 69).
Bella, F. (2008) Driving simulator for speed research on two-lane rural roads. Accident Analysis & Prevention, 40, 1078-1087.
Correia, G.H. and Silva, A.B. (2011) Setting Speed Limits on Rural Two-Lane Highways by Modeling the Relationship between Expert Judgment and Measurable Roadside Characteristics. Journal of Transportation Engineering, 137, pp 184-192.
Eksler, V., Popolizio, M., and Allsop, R. (2009) How Far from Zero?: Benchmarking of Road Safety Performance in the Nordic Countries. ETSC.
Elvik, R. (2012) A re-parameterisation of the Power Model of the relationship between the speed of traffic and the number of accidents and accident victims. Accident Analysis & Prevention, 50, 854-860.
Fildes, B., Rumbold, G., and Leening, A. (1991) Speed Behaviour and Drivers’ Attitude to Speeding. Havarikommissionen for Vejtrafikulykker. (2011) Grove Hastighedsovertrædelser. Havarikommissionen for Vejtrafikulykker, København.
Jørgensen, A.J. (2009) Bilisters handlinger:-mellem retsnorm og praksis. AalborgUniversity, The Faculty of Social Sciences, Department of Sociology and Social Work.
Jørgensen, M., Agerholm, N., Lahrmann, H., and Araghi, B.N. (2013) Driving speed on thoroughfares in minor towns in Denmark. 26th ICTCT Worksho.
Kanellaidis, G., Zervas, A., and Karagioules, V. (2000) Drivers' Risk Perception of Road Design Elements. Transportation Human Factors, 2, 39-48.
Lobo, A., Rodrigues, C., and Couto, A. (2013) Free-Flow Speed Model Based on Portuguese Roadway Design Features for Two-Lane Highways. Transportation Research Record: Journal of the Transportation Research Board, p 12–18.
Melo, P., Lobo, A., Couto, A., and Rodrigues, C. (2012) Road cross-section width and free-flow speed on two-lane rural highways. Transportation Research Record: Journal of the Transportation Research Board, 28-35.
Nilsson, G. (1981) The effects of speed limits on traffic accidents in Sweden. Proceedings of the International Symposium on the Effects of Speed Limits on Traffic Accidents and Transport Energy use, OECD, Dublin, pp. 1-8.
Pérez-Zuriaga, A.M., Camacho-Torregrosa, F.J., Campoy-Ungría, J.M., and García, A. (2013) Application of global positioning system and questionnaires data for the study of driver behaviour on two-lane rural roads. Intelligent Transport Systems, IET, 7, 182-189.
Rosen, E., Stigson, H., and Sander, U. (2011) Literature review of pedestrian fatality risk as a function of car impact speed. Accident Analysis & Prevention, 43, 25-33.
Tøfting, S., Lahrmann, H., Agerholm, N., Jørgensen, B., and Johannsen, L.V. (2014) ITS Platform: development of intelligent traffic. Proceedings - 10th ITS European Congress. ERTICO - ITS Europe Várhelyi, A. (1997) Dynamic speed adaptation based on information technology - a theoretical background. Lund University.
Zervas, A., Polak, J., and Kanellaidis, G. (1998) Subjective hazard assesment of geometric disign elements in relation to accident causation. International Association of Traffic and Safety Sciences Research, 22, 86-93.