I
N T E R N A T I O N E L L AH
A N D E L S H Ö G S K O L A N HÖGSKOLAN I JÖNKÖPING
I nva n d r a r n a s B i d r a g t i l l S a m h ä l l e t
En Jämförelse mellan Sverige och Jönköpings Län
Kandidatuppsats inom Nationalekonomi Författare: Malin Andersson
Guy Constant Kouhouta Handledare: Lars Pettersson
J
Ö N K Ö P I N GI
N T E R N A T I O N A LB
U S I N E S SS
C H O O L Jönköping UniversityImmigrants’ Contribution
to the Society
A Comparison between Sweden and the County of Jönköping
Kandidatuppsats inom nationalekonomi
Titel: Invandrarnas Bidrag till Samhället
En Jämförelse mellan Sverige och Jönköpings Län Författare: Malin Andersson och Guy Constant Kouhouta Handledare: Lars Pettersson och Johan Eklund
Datum: [2006-06-07]
Ämnesord Arbetskraftsinvandring, Cost-Benefit Analys, Bidrag Sammanfattning
Syftet med den här uppsatsen är att ta reda på hur stor del av kostnaderna för samhället som går att förknippa till invandrarna i Sverige. Sverige har jämförts med Jönköpings Län för att hitta eventuella avvikelser. Vi har försökt skapa ett beräkningssätt för att kunna visa hur mycket som går ut till invandrarna och hur mycket de ger tillbaka. Vi utrycker oss till största del i relativa termer i uppsatsen, för absoluta tal hänvisas till appendix. För att visa hur vårat beräkningssätt kan användas har vi gjort beräkningar på fyra kostnadsgrupper och en inkomstgrupp. Vi har kommit fram till att invandrare tenderar att arbeta mer än den inhemska befolkningen, men till en lägre lön. Trots detta så kompenseras inte kostnaderna för samhället av dess intäkter när man jämför de som är direkt kopplade till invandrarna.
Bachelor’s Thesis in Economics
Title: Immigrants’ Contribution to the Society
A Comparison between Sweden and the County of Jönköping Author: Malin Andersson and Guy Constant Kouhouta
Tutor: Lars Pettersson and Johan Eklund Date: [2006-06-07]
Subject terms: Cost-Benefit Analysis, Labor - immigrants, Allowances Abstract
Our aim in this thesis has been to look at the foreign citizens’ share of costs and benefits associated to the society in Sweden. We have compared Sweden on the national level to Jönköping County on the regional level to see if there are any deviations. We have conducted a new calculation approach in order to present the contributions given by immigrants and the associated costs. Figures are to a large extent viewed in relative terms in the thesis, and specified in concrete terms in the appendix. We have selected a series of four costs and one benefit in order to show how an estimation of the costs or benefits could be made. We have found that immigrants tend to work harder than the natives, but at a lower wage level. Even so they do not compensate for the costs to the society applied to immigrants.
Table of Contents
1
INTRODUCTION ... 5
1.1 Background ... 5 1.2 Outline... 62
THEORETICAL BACKGROUND... 7
2.1 Previous Studies ... 72.1.1 Nature and reason of immigration... 7
2.1.2 Immigrants contribution ... 7
2.1.3 Results... 8
2.2 Immigrants and the welfare of the natives... 9
2.3 Our method of calculation ... 9
2.4 Cost Benefit analysis... 10
2.4.1 The use of CBA ... 10
2.4.2 Estimating Cost and Benefit ... 10
3
EMPIRICAL ANALYSIS... 12
3.1 Description of the empirical process... 12
3.1.1 How to look for Y, the rate at which the group of foreigners we are interested in located in the county or municipality in the year 2003... 12
3.2 Costs associated to immigration ... 13
3.3 Application of our model... 14
3.3.1 Unemployment and Social allowances ... 14
3.3.2 Education and children allowances... 16
3.3.3 Absence from work ... 17
3.3.4 Health contribution... 18
3.4 Benefits associated with immigration ... 19
3.4.1 Income Tax ... 19
Tables and Figures appearing in the thesis
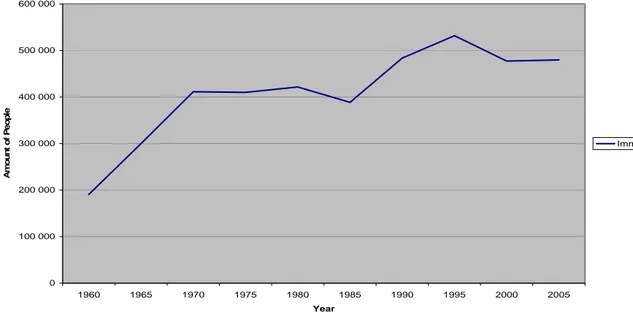
Figure 1. Total number of immigrants in Sweden 1960-2005
Table 3:1. Age distribution of Foreign and Swedish population in 2003
Table 3:2. Immigrants’ location rates in Sweden in 2003. How immigrants located themselves once in Sweden.
Table 4.1 Summary of the results showing the share of costs and benefit associated to immigrants.
Tables appearing in the Appendix
Table 1. Total cost paid by Försäkringskassan
Table 2. Immigrants coming to Jönköping and Sweden Table 3. Immigrants age structure in the year 2003 Table 4. Labour force structure and total income by age Table 5. Social Allowances
Table 6. Children allowances Table 7. Health expenditures Table 8. Social Allowance
Table 9. Emigrants (Age group 16-64)
Table 10. Reproduction rate in Sweden by county Table 11. Emigrants (Age group 16-64)
Table 12. Reproduction rate in Sweden by county Table 13. Unemployment and Social benefits Table 14. Children Allowances
Table 15. Health expenditures Table 16. Tax collected in Sweden
1
INTRODUCTION
In the following chapter the background to our thesis will be presented together with the purpose, framework and outline. There is also a part which describes previous studies made within the field of immigration and cost-benefit analysis.
1.1 Background
The Swedish economy has had different relations to immigration, from being dependent on working immigrants coming to Sweden in order to build a sustainable society, to taking care of refugee immigrants coming to Sweden for other reasons than employment.
The massive Swedish emigration to America in the late 19th century and early 20th century was followed by a major shortage in labour supply in the economy. At that time, Sweden opened its boundaries to any immigrant wishing to settle in the country, in order to supply the shortened labour force in the economy.
Immigration before the 1970s was mainly labour motivated, the immigrants contributed to the Swedish economy by working in manufacturing and constructing sectors, consequently financing their integration, while contributing to the growth of the economy.
There has been a major change in the trend of immigration as from the early 1970s when immigration became mainly politically oriented. Throughout the years, the Swedish government has applied different laws and strategies in order to regulate immigration. Today immigration occurs because of various reasons. There are labour immigrants, as well as refugees immigrants. One can immigrate because of political reasons, the search of working opportunity or other reasons. Once a person has been granted the right to settled in a foreign country for a determined or undetermined period, that person is perceived as a foreign citizen in the welcoming country.
Figure 1. Total number of immigrants in Sweden 1960-2005
Immigrants 1960-2005 0 100 000 200 000 300 000 400 000 500 000 600 000 1960 1965 1970 1975 1980 1985 1990 1995 2000 2005 Year A m ou nt o f P e op le Immigrants 1960-2005
The purpose of this thesis is to establish the first step of a simulation model aimed at estimating costs and benefits arising from immigration at a municipality or county level. These costs and benefits will be analysed on the level of Jönköping County and compared to the national aggregate level.
An Immigrant in the context of this thesis is a person who is born in a foreign country or a person living in Sweden with a foreign citizenship. We thereby neglect any second- or third-generation immigrant living in Sweden. Due to available data, the base year for this thesis will be 2003.
We will study foreign citizens in the age group 16 – 64 years; thereby we neglect the second and third generation immigrants and any person with a foreign background born in
Sweden. This is done in order to narrow our field.
Immigration can be seen from many different angles, each perspective bringing a different kind of contribution to the society, whether it is on local or national ground. We will compare Sweden on the national level to Jönköping on the local county level, to see the impact that immigration has on the society. This is the fundamental basis to our study, where we will try to find an answer to the following questions related to the subject of immigration:
It is difficult to identify and estimate costs and benefits while trying to define if a project is profitable, the case of immigration in our study. Is it possible to create a method that can allow us to define and put a value on those costs and benefits properly?
1.2 Outline
Our thesis will be structured into four parts. We will start with an introductive chapter where we will give the background and limitations of our study. In the chapter that follows, we will present a model of calculation that we have developed, which will be used as the methodical basis to our study together with the cost benefit analysis. The empirical analysis will contain a description of our model, an application of it and the results that follows. There will also be a comparison between the county of Jönköping and the national aggregate, and an analysis of derived from the comparison. The resulting conclusion of the empirical analysis will be presented in the last chapter. References and appendices follow the conclusion.
Further, we will list some of the costs and one benefit associated to the foreign citizen’s population. Detailed data from Försäkringskassan regarding the total expenditures on the total population will be in found in Appendix 1. In order to have the data fitting in our study, we calculate the share of foreign citizens among the total population and multiply it by the total cost shown in appendix 1. This gives us an expected cost/benefit associated to the foreign citizens.
2 THEORETICAL
BACKGROUND
This chapter will present the fundamental idea behind the Cost Benefit Analysis and the assumption about Potential Pareto Improvements.
2.1 Previous
Studies
There have been numerous studies about the impact of immigration flows on both the level of the local economy and the welfare of the population. Different articles written by various authors use special techniques and approaches in order to draw their conclusion, and obviously, they end up with dissimilar results. The reason behind this is how each one of them perceives the term “immigrants” and what type of data they use throughout their calculations. For instance, Edin and Al (2000) use longitudinal data while Ekberg (1995) uses cross-sectional data. Moreover, in the paper Edin and Al (2000) they divide
immigrants into two groups; labour immigrants and refugee’s immigrants, while Ekberg does not distinguish between the two groups. Whether the immigrant is working or not, an immigrant is considered someone who is born in a one country; and currently situated in another.
Previous studies have identified an immigrant as someone born outside the country he is living in, Sweden in this case, by using the term foreign-born. Some studies, like Ekberg, 1999, go even further by using the term of second generation of immigrants. They are people born in Sweden, but who have at least one parent who is foreign-born. The reader should be aware of the fact that results from those studies are influenced by the way the term immigrant was perceived by the author. All those studies differ to our own in the sense that we consider an immigrant, to be a foreign citizen, which means someone living in Sweden, but who does not have the Swedish citizenship. Another difference is the fact that, as mentioned in the introduction, we focus only on an age group (16-64) from that category of immigrants throughout our studies.
2.1.1 Nature and reason of immigration
Borjas (1990) attributes to any person immigrating to the US for economics reasons. There is a general perception that the US labour market offers a great opportunity. Thus,
someone immigrating to the US will be driven by his desire to improve his welfare in one way or another. Edin and Al (2000) distinguish between immigrants’ motivations and classify them according to the period of their immigration. For instance prior to the 1970 immigration to Sweden was mainly labour oriented. Towards the end of the 1970’s the trend was reversed due to various reasons, Ekberg (1995) allocates to the shift in the Swedish economy, which started to face a recession, which lead the government to strengthen its immigration policy. This period of economic recession coinciding with the years of political clashes in Iraq, Iran, Africa, South America and later the Balkan states as described by Edin and Al (2000) contributed to a shift in the Swedish immigration, moving from labour- to refugee immigrants.
2.1.2 Immigrants contribution
Edin and Al (2000) conditioned the immigrant’s performance to his or her country of origin. They argue that labour immigrants who entered Sweden prior to the end of 1970; coming from Northern and Western Europe had a positive effect on the Swedish
level of living standard, and since more than half of them came from the Northern Europe the language barrier was easily crossed. The same has not always been possible with the current immigrants according to their study. They also identified the costs arising from social insertion higher among refugees and other social allowances to cover start-up costs. Ekberg (1995) somehow agreed to the concept that immigrants’ economic performance depended on his country of origin by underlying the high percentage of Western/Northern European natives among immigrants during those years. However, Ekberg went even further. Since his study was to update the immigrants’ contribution to the Swedish
economy, he classified immigrants in age groups regardless of their country of origin. The age groups 0-19 and 64-plus are by Ekberg qualified as economically passive. Those two groups consume a huge part of the public goods under the form of child-care, education, health benefits and pensions. The immigrants in the age group 20-64 are economically active and their contribution is more significant to the society.
2.1.3 Results
The three studies Borjas (1990), Ekberg (2000) and Edin and Al (2000) agreed on the issue that the lifetime earnings of immigrants was higher in the period prior to the 1970 than that of the1980s’ and 1990s’, for instance; is the immigrants’ employment rate higher than the natives’. However, there are some divergences when it comes to evaluating the impact of immigrant’s native earnings. Ekberg (2000) argues that immigration can be harmful to the less educated part of the population, and to some extent profitable to the more educated one.
We do not know if Ekberg considered someone with a high school education as lowly educated. We assumed that the level of education is low, medium or maximum. Borjas (1990) argues that the impact of immigrant’s flows on native (those with high school education) earnings in different industries in Los Angeles is somehow negligible. He showed that a 10% increase in the immigrant population in an industry reduces the earnings of the natives in that industry by 0.4%.
To the question we will be processing: are social expenditures on immigrants offset by the taxes they put into the system? Borjas (1990) found it difficult to answer due to the number of data taken into consideration. Edin and Al (2000) also found it difficult to answer, because more than half of the group they studied had left Sweden by the end of their study; especially labor immigrants who have a higher propensity to returning home than the refugees. However, after matching income and population registers, estimating the relationship between changes in the employment rate among the immigrants and changes in their net contribution to the public sector, Ekberg (1995) concluded the group he qualified as economically active did not compensate for the one he qualified as economically passive. Therefore, according to his study, immigration had an overall negative contribution on the economy.
2.2
Immigrants and the welfare of the natives
The argument from Ekberg (1999) stating that immigrants´ age structure and unemployment rate are keys factors in the calculation related to the contribution of immigrants in the social welfare of the host country will act as our fundamental basis to this analysis.
The argument is supported by Spencer (1999), who wrote that it is mainly their juvenile age structure and the resulting high labour force participation that define immigrants as an economic asset. Studies on the topic, such as Edin and Al, 2000 pointed out that the role played by the absence of country specific skills and the level of education among immigrants, matches that of natives in average. This fact creates a situation where immigrants tend to rush towards jobs that require a low level of education and skills. Therefore the part of the local population who is lowly educated faces a though competition in the face of employment. At first sight, it appears that immigration has a negative impact on the natives’ welfare. In the following chapter, we try to classify different contributions brought to the local welfare system by immigrants and what they actually receive from it.
However, it is worth saying, as Edin and Al, 2000 pointed out, that the recruitment of young and motivated foreigners contributed to the growth of the Swedish economy during the years 1960-1970 even during the years prior to that period (Since that period coincide with the period when immigration was mainly labour oriented). Moreover, as Spencer (1994) says the side effect of having abundant foreign labour force is that natives attain higher professional positions; consequently leaving the lowly qualified positions to immigrants.
2.3
Our method of calculation
The method of calculation we use can be seen as path to conducting a Cost Benefit Analysis. In facts, the method results in the expected costs and expected benefits arising from foreigners. It is therefore judicious to talk about Cost Benefit Analysis after presenting our method of calculation.
Our model is useful when the costs and benefits to the society are not available in specified terms. Basically when the costs and benefits are expressed as a lump sum cost or benefit to the society and one is interested in knowing how much of each cost and benefit is
accounted to a specific population group within the society, our model will be useful. To determine the expected costs and benefits arising from foreigners in a county or municipality, we use a simple method of calculation that starts from taking X, the number of foreigners nationwide inducing a specific cost or benefit. We multiply X with Y the rate at which the applicable foreigners locate in the county or municipality. The product X*Y is the expected number of foreigners in the county or municipality. When we take the product X*Y and divide it with P the total population in the county or municipality; we obtained a result which is the expected rate or percentage of immigrants or foreigners in the total population at the county or municipality level that applies to the cost or benefit accounted for. In addition, when we multiply that result with T the total cost that falls on the total population inclusive of natives and citizens, we obtained the absolute value of the expected costs associated with immigration in the area. X, T and P are generally available in the national statistics. However, Y needs to be calculated; which is done in the first step of the empirical analysis.
2.4
Cost Benefit analysis
Connolly and Munro (1999) describe CBA as probably the most contemporary used tool by applied economists, and define it as the costs of a project deducted from the benefits. CBA is used mainly in the frame of public decisions. However, widely used by economists nowadays, the impulsion for measuring the benefits and costs of public decisions does not come from research of economists, but from agencies of the U.S. government. Gramlich (1990) track the CBA down throughout the history of American presidents and their public decisions.
Gramlich (1990) goes even further by explaining the evolution of the notion of CBA during different Presidents’ term of office. President Truman is one of many presidents, under whom the Budget Bureau adopted a formal set of rules to be used in making project decisions. Throughout President Johnson’s time in the White House, the government tried to adopt a Planning programming Budgeting System to support the process of spending decisions. President Reagan tried to apply a formal CBA to health, safety and
environmental decisions.
2.4.1 The use of CBA
This thesis will explain the economic contribution of immigrants in their host country / county. CBA is used in order to determine the immigrants’ economic contribution.
Gramlich (1990) does not really describe CBA as a self-contained field of economics, rather as something uneasily positioned between microeconomics and public finance, with
occasional doses of macroeconomics.
A high percentage of immigrants coming from less developed countries raise the concern about the impact of immigration and on the Potential Pareto Improvement in the overall social welfare; immigration nowadays is treated as a social issue in many countries. As the issue is growing in complexity and pressure for governments to remain fiscally and economically sound in the face of escalating responsibilities, cost-benefit analysis offers local decision makers a potentially effective source of guidance. Let us explain how to perceive governments in social terms. Gramlich (1990) does not describe the government as being an entity separate from its citizens, but as the collective expression of the will of citizens. The benefits and costs of the government’s projects are therefore not the increase or decrease in governmental revenues but the gains or losses accounted to all members in the society. This means that while conducting a CBA, one should focus on the impact of immigration on the members of the community.
2.4.2 Estimating Cost and Benefit
Connolly and Munro (1999) often mention that, the hardest part of CBA is the estimation of costs/benefits from the project. If there are no market failures, the marginal benefit of a good is its price. They continue by declaring that since most of the goods involved in CBA are usually non-marketed, there is no method available for identifying the potential value that consumers place on the commodity. An example of a commodity could be cultural benefit of immigration in the society.
Therefore, the best way is to quantify the costs and benefits that can be quantified, to group and rank non-quantifiable factors, and to proceed from there. No benefit or cost should be left behind; whether it is of qualitative or quantitative nature. This is where our method of calculation steps in.
3 EMPIRICAL
ANALYSIS
In our Empirical Analysis we will present a model to help making the specified calculations which applies to our main topic, the immigrants in the Swedish society. This will be done through help from relevant data for our study, some data which will be found in the appendix. The data will be structured in costs and benefits associated to the society and not to the individual.
3.1
Description of the empirical process
Our empirical analysis will be presented in two steps. In the first step we will present a model for estimating the costs and benefits associated to the immigrants. This is done to be able to account the amount associated to a population group in the society and to see how large the fraction of immigrants is, which the purpose of this thesis is. In the second part of this chapter we will apply our model to the real world. This will be done on local and national level. We will relate the model for Jönköping County on the local level and to Sweden on the national level.
3.1.1 How to look for Y, the rate at which the group of foreigners we are interested in located in the county or municipality in the year 2003
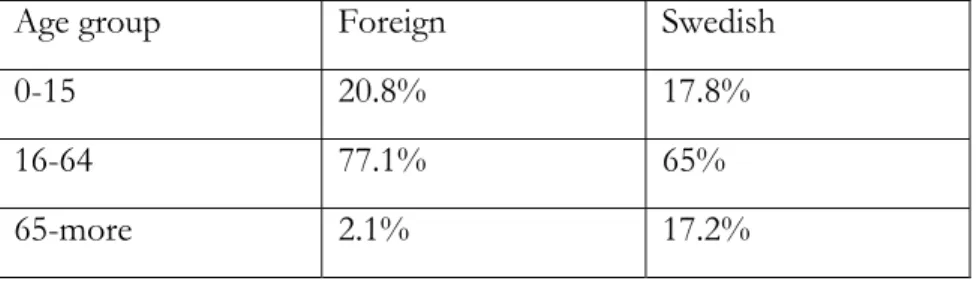
The first step in finding Y, is to look at the percentage at which foreigners enters Sweden in 2003. Since our study focuses on the age group 16-64, we look into the data1 and calculate the percentage of entry by age group. We find out that 77.1% of foreigners who entered Sweden in 2003 were in the age group 16-64, see the following table.
Table 3:1. Age distribution of Foreign and Swedish population in 2003
Age group Foreign Swedish
0-15 20.8% 17.8%
16-64 77.1% 65%
65-more 2.1% 17.2%
Source: SCB (2003), Population, (Page 121-122)
First of all, we would like to comment the above table. Foreigners in general are younger than Swedish. If we mainly focus on the group we are interested in (16-64) we notice that in terms of percentage a higher share of foreigners are in the “working age” compare to the Swedish. While on the other hand, a very high proportion of Swedish are in the retirement age. This could pose a threat in the future, concerning how to finance the increasing pension allocation of the elderly people.
Coming back to the determination of Y, here we took the total number of newly entered immigrants by age group and per year, which is partially displayed in Table 4 in the appendix, and divided it by the total number of immigrants during that same year as displayed in Table 3 in the appendix. This yields a yearly percentage for each age group.
an estimate of the percentage at which immigrants once in Sweden tend to locate in Jönköping. This is done by calculating the mean of the percentage at which immigrants located in Jönköping given their total number nationwide. We used data from Table 3 in the appendix.
Table 3:2. Immigrants’ location rates in Sweden in 2003. How immigrants located themselves once in Sweden.
Area 2003 Jönköping County 2.50 Uppsala County 3.21 Västmanlands County 1.78 Dalarna County 1.88 Gävleborgs County 2.16 Södermanland County 2.33
Source: SCB (2003), Population, (Page 122)
The choice of the counties listed above is motivated by the size of their population. Jönköping County and Uppsala County have relatively the same number, with the population slightly bigger in Jönköping l County than in Uppsala l County. However, we see immigrant tend to locate more in Uppsala than in Jönköping, especially in 2003. Maybe it is due to the close location of Uppsala County to Stockholm.
On the other hand, the counties of Västmanlands, Dalarna, Gävleborgs and Södermanland also have relatively the same population size. However, Gavleborgs län and Södermanland län received more foreigners in 2003 comparatively.
The figure 2.5 we have, here at the level of Jönköping County, is the Y we were searching for. In fact, to find Y, we took the total amount of immigrants who entered Jönköping County in 2003 divided it by the total amount of immigrants who entered Sweden the same year as displayed in Table3 in the appendix.
3.2
Costs associated to immigration
To determine an expected cost associated to foreign citizens using our model, we will use four sample cost categories which are explain as they occur in section 3.3, the list is not explicit and is only used to apply the model. We classify the costs as follows:
-Unemployment and social allowances -Education and Children allowances -Absence from work
3.3
Application of our model
In this part we will explain each cost and compare the costs incurred by foreigners in the county of Jönköping with the ones the incurred at the national level. We want to point out the fact that, the costs we use in this part may not be exhaustive. Consequently, the method remains valid, but the results may vary according to what inputs are considered as costs and how those costs are labelled.
Note: All the following costs are given annually and are costs that fall on the whole group. An application of our model:
Ce, j, k=f(X, Y, N, T) = X*Y*T/P= where T is the total cost for the entire population in the county (can also be applied at municipality level); X, Y are the same as expressed above. e is the cost (children allowance for instance) among immigrant of group j in the county (or municipality) k..
3.3.1 Unemployment and Social allowances
Unemployment benefits are intended to provide temporary financial assistance to unemployed workers who meet the requirements of the country law. In the majority of cases, benefit funding is based solely on a tax imposed on employers.
Social benefits are the sums of all allocations paid out by the government which sole purpose is to improve the living conditions of the receivers. Those allocations are paid out because of an earlier contribution made by the receivers, while others are just grants.
• Unemployment situation
The rate of unemployment varies considerably from one group to another and is given in terms of people who are in the labour force, but who do not actually have a job.
Nordic Citizens: 6.2% Other citizenship: 16% Citizens of Sweden 4.4%
The rate of unemployment is higher among the foreign citizens population in comparison to the rest of the population; and this cannot be explained by the lack of country specific skills or language knowledge. There are two reasons to this. The first is the fact that foreigners are on average less qualified than the native citizens, sometimes the qualification a foreigner has is not even recognised or translatable in the welcoming country. Another reason could be discrimination. It is true that the origin of a foreigner has a sound impact on his integration (Edin & Al, 2000).
Discrimination does not apply the same way to every foreign citizen; there are several reasons behind this, mainly because foreigners have different origins meaning qualifications different to the ones in the welcoming country. The labour market structure also plays an
In addition immigrants of second generation, those born in the country with at least one parent who is foreign born, have a higher unemployment rate than the Swedish. This can be explained by the lack of a real motivation from the policy makers to integrate them through appropriate employment network, the social origin of their parents and various types of discrimination according to their backgrounds. However, calling someone, who is born in a country, has that country citizenship; immigrant of second generation is in itself discriminatory. This means that regardless of to what degree his/her parents sacrifice; they will always be considered to be an immigrant, and their children, will be denoted with the term immigrant of third generation.
Unemployment insurance payments are proportional to the contributions paid by each individual, regardless of their country of origin. Therefore, the average amount of payments per recipient and the average amount of contributions cannot cause any differences between natives and immigrants. As Spencer, 1994, says, if there are differences between natives and foreigners, they should result from the probability of receiving an unemployment benefit. Consequently, calculating those figures will not result in anything relevant with to thesis. That is the reason why we just want to acknowledge that cost. In this section we used the figures from table 3:4, which reflect the situation on the market in order to obtain the figures displayed below. In other words, we took into consideration the market imperfections and the real labour situation. However, the beneficiaries of the different costs vary according to the foreigners’ status, employment situation. Therefore we need to calculate, in terms of percentages, the share of each group of beneficiaries in comparison to the total population in the country; we then take each share and multiply it by each cost in other to determine how much money accounted to the foreigners.
• Numerical application
T= total cost induced by both foreigners and citizens in 2003= 1 533 415 302 SEK
Nordic Citizens:
Xn=Number of Nordic citizens nationwide in the labour market but not employed in
2003=5000 Y=2.5%
P=Number of people in the county of Jönköping who are unemployed in 2003=8624
C
e, j, k=f(
X, Y, P, T)
=X*Y*T/P= 5000*2,5%*1 533 415 302/8624=22 225 987 SEKOther Foreign citizens:
X=Number of other citizens who are unemployed in 2003=25 000
The following Ce, j, k is given annually (year 2003) and is concerning the whole group of foreigners inducing unemployment and social allowances costs directly or indirectly.
C
e, j, k=f(
X, Y, P, T)
=X*Y*T/P=25 000*2.5%*1 533 415 302/8624= 111 129 935 SEKSweden
At this level we will make a comparison between the expected cost at the level of the county of Jönköping and at the level of the whole country. To determine an estimation costs associated to foreign citizens in our age group; we take the total cost incurred by foreigners in Sweden in general (as displayed in table appendix 1 below) and multiply it by the percentages of foreign citizens, and their age distribution in Sweden and the county of Jönköping as calculated in tables 3.2 and 3.10 respectively. We obtained at this level that the foreigners consumed 4.6% of the total cost (see table labour force structure in the appendix)
In order to compare the foreigners’ consumption in the county of Jönköping with the one at the national level, we need to express the cost at the level of Jönköping in relative terms and mix Nordic citizens with other citizens. From the calculations above we know the expected amount that is applied to the foreigners in Jönköping under social allowances. To find the percentage of those costs for both Nordic citizens and other foreign citizens, we have to sum up the two results to yield the percentage they represent in the total cost. We have:
(111 129 935+22 225 987) *100/1 533 415 302=8.7%
We see that, compared to the average level, foreigners consume more (8.7%) in terms of social allowances in Jönköping than they do on the national level (4.6%). One reason could be that some counties/municipalities have a very low rate of foreigners around, consequently driving the costs down at the national level.
3.3.2 Education and children allowances
Immigrants tend to migrate with their family. In those families, there are often under-aged children. In Sweden, there is a system of compulsory education for children under the age of 16. Moreover, education is provided free of charge to anyone. By sending their offspring to school, parents induce a cost to the system; sometimes increased by the fact that special arrangements are sometimes needed to put their children at the same level as the natives. An area we do not cover in this paper; since we rely on the fact school is compulsory until the age of 16, and we are interested in the age group 16-64.
However, we consider children allowances given to parents and the expenditures incurred by the fractions of immigrants who engage in a training program such as language program and/or practical training program.
Jönköping
T= Total expenditures on education and children allowances in the county of Jönköping in the year 2003= 822 384 080 SEK
C
e, j, k=f(
X, Y, P, T)
=X*Y*T/P= 822 384 080* 101 333*2,5%/63 564=32 775 881 SEKIn percentage terms, we have: 32 775 881*100/822 384 080=4%. Sweden
Applying the same procedure we find that foreigners at the national level consume 5.3% of the costs arising from children allowances. (See table children allowances in the appendix).
3.3.3 Absence from work
It is interesting to comment immigrants behaviours at work compared to the native and Nordic citizens. The authors would like to draw the readers’ attention to the fact that it is not everyone in age group 16-64, that is part of the labour force as. This can be explained by the fact that some are still studying, or might not have the country specific skills, among others reasons. This means that once a foreigner is identified as part of the labour force, it is indirectly mentioned that it has all the qualification to do so, such as the country specific skills, the knowledge of the language.
The cost is calculated partially given the availability of data. However, we just want to emphasize how such a cost can be calculated. In addition, while calculating the cost arising from absence from work, we assumed that everyone in the workforce induced the same amount of cost, regardless of whether he or she is a foreigner or a citizen, once absent from work. This means that the difference among Nordic citizens, other foreign citizens and Swedish citizens is made from the propensity of each group to be absent from work. In other words, it is the percentage of people absent at work from each group that will make the difference. The amounts of costs listed below are just to give a broad overview on how they are expected to look like. In reality, in addition to the propensity to be absent from work, the income level difference between the three groups will also make the difference.
Jönköping
Nordic Citizens=citizens from Denmark, Iceland, Norway and Finland
C
e, j, k=f(
X, Y, P, T)
=X*Y*T/P=ZT, where, Z=X*Y/PX=total Nordic citizens absent from work at the national level in 2003= 16 000 Y= the foreigners’ general location rate in the county of Jönköping in 2003=2.5%,
T= Total cost arising from absence from work in the county of Jönköping in 2003= 1 104 044 059 SEK obtained by summing all the costs arising from absence from work as displayed in tables 8 in the appendix.
P= Total number of persons absents from work in the county of Jönköping in 2003=26 827
The following Ce, j, k is given annually (year 2003) and is concerning the whole group of foreigners inducing costs arising from absence from work directly or indirectly.
C
e, j, k=f(
X, Y, P, T)
=X*Y*T/P=16000*2,5%*1 104 044 059/26 827= 16 461 685SEK
Other Foreign Citizens:
Xo= Total number of non-Nordic foreigners at the national level in 2003= 19 000 Y= Foreigners’ general location rate in the county of Jönköping in 2003= 2.5 Po= Total number of foreigners in the county of Jönköping in 2003=26 827
The following Ce, j, k is given annually (year 2003) and is concerning the whole group of non-Nordic foreigners inducing the costs arising from absence from work directly or indirectly.
C
e, j, k= 19 000*2.5%*1 104 044 059 /26 827= 19 548 250SEKIt is obvious that the expected cost can be higher if we include all of them in calculation process. The methodology is the same no matter what amount we have. However we want to point out for this cost as for any subsequent one that, if we remove X, the number of foreigners nationwide in the group we are interested in, out of the formula; we will result in cost per capita.
3.3.4 Health contribution
Health contribution covers people who do not pay contributions; family members of the contributor. The benefit in case of illness is the amount of contributions paid in the past. We would not however pay attention to the contribution amount paid by the contributor, since that contribution will be encompassed in one form or tax the employer/employee contribution we calculate in the benefits part.
T=total expenditures on health contribution in the county of Jönköping in 2003= 2 567 512 000 SEK
X=Total number of foreigners nationwide (here we assumed that any foreigner, non-Nordic and non-Nordic, induces a cost under the form of health contribution) in 2003= 476 195
P=Total population in the county of Jönköping in 2003=316 506
The following Ce, j, k is given annually (year 2003) and is concerning the whole group of foreigners inducing the costs arising from health contribution directly or indirectly.
C
e, j, k= X*Y*T/P=476 195*2.5%*2 567 512 000/316 506=96 572 922 SEK Sweden3.4
Benefits associated with immigration
As for the costs, it is difficult to put a price or a value on each benefit that could arise from immigration. Benefit such as cultural diversity, entrepreneurial spirit from owners of different shop and pizzeria for instance are benefits that are very difficult to quantify. However, we identified some costs on which we can put a value, such as Pension Insurance Contribution, Income and Value added taxes. We will take the example of Income Tax
3.4.1 Income Tax
Each individual exercising a rewarded activity, regardless of his country of origin, pay a fraction of his earnings in the form income taxes. This type of contribution is consequently only possible for immigrants who have a remunerated activity.
To know the real impact of foreign citizens at this stage we mainly focus on the number of those employed, since it is through earnings that taxes are collected. However, Ekberg, 1999, Edin, and Al, 2000, have demonstrated that immigrants average earnings is 20% lower than those of natives. However, we will not lose ourselves in calculation sin trying to figure out exactly how much foreigners earn in Jönköping. We can apply our model to derive the expected amount contributed by foreigners in Jönköping because of income tax. We use
B
since we talk now about benefits.B
will be the expected average yearly income tax contribution among foreigners.T= 11 100 000 000 SEK (SCB, labour market statistic, 2003) and is the total amount of money paid in Jönköping under the form of income during the year 2003.
X =221 000 and is Number of foreigners employed nationwide in 2003. Y is the location rate in Jönköping in 2003= 2.5%.
P= 157 289 and is the number of people employed in the county of Jönköping in 2003 including foreigners and citizens without distinction.
The following
B
e, j, k is given annually (year 2003) and is concerning the contribution made by the whole group of foreigners, Nordic and non-Nordic in 2003.B
e, j, k= X*Y*T/P=221 000*2,5%*11 100 000 000/157 289= 389 903 299 SEKIn percentage terms, the foreigners’ contribution of foreigners in Jönköping is: 389 903 299*100/11 100 000 000=3.5%
Sweden
At the national level, foreigners contributed a 3.3% of the total amount of income tax collected in 2003 (See table Tax collected in Sweden in the appendix).
4 CONCLUSION
We want to point out the fact that every time we estimate an expected percentage, it would be interesting to compare it to the actual figures in order to see if a county has a surplus in his total foreign population or not.
There are two ways of interpreting the results from our model. First of all the results can be used by the county or municipality in order to know its position in comparison to the national aggregate or other counties or municipalities. Second, the results can be use by the county or municipality to see if the expected figures are matching the actual ones. By doing so, a county or municipality could find out if it has more or less of what it is expected to have. The results can help the municipality or county to take appropriate action in this matter, since it will show if there is something incorrect somewhere.
The general perception is that immigration comes with higher costs than benefits; however, in general it is difficult to identify what a cost and what a benefit is, including how the cost or benefit arises. Putting an expected value on them is another difficulty. We have nevertheless shown that it is possible to estimate the different costs and benefits, so that they follow the same patterns as to have them match each other. By applying the model, we defined the costs and the benefits using the same method, by doing so there is not excess or decrease estimation.
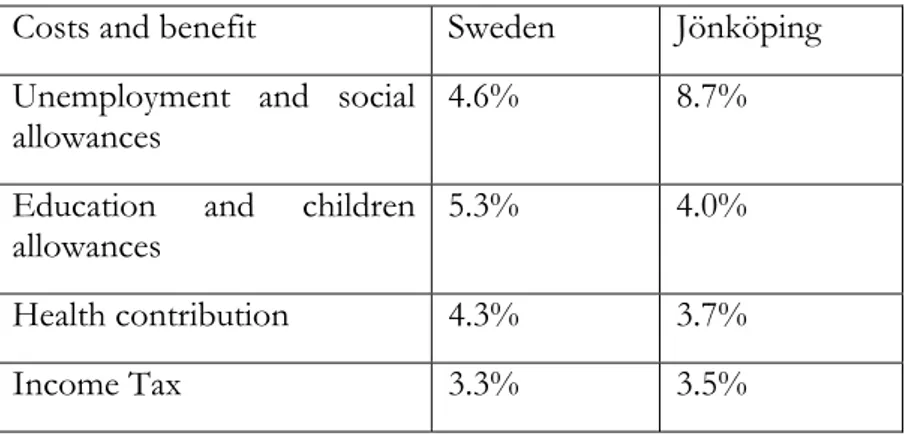
Table 4.1 Summary of the results showing the share of costs and benefit associated to immigrants.
Costs and benefit Sweden Jönköping Unemployment and social
allowances 4.6% 8.7%
Education and children
allowances 5.3% 4.0%
Health contribution 4.3% 3.7%
Income Tax 3.3% 3.5%
Figures from absence from work show that Nordic citizens working in Sweden induce a higher cost than the Swedish citizens, who in return induce a higher cost than foreigners with other citizens, do.
Observations from unemployment and social allowances show that at the national level, foreigners consume 4.6% of the expenditures falling under the social allowances while in Jönköping the consumption accounts for 8.7%. The cost is high relative to the participation of foreigners in the labour market. The disparity can be explained by low labour participation- and employment –rates, and by low rates of foreigners in some
both country level and national level. This is because, immigrants mainly migrate in the age group 16-64, and consequently there are few children in the migrating population.
Results from Health contribution show that at the country level, foreigners absorbed 4.3% of the health expenditures. Comparing that figures to the 3.7% we have at the level of the county of Jönköping, we can say that foreigners consume relatively less of the health expenditures in Jönköping than at the country level.
Figures are pretty much the same both in the county of Jönköping and in Sweden, when we apply the model to the income tax. However, comparing that share with the foreign population in each region the county of Jönköping and Sweden show that foreigners contribute less in both areas. Their number is higher than the actual contribution they could have made. This can be explained by the high ratio of unemployment among the foreign population.
The interpretations of the results done above, gives an outline of the immigration figures in Jönköping in comparison to the national aggregate level. In addition, regarding our purpose, is it possible to conduct an estimative model that can allow us to define those costs and benefits properly? We cannot answer the question at this level; we most certainly need the results of other tests to compare with ours, there is also a possibility that there are other ways to use our model of estimation. We have used our model in line with the data that has been available to us in this study, and highlighted how to interpret the results arising from it.
REFERENCES
Printed references
Behrenz, L 1989, En diskussion kring offentliga beslutskriterier och Cost Benefit Analys Högskolan i Växjö, Centrum för arbetsmarknadspolitisk forskning.
Borjas, G.J., (1990). Friends or Strangers: the impact of immigrants on the US economy, New York: Basic books/Inc publisher
Connolly, S., & Munro, A., (1999). Economics of the public sector, Essex-England: Pearson education limited
Edin, P.A., LaLonde, R.J., & Åslund, O., (2000). Emigration of immigrants and measures of assimilation: Evidence from Sweden. Working paper 2000:13 department of economics
university of Uppsala
Ekberg, J., (1999) Immigration and the public sector: Income effects for the native population in Sweden, Journal of population economics 1999.
Gramlich, M.E., (1990). A guide to Benefit-Cost Analysis, (2nd Ed.). Illinois: Waveland Press Inc
Jönköpings Kommun, (2005)., Statistisk årsbok 2005, Arbetsmarknad, näringsliv och utbildning, Retrieved 2006-06-02 from
http://www.jonkoping.se/download/18.272b7d6e109e501462f80007602/Arbetsmarknad %2C+n%C3%A4ringsliv%2C+utbildning.pdf
Milton, L (2006) Figures from Försäkringskassans database, collaborated by Leif Milton, Jönköping
Niklasson, H 1976, Cost Benefit Analys i teori och praktik Universitetsfilialen i Växjö, Riksbankens jubileumsfond
Premie Pensions Myndigheten, PPM (2006).Retrieved 2006-06-02 from
http://www.ppm.nu/tpp/infodocument/1:1;74,73,75
Spencer, S., (1994), Immigration as an economic asset: the German experience. London: Trentham Books Limited
Sugden, Robert, & Williams, Alan (1978). The principles of practical cost-benefit analysis. Oxford University Press, Great Britain
SCB (2003), Befolkningsstatistik (www.scb.se). Migrationsverket, Statistiska meddelanden, serie BE 65 (2000); SCB Statistiska meddelanden
SCB (2004), Labour Market . (www.scb.se): Arbetskraftsundersökningarna (AKU).
http://en.wikipedia.org/wiki/VAT
Appendix
Table 1. Total cost paid by Försäkringskassan Year 2003
Area Sweden
Jönköping
County Total Cost of Insurance 383 600 736 312 13 130 530 427
Economic Family Politics 51 740 593 481 1 836 673 378
Children’s contribution 20 957 934 880 815 552 902
Alimony support 4 120 497 959 117 572 285
Rental contribution 3 547 436 511 94 060 009
Adoption cost contribution 41 074 184 1 480 000
Child pension 1 044 577 909 34 678 534
Pregnancy allowance 380 901 367 16 838 788
Paternity allowance 15 689 780 982 554 724 995
Temporary paternity allowance 3 915 113 697 137 611 548
Health care contribution 2 043 275 992 64 154 317
Handicap Politics 11 405 314 057 425 754 503
Car support compensation 240 187 951 9 065 889
Assistance compensation 11 165 126 106 416 688 614
Compensation when unable to work 100 387 805 941 3 052 744 612
Sick money 39 948 746 169 1 104 089 541
Voluntary insurance 1 771 896 80 654
Next of kin allowance 65 091 272 2 795 971
Rehab allowance 2 180 902 011 111 043 250
Special contribution – rehab 44 526 425 1 895 648
Special contribution - activity compensation 841 744 5 667
Working aid 55 646 862 3 252 752
Sickness through working allowance 28 150 893 1 231 840 Working injury, life insurance 5 032 859 394 214 471 685
Sick compensation 49 566 191 853 1 529 599 995
Activity compensation 249 731 467 8 080 902
Additional rent aid for people with
sickness- and activity compensation 1 200 753 783 43 883 067
Handicap compensation 5 600 014 930 81 580 999
Purchasing rehab service 176 405 223 3 775 669
Collaboration within the rehab-area 45 345 507 615 884
Special rehab work 2 782 431 909 40 568 250
Further measures against unhealthy 2 595 832 291 36 621 196
Health- and Sick- care Politics 181 709 361 3 819 384
Dental care 155 632 502 3 384 140
Compensation for contagious 26 076 859 435 244
International healthcare 9 621 200 003 224 258 835
Further Contributions 37 484 425 2 604 611
Family contribution 9 497 141 632 220 949 014
Activity support 4 848 265 27 851
Small business insurance 31 992 897 509 074
Vacation wage insurance 643 363 19 509
Table 2. Immigrants coming to Jönköping and Sweden
Area 2000 2001 2002 2003
Jönköping 1 378 1 536 1 636 1 589
Sweden 58 689 60 795 64 087 63 795
Source: SCB (2003), Population, (Page 119)
Table 3. Immigrants age structure in the year 2003, for the whole country Age structure 2003
0-15 13 243
16-64 49 191
65- + 1 361
Source: SCB (2003), Population, (Pages 119-120)
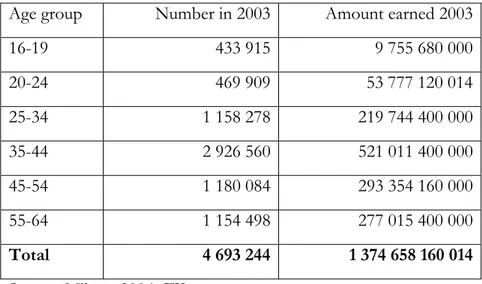
Table 4. Labour force structure and total income by age
Age group Number in 2003 Amount earned 2003 16-19 433 915 9 755 680 000 20-24 469 909 53 777 120 014 25-34 1 158 278 219 744 400 000 35-44 2 926 560 521 011 400 000 45-54 1 180 084 293 354 160 000 55-64 1 154 498 277 015 400 000 Total 4 693 244 1 374 658 160 014 Source: Milton, 2006, FK
Table 5. Social Allowances
Area Sweden Jönköping County
Voluntary insurance 71 945 1 816
Sick allowance 1 622 300 429 40 963 085
Next of kin allowance 2 643 326 66 744
Activity compensation 34 182 863
Working aid 2 259 793 57 059
Activity compensation 10 141 481 256 072
Additional rent aid 48 762 065 1 231 242
Purchasing rehab service 7 163 735 180 884
Collaboration within the rehab area 1 841 460 46 496
Special rehab work 112 993 295 2 853 080
Activity support 196 885 4 971
Small business insurance 1 299 212 32 805
Vacation wage insurance 26 126 659
Source: Milton, 2006, FK
Table 6. Children allowances
Area Sweden Jönköping county
Adoption cost contribution 1 666 746 42 085
Pregnancy allowance 15 456 566 390 278
Paternity allowance 636 674 367 16 076 027
Table 7. Health expenditures
Area Sweden Jönköping county
Health contribution 82 977 636 2 095 185
Rehab allowance 88 565 439 2 236 277
Special contribution-rehab 1 808 197 45 656
Sick by working allowance 1 143 194 28 865
Working injury, life insurance 204 382 133 5 160 648
Working injury insurance 37 559 496 948 377
Sick compensation 2 012 860 528 50 824 728
Further measure against unhealthy 105 415 569 2 661 743
Dental care 6 320 158 159 583
Compensation for contagious 1 058 968 26 738
Source: Milton, 2006, FK
Table 8. Social Allowance
Area Sweden Jönköping County
Beneficiary: Persons at work 15 886 663 526 961 Voluntary insurance 77 254 3 548 Activity support 223 020 1 225 Activity compensation 37 720 250
Working aid 2 559 755 143 121
Activity compensation 11 487 647 355 560 Small business insurance 1 471 673 22 399 Vacation wage insurance 29 594 858
Beneficiary: absent from work 168 750 897 2 437 636 Special rehab work 100 321 492 88 191 Additional rent aid 55 234 674 2 018 621 Purchasing rehab service 8 114 640 173 680 Collaboration within the rehab area 2 085 893 28 330 Next of kin allowance 2 994 198 128 814 Source: Milton, 2006, FK
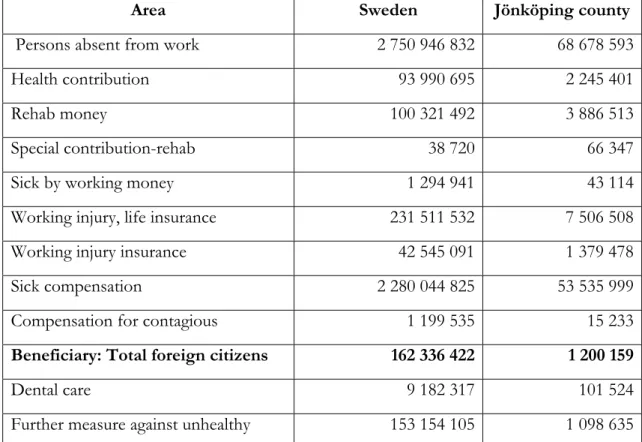
Table 9. Health expenditures
Area Sweden Jönköping county
Persons absent from work 2 750 946 832 68 678 593
Health contribution 93 990 695 2 245 401
Rehab money 100 321 492 3 886 513
Special contribution-rehab 38 720 66 347
Sick by working money 1 294 941 43 114
Working injury, life insurance 231 511 532 7 506 508
Working injury insurance 42 545 091 1 379 478
Sick compensation 2 280 044 825 53 535 999
Compensation for contagious 1 199 535 15 233
Beneficiary: Total foreign citizens 162 336 422 1 200 159
Dental care 9 182 317 101 524
Further measure against unhealthy 153 154 105 1 098 635 Source: Milton, 2006, FK
Table 10. Immigrants (Age group 16-64)
Area 2000 2001 2002 2003
Jönköping 1 378 1 536 1 636 1 589
Sweden 58 689 60 795 64 087 63 795
Source: SCB (2003), Population, (Page 119)
Table 11. Emigrants (Age group 16-64)
Area 2000 2001 2002 2003
Jönköping 701 738 721 660
Sweden 34 091 32 141 33 009 35 023
Table 12. Reproduction rate in Sweden by county Counties Average births per
household Percentage of birth with at least one foreign parent
Stockholms län 1.80 22 Uppsala län 1.87 13 Södermanlands län 1.85 13 Östergötlands län 1.84 13 Jönköpings län 1.92 14 Kronobergs län 1.87 1 Kalmar län 1.86 9 Gotlands län 1.85 4 Blekinge län 1.81 9 Skåne län 1.84 19 Hallands län 1.89 10 Västra Götalands län 1.84 15 Värmlands län 1.82 8 Örebro län 1.85 14 Dalarnas län 1.85 6 Gävleborgs län 1.79 7 Västernorrlands län 1.82 6 Norrbottens län 1.82 6 Sweden 1.94 11
Table 13. Unemployment and Social benefits
Area Sweden
Unemployment and Social Benefits as a percentage of total expenditure in the area in 2003
4.6%
Voluntary insurance 71 945
Sick money 1 622 300 429
Next of kin money 2 643 326 Special contribution-Activity
compensation 34 182 Working aid 2 259 793 Activity compensation 10 141 481 Additional rent aid for people with
sick-and activity compensation 48 762 065 Purchasing rehab service 7 163 735 Collaboration within the rehab area 1 841 460 Special rehab work 112 993 295 Activity support 196 885 Small business insurance 1 299 212 Vacation wage insurance 26 126 Source: Milton, 2006, FK
Table 14. Children Allowances
Area Sweden
Children allowances as a percentage of total expenditure in the area in 2003
5.3%
Adoption cost contribution 1 666 746 Pregnancy money 15 456 566 Paternity money 636 674 367 Temporary paternity money 158 871 085 Source: Milton, 2006, FK
Table 15. Health expenditures
Area Sweden
Health expenditures as a percentage of total expenditure in
the area in 2003 4.3%
Health contribution 82 977 636
Rehab money 88 565 439
Special contribution-rehab 1 808 197 Sick by working money 1 143 194 Working injury, life insurance 204 382 133 Working injury insurance 37 559 496
Sick compensation 2 012 860 528
Further measure against unhealthy 105 415 569
Dental care 6 320 158
Compensation for contagious 1 058 968 Source: Milton, 2006, FK
Table 16. Tax collected in Sweden
Area Sweden
Amount of tax collected as a percentage of the total
amount in the area. T=33% 3.3% Total earning population in
Area
1 374 658 160 014 Total earning foreigners 45 692 400 000
Avg. Amount of tax
collected in the area 453 637 192 800 Avg. amount tax paid by
foreigner
15 078 492 000