Swedish EPA SE-106 48 Stockholm. Visiting address: Stockholm – Valhallavägen 195, Östersund – Forskarens väg 5 hus Ub. Tel: +46 10-698 10 00,
Impact assessment of
global megatrends
Two case studies connecting global
megatrends to regional topics
UllrIch lorenz and hördUr V. haraldssonrEport 6602 • february 2014
Swedish EpA Se-106 48 Stockholm. Visiting address: Stockholm - Valhallavägen 195, Östersund - forskarens väg 5 hus ub, .
The authors assume sole responsibility for the con-tents of this report, which
therefore cannot be cited as representing the views of the Swedish ePa.
global megatrends
Two case studies connecting global
megatrends to regional topics
This report gives an overview how global megatrends can influence topics on resource scarcity on EU regional and local level.
The report demonstrates in two case studies how qualitative modelling (Causal Loop Diagrams) and system thinking approach can be applied to analyse the possible impact of global megatrends upon resource scarcity in an EU perspective and how they impact the Swedish environmental objectives on a local level.
SWEDISH ENVIRONMENTAL PROTECTION AGENCY
Two case studies connecting global megatrends to regional topics
Ullrich Lorenz Hördur V. Haraldsson
Internet: www.naturvardsverket.se/publikationer
The Swedish Environmental Protection Agency
Phone: + 46 (0)10-698 10 00, Fax: + 46 (0)10-698 10 99 E-mail: registrator@naturvardsverket.se
Address: Naturvårdsverket, SE-106 48 Stockholm, Sweden Internet: www.naturvardsverket.se
ISBN 978-91-620-6602-4 ISSN 0282-7298 © Naturvårdsverket 2014 Print: Arkitektkopia AB, Bromma 2014
Cover photo: Hördur Haraldsson
Acknowledgements
We would like to thank Owen White (Collingwood Environmental Planning Ltd) for the texts he contributed and the good discussions we had with him about alternative ways of thinking about economic systems; Jens Günther (UBA, Federal Environment Agency) for contributing to the overview of European resource efficiency policy; Jan Kosmol (UBA, Federal Environment Agency) for his critical comments on the concepts of resource scarcity.
Furthermore, we would like to thank Harald Sverdrup, Deniz Kozca and Salim Belyazid from Lund University for the great discussions we had with them about model architecture and Kai Neumann for advising us on how to use the Consideo Modeler and iModeler in our assessment.
We would also like to thank our Swedish colleagues at SEPA for critically reviewing the manuscript.
Last, but not least, we would also like to thank the EEA (Teresa Ribeiro and Anita Pirc Velkavrh) as well as Jan Bakkes (PBL NL), Alexander Storch and Günther Pfaff (Umweltbundesamt AU), Mirek Havranek (Cenia, CZ), Marleen Van Steertegem (Flemish Environment Agency, Anabelle Berger (Ministère du Développement durable)and Barbara Bernard Vukadin (Slovenian Environment Agency) for the stimulating discussions during the Article 5 Project and the EIONET FLIS-Network.
This publication is available as a download at:
https://www.umweltbundesamt.de/publikationen/an-assessment-of-the- possible-impacts-that-global
or
www.naturvardsverket.de/publikationer
The views expressed in this report are those of the authors and do not neces-sarily represent the views of the Federal Environment Agency Germany or the Swedish Environmental Protection Agency.
Federal Environment Agency Germany – Umweltbundesamt Wörlitzer Platz 1 06844 Dessau-Roßlau Germany Phone: +49-340-2103-0 Fax: +49-340-2103-2285 E-Mail: buergerservice[at]uba.de
The Swedish Environment Protection Agency
Naturvardsverket SE-10648 Stockholm Sweden Phone: +46 (0)10-698 10 00 Fax: +46 (0) 10-69810 99 E-Mail: registrator[at]naturvardsverket.se
Main Authors: Ullrich Lorenz (UBA GE) and Hördur V. Haraldsson (SEPA) Proof reading: Ms Gunilla Zedigh, zedigh@aol.com
Preface
October 2013 Dear reader,In today’s world, the ever-increasing speed of technological, economic, social and environmental change is a challenge to policymakers and society at large. At the same time, the complexity of the systems in which we live is also expanding. And this means that in order to make effective decisions and to learn insightfully about the complexity that surrounds us, we should or even must become systems thinkers – we must push the boundaries of our mental models and develop approaches that make the complexity at hand more com-prehensible – and our policy more effective.
Taking a closer look at global megatrends – as described in the State of the Environment Report issued by the European Environment Agency – is a good starting point, as these trends can serve to sensitise and alert us about both the future developments and the challenges that we will one day face. However, as useful as such a foresight analysis might be, the question remains: What does this kind of global development mean for regions or even for local towns and villages? How do these developments interact?
In order to be able to answer this kind of question it is necessary to get a systemic understanding how the global megatrends are connected and how they influence each other. Such an assessment allows us to understand a part of the complexity of our interconnected world. And this will help us to find the right anchors to attach the most effective policy measures.
This report is a contribution to that kind of analysis and addresses this very question: How is it possible to assess the impacts of global megatrends on a regional or local scale? This report was created jointly by two European Environment agencies and is the first of its kind.
This report presents the findings of two case studies that are based on the same kind of systemic thinking and the same methodology. And it incor-porates what is known about global megatrends. Although the case studies and the underlying models are quite different from each other, the results can easily be compared and the message is quite clear: global megatrends may have a different impact on various regional issues such as resource use and resource scarcity. Nearly all global developments will put additional pressure on our ecosystems and society – also on a regional scale.
It is our hope that this fruitful international cooperation is just the beginning of many more rewarding exchanges and collaborations between the different European Environment agencies.
Dr Harry Lehmann Eva Thörnelöf
Head of the Environmental Planning and Sustainability Strategies
Department
Head of the Research and Assessment Department Federal Environment Agency,
Germany
Swedish Environmental Protection Agency, Sweden
that ran between June 2011 and March 2012. One of the main aims of the EEA project was to provide examples of how the evaluation of global megatrends presented in the State of the Environment Report (SOER) 2010 could be applied to regional issues such as resource scarcity and environmental goals. We, the authors, have extensive experience in systems thinking and systems dynamic modelling techniques, and thus immediately saw the huge potential for applying qualitative modelling (causal loop analysis).
When the EEA’s GMT Report was released, we immediately recognised that there were similarities, overlaps and connections between the different GMTs. So, for us, it was only logical to begin building an initial system designed especially for the GMTs by identifying common drivers and variables. However, this turned out to be a rather complex project. Nevertheless, the mini project encouraged us to apply the same methodology to this joint project. While the main focus of the project funded by the EEA was on capacity build-ing and how to use systems thinkbuild-ing, there was an intensive exchange of ideas between the two agencies (UBA, the German Federal Environment Agency and SEPA, the Swedish Environment Protection Agency) to delve deeper into quali-tative modelling in order to analyse the challenges posited by resource scarcity from different perspectives. Taking an additional general perspective, we ana-lysed how the GMTs might influence scarcities and from yet another perspec-tive, we looked at how the GMTs would influence the system of sustainability indicators in Sweden. Both projects were run independently from the EEA project, but despite the fact that they were continued individually, there was a great deal of exchange. While some results were presented in the final report of the EEA project1, the insights and results have been far more extensive – and
to a certain extent – quite complex. We therefore decided to elaborate on the joint report in order to share more of the details of the respective models and the insights we gained.
Finally, we would like to thank the entire team and the EEA for making the fruitful and lively exchange possible.
Ullrich Lorenz and Hördur V. Haraldsson
i European Environment Agency Service Contract 3534/b2011/EEA54586, based on Article
Abstract
This report gives an overview how global megatrends can influence topics on regional and local level. The report demonstrates how qualitative modelling and system thinking approach can be applied to analyse the possible impact of global megatrends to the regional topic of resource scarcity, demonstrated in two case studies.
In the first case study, a generic qualitative model is developed to explain a general pattern of resource scarcity on a EU regional scale. Typical entry points of political measures are shown as well as how the eleven global meg-atrends – described by the European Environment Agency – can be connected to such a model. Potentially, some of the global megatrends will increase the problem of resource scarcity while others will put relieve on the challenge. A third group of megatrends has apparently now impact on the resource scarcity pattern. In the same way, the possible impact of the policy measure can be compared.
In the second case study, a qualitative model is built to explain the impact of the global megatrends upon the Swedish environmental goals. The case study illustrates how the different scales: local, EU regional and the global scale connect through the megatrends, and how they impact the possibility of fulfilling the Swedish environmental goals.
In conclusion, we are able to demonstrate that the global megatrends put in nearly all cases more burden to environmental challenges respectively the environmental goals. The potential impact of global megatrends differs in time and spatial scale. Generally, the methodology of qualitative modelling has proven to be a powerful approach to assess the potential impact of global megatrends to regional or concrete topics as well as to assess the potential impact of policy measures in terms of goal reaching.
Svenskt sammanfattning
Denna rapport ger en översikt hur globala megatrender kan påverka ämnes-området resursbrist på EU:s regionala och lokala nivå. Rapporten visar hur kvalitativ modellering och systemtänkande/systemanalys som tillvägagångssätt kan tillämpas för att analysera möjliga effekter av globala megatrender inom ämnesområdet resursbrist i ett EU perspektiv och hur det påverkar förut-sättningarna för att uppfylla de svenska miljömålen. Rapporten demonstrerar tillämpningen i två fallstudier.
globalen Megatrends auf regionale und lokale Themen bewertet werden kann. Hierfür wird die Methode der qualitativen Modellierung basierend auf „systemischem Denken“ in zwei Fallstudien angewendet.
In der ersten Fallstudie ist ein qualitatives Modell entwickelt worden, um das Grundmuster von Ressourcenknappheit in einem Wirtschaftsraum wie Europa zu erklären. Hiermit können sowohl Ansatzpunkte für mögliche Politikmaßnahmen gezeigt als auch demonstriert werden, wie die globalen Megatrends – beschrieben von der Europäischen Umweltagentur – ein solches System beeinflussen können. Dabei wird deutlich, dass einige der Megatrends die Knappheit von Ressourcen eher verstärken, während andere das Problem eher verringern (scheinbar) und schließlich eine dritte Gruppe kaum Einfluss auf die Frage der Ressourcenknappheit entwickelt. In gleicher Art kann der potentielle Einfluss von Politikmaßnahmen verglichen werden.
In der zweiten Fallstudie geht es darum, den potentiellen Einfluss der globalen Megatrends auf die Schwedischen Umweltziele zu bewerten. Dabei wird deutlich, wie die verschiedenen Skalen, lokal, EU regional und die globale Skala miteinander interagieren und dabei in unterschiedlicher Weise die Erreichung der schwedischen Umweltziele beeinflussen.
In beiden Fallstudien kann gezeigt werden, wie die globalen Megatrends die Erreichung der umweltpolitischen Ziele erschweren und zentrale
Umweltprobleme tendenziell verschärfen. Dabei kommt die Wirkung der globalen Megatrends in unterschiedlichen zeitlichen und räumlichen Skalen zum Tragen. Insgesamt hat sich gezeigt, dass die hier angewandte Methode der qualitativen Modellierung sehr gut dafür geeignet ist, den möglichen Einfluss von globalen Megatrends auf lokale bzw. regionale Themen zu bestimmen.
Contents
FOrEwOrd by ThE AuThOrS 6
1 InTrOducTIOn 15
1.1 Global megatrend analysis by the EEA 16
1.2 Basic aspects of systems thinking 18
1.2.1 Basic approach 18
1.2.2 Some more theoretical background 21
1.2.3 The use of software tools 22
2 cASE STudy I: “POSSIblE ImPAcTS OF glObAl mEgATrEndS On rESOurcES ScArcITy (gEnErAl cOncEPT FrOm ThE
PErSPEcTIvE OF nOrThErn EurOPE)” 24
2.1 Introduction 24
2.1.1 Purpose of the study 24
2.1.2 Resources and resource efficiency policy in the EU 24
2.1.3 Overview of the model on resource scarcity 27
2.2 Understanding the system: resource use, types of scarcity and
common approaches 28
2.2.1 Scarcity – identifying the problem 28
2.2.2 Increasing efficiency 31
2.2.3 Balancing effects – a key to understanding rebound effects 32
2.2.4 Ambivalence of impacts and effects 35
2.3 Possible impacts of global trends 35
2.3.1 GMTs possibly increase resource scarcity 38
2.3.2 GMTs may possibly decrease resource scarcity 39
2.3.3 GMTs with apparently no impact 40
2.3.4 GMTs change their impact over time 40
2.4 Assessment of the impacts of measures that prevent resource scarcity 41
2.4.1 General measures and strategies to deal with resource scarcity –
a look at EU strategies 41
2.4.2 Measures in the model 43
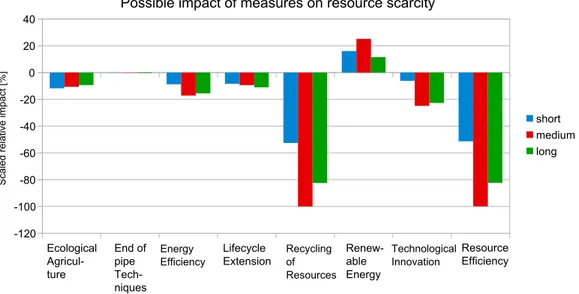
2.4.3 Understanding the special role of recycling and resource efficiency 44
2.4.4 Understanding decreasing impacts 44
2.4.5 Understanding the counterintuitive impact of renewable energy 45
2.5 First conclusions and reflections 45
3 cASE STudy 2: lInkIng glObAl mEgATrEndS TO SwEdISh
EnvIrOnmEnTAl ObjEcTIvES 48
3.1 Purpose and goals of Case Study II 48
3.2 The Swedish environmental objectives 49
3.4 Drivers and feedback regarding resource scarcity and the focus
points of the Generation Goals (GGs) 51
3.4.1 Resource scarcity 52
3.4.2 Generation Goals 52
3.5 Results and analysis 56
3.5.1 The analysis of the possible impacts of GMTs on resource scarcity 56
3.5.2 Ecosystems have recovered 58
3.5.3 Biodiversity and the natural and cultural environment are conserved 59
3.5.4 Human health 60
3.5.5 Material cycles 61
3.5.6 Natural resources are managed sustainably 62
3.5.7 Consumption 63
3.5.8 Renewable Energy 64
3.5.9 Summing up the impact that the GMTs have on the Swedish GGs’
focus points 65
3.6 Using GMTs for assessing the Generation Goals’ focus points 66
3.7 Recommendations for the further development of GMT analysis 68
4 OvErAll cOncluSIOnS/rEcOmmEndATIOnS 69
4.1 Comparing the two case studies – understanding commonalities
and differences 69
4.1.1 Comparing models 69
4.1.2 Comparing some key results 70
4.2 Lessons learned, limitations and potential 71
4.2.1 Some words on qualitative modelling 71
4.2.2 Some words on GMTs 72
4.3 Final recommendations and conclusions: 73
5 AnnEX: mOdEl dOcumEnTATIOnS 74
5.1 Case Study 1: generic model on resource scarcity 74
5.2 Case Study II: basic modules 80
5.2.1 The building module: 80
5.2.2 The energy module:. 80
5.2.3 The food production module: 81
5.2.4 The forest module: 82
5.2.5 The basic mineral module: 83
5.2.6 The basic mobility module: 84
List of figures
Figure 1. An example of making causal relations visible with a CLD. 19
Figure 2. An illustrative example of a balancing feedback loop on the left side
and a reinforcing loop on the right side; excerpt from the model. 20
Figure 3. An Insight Matrix of the possible positive or negative impacts of
GMTs on resource scarcity. 21
Figure 4. An example of how an Insight Matrix can be transformed into a bar
chart. 22
Figure 5. An overview of the qualitative model on resource scarcity. 28
Figure 6. An excerpt from the model showing the central factor resource
scarcity in northern Europe and the first levels of the model. 29
Figure 7. An excerpt from the bigger model – profit for industry/economy is
a central factor that influences the export of both resources and
products. 30
Figure 8. An excerpt from the model – an example of a balancing loop. 32
Figure 9. An extended basic balancing structure. 33
Figure 10. Causal loop diagram showing the relationship between a rebound
effect and economic growth. 34
Figure 11. A bar chart of possible impacts of the GMT on resource scarcity in
northern Europe based on the Insight Matrix. 37
Figure 12. CLD of an extended archetype limit to growth with some analogy to
shifting the burden. 41
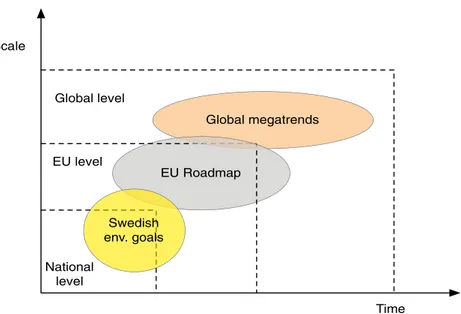
Figure 13. A chart showing the possible relative impact of a measure on the main factor resource scarcity. 43 Figure 14. An illustration of three different geographical and temporal scales. 48 Figure 15. An overview of the 16 Environmental Quality Objectives – ill. by
Tobias Flygar. 50
Figure 16. The subsystems of the model for Case Study II. 51
Figure 17. Factors that have a direct impact on resource scarcity. Grey areas
indicate variables that belong to the EU regional level. 52
Figure 18. Factors that have a direct impact on the GG ecosystems have
reco-vered. 53
Figure 19. Factors that have a direct impact on the GG biodiversity and
cul-tural environment. 53
Figure 20. Factors that have a direct impact on the GG human health. 54 Figure 21. Factors that have a direct impact on the GG material cycles. 54 Figure 22. Factors that have a direct impact on the GG natural resources. 55 Figure 23. Factors that have a direct impact on the GG share of renewable
energy. 55
Figure 24. Factors that have a direct impact on the GG patterns of consumption. 56 Figure 25. An Impact Matrix of the GMTs on resource scarcity in northern
Europe. 57 Figure 26. The impact of the GMTs on resources scarcity in northern Europe
Figure 27. The impact of the GMTs on the Swedish Generation Goals’ focus point ecosystems have recovered shows that environmental trends
have an overwhelmingly negative impact. 59
Figure 28. The impact of the GMTs on the Swedish Generation Goals’ focus point biodiversity and the natural and cultural environment are
con-served shows that all of the megatrends, except for GMT 3, GMT 4
and GMT 11 have an overwhelmingly negative impact. 60
Figure 29. The impact of the GMTs on the Swedish Generation Goals’ focus point human health shows that all of the megatrends except for
GMT 11 have an overwhelmingly negative impact. 61
Figure 30. The impact of the GMTs on the Swedish Generation Goals’ focus point material cycles shows that most of the megatrends have a
generally positive impact. 62
Figure 31. The impact of the GMTs on the Swedish Generation Goals’ focus point natural resources shows that the economic trend GMT 5 as well as the population trend GMT 2 have a strong negative impact. 63 Figure 32. The impact of the GMTs on the Swedish Generation Goals’ focus
point patterns of consumption of goods and services cause the least
possible problems for the environment and human health shows
that GMT 7 has a strong positive effect. 64
Figure 33. The impact of the GMTs on the Swedish Generation Goals’ focus point the share of renewable energy increases and use of energy is
efficient, with minimal impact on the environment shows that the political trend GMT 11, the economic trend GMT 7 and the
techno-logical trend GMT 4 all have a strongpositive impact. 65
Figure 34. The influence of the megatrends over geographic scales and short, medium and long-term perspectives on the Generation Goals’ focus points. 67 Figure 35. An example of how GMTs are connected in the different models. In
Model I, the GMT is “only” linked to the model, while in Model II,
the GMTs are interconnected. 69
Figure 36. An excerpt from model showing regional availability of resources. 75
Figure 37. An excerpt from the model showing part of the economic system as
represented in the mode. 77
Figure 38. An excerpt from the model showing production and use of resources
as the central factors. 79
Figure 39. The basic feedback loops of the building module. 80
Figure 40. The basic energy system module has one reinforcing feedback loop and four balancing feedback loops (modified from Dawson 2012). 80 Figure 41. The food production system consists of three balancing loops and
two reinforcing loops. 81
Figure 42. The basic forest module. 82
Figure 43. The basic mineral module. 83
List of tables
Table 1. A list of the global factors in the generic model for resource scarcity. 36 Table 2. A list of factors in the generic model for resource scarcity which
in-dicate the factors’ regional particularities in relation to the specific
global trend. 36
Table 3. A list of the general approaches/measures to counteract the overall
challenge of resource scarcity. 43
Table 4. The weighted Impact Matrix of the GMTs’ effects on the Generation
Goals’ focus points and on resource scarcity. 66
Table 6. An overview comparing metadata of the two case study models. 69
Table 7. A comparison of the orientation of impacts of the GMTs in terms of
1 Introduction
In the SOER 2010 Assessment of Global Megatrends (GMTs) Report, the European Environment Agency (EEA) describes a set of 11 GMTs on a global scale. In the SOER GMTs Report, an analysis of “why GMTs are important” can be found delineated in a small box. An equally short description is also included for each of the potential impacts (or risks) that the GMTs have on the environment in Europe.
On the whole, the environment in Europe is very broad in scope and also quite diverse, and so the analysis of what exactly has an impact on it will also be quite broad in scope and general. It was therefore agreed upon that it would be far more insightful to examine the impacts and implications on a smaller scale: hence, an examination at the regional level was proposed, which is reflected in the case studies that we developed.
One practical approach was identified to help develop an understanding of the complexity of the GMTs and their interaction with specific issues. The approach is called qualitative modelling. Through qualitative modelling, it is pos-sible, in principle, to show the causes and effects of the drivers of a particular megatrend and also to show the interconnections between different megatrends.
The introductory section of the SOER 2010 Assessment of Global
Megatrends2 entitled “Why assess global megatrends?” states that “The
com-plexity of interlinkages and the manifold uncertainties inherent in megatrends require an exploratory, qualitative approach underpinned by empirical data.” The comments included in the SOER 2010 Assessment of Global Megatrends
Report on how the GMTs were established and defined give a clear indication
of the huge challenge that one is faced with when it comes to adequately pre-senting results. There are distinct challenges and difficulties in prepre-senting such an assessment: How best to present all of the expert knowledge and at the same time be as comprehensive as possible? How best to show ambivalences in interpretation? How best to reflect dynamics or changes over time without carrying out complex quantitative modelling sessions?
The aim of this task was to develop a systemic understanding of resource scarcity from a regional EU perspective, defining exactly what it consists of and which role global developments (i.e. GMTs, as described in the SOER
2010 Report of the EEA) might play.
This report presents two different case studies that were carried out inde-pendently from each other. One focuses on resource scarcity in relation to global megatrends from a more general perspective and on an EU level, and the other focuses on Sweden and its environmental goals. The main questions for each case were as follows:
Case Study I: What long-term impacts do the global megatrends have on regional resource scarcity in the EU with a focus on northern Europe?
Case Study II: What long-term impacts do the global megatrends have on the Swedish environmental goals and what are the implications from a local, regional and global perspective?
1.1 Global megatrend analysis by the EEA
In November 2010, the EEA published its flagship report The EuropeanEnvironment – State and Outlook 2010. As part of this publication an
explor-atory assessment of global megatrends relevant to the European environment was undertaken, and published3. The assessment sought to apply a
global-to-European perspective on key global developments over the coming decades, recognising that Europe’s environmental challenges and management options are increasingly influenced by global drivers such as demographic change, technological development, international trade and changing patterns of con-sumption. Thus it is important that European environmental policymaking and planning decisions are made with these forces for change in mind. Box 1. A definition of the word “megatrend” according to the EEA in 2007.
Megatrends are those trends visible today that are expected to extend over decades, changing slowly and exerting considerable force that will influence a wide array of areas, including social, technological, economic, environmental and political dimensions.
EEA, 2007
The EEA GMTs Report recognises that there exist many ways to assess and present global megatrends, and that diverging views are valid and to be expected. “Diversity, complexity and uncertainty” is recognised in the report as being inherent to such an analysis, and that the aim of the EEA GMTs Report was to present a coherent analysis based on a structured methodological pro-cess. The aim was also to draw some key conclusions for Europe. The adopted approach included the following:
• A public call for evidence.
• The establishment of an external advisory group. • A review of academic and non-academic literature.
• The creation of an information base, structured by the STEEP (social, technological, economic, environmental and political) framework of drivers of change.
• The development of information sheets (structured summaries), drawing on the STEEP information base.
Eleven relevant megatrends are included in the Assessment Report. The report also includes a summary of the importance of the megatrends for Europe and in this context discusses the implications of environmental challenges and policymaking.
Box 2 summarises the 11 GMTs as described in the SOER 2010
Box 2. A summary of the EEA’s global megatrends (GMTs).
GMT 1: Increasing global divergence in population trends
The global population will still be growing midway through the 21st century, but at a slower rate than in the past. People will live longer, be better educated and migrate more. Some populations will increase as others shrink. Migration is only one of the unpredictable prospects for Europe and the world.
GMT 2: Living in an urban world
An increasingly urban world will probably mean spiralling consumption and greater affluence for many. But it also means greater poverty for the urban underprivileged. Poor urban living conditions and environmental and health risks associated with this could have an impact on all parts of the world, including Europe.
GMT 3: Disease burdens and the risk of new pandemics
The risk of exposure to new, emerging and re-emerging diseases, to accidents and new pandemics, will grow with the increasing mobility of people and goods, climate change and poverty. Vulnerable Europeans could be severely affected.
GMT 4: Accelerating technological change – racing into the unknown The breakneck pace of technological change brings risks and opportuni-ties, not least for developed regions such as Europe. These include, in particular, the emerging cluster of nanotechnology, biotechnology, and information and communication technology. Innovations offer immense opportunities for the environment, but can also cause enormous problems if risks are not regulated adequately.
GMT 5: Continued economic growth?
Rapid growth accelerates consumption and resource use. But it also cre-ates economic dynamism that fuels technological innovation, potentially offering new approaches to addressing environmental problems and increasing resource efficiency.
GMT 6: From a unipolar to a multipolar world
Global power is shifting. One superpower no longer holds sway and regional power blocs are increasingly important, both economically and diplomatically. As global interdependence and trade expands, Europe may benefit from improving its resource efficiency and knowledge-based economy.
GMT 7: Intensified global competition for resources
How will Europe survive in the intensifying scramble for scarce resources? The answer may lie in more efficient production and resource use, new technologies, innovation and increasing cooperation with foreign partners.
GMT 8: Decreasing stocks of natural resources
A larger and richer global population with expanding consumption needs will place growing demands on natural systems for food, water and energy. European resource stocks may likewise face increasing pressures. GMT 9: Increasingly severe consequences of climate change
The speed at which climate change has an impact on the environment will threaten food and water supplies, human health, and terrestrial and marine life. Europe may also see more human migration and aggravated pressure on resources supplies.
GMT 10: Increasing environmental pollution load
An increasingly complex mix of pollutants threatens the Earth’s regulatory mechanisms. Particulates, nitrogen and ground-level ozone merit particular attention because of their complex and potentially far-reaching effects on ecosystem functioning, climate regulation and human health. In addition, many other chemical substances are released into the environment, with effects – in isolation or combined – that are still poorly understood. GMT 11: Environmental regulation and governance – increasing fragmentation and convergence
The world is devising new governance models, including multilateral agreements, on numerous issues and public-private ventures. In the absence of global regulations, high European standards and procedures are often adopted worldwide. But will this also be the case in the future?
1.2 Basic aspects of systems thinking
1.2.1 basic approachOne of the main characteristics of the “complexity of interlinkages” are feed-back effects and causal networks instead of “simple” linear causal relationships. In systems thinking, causal-loop-analysis and causal loop diagrams (CLDs) are applied, representing a form of conceptual modelling to help grasp these kinds of complex causal relations. Qualitative conceptual modelling is often used to represent highly complex systems as a step towards detailed quantita-tive modelling.
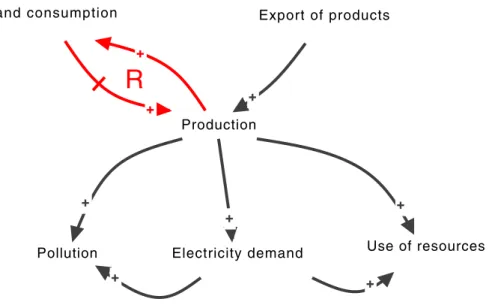
The basic principle behind the approach that we applied is to formulate a clear question about a given problem and to then systematically ask what causal relationships exist between the different factors or concepts, in order to visualise them graphically, and finally, to evaluate these networks with a computer-based tool. When connecting two or more factors with arrows you add more information, while you ask, “Is one factor causing the other to increase or decrease?” “How strong is this effect?” “And is this an immediate or delayed effect?” Figure 1 shows an example of how to make these causal relationships visible in a CLD.
Figure 1. An example of making causal relations visible with a CLD.
The central question that addresses the issue being explored in the CLD in Figure 1 is: What are the main drivers for production and what impact does
production have? In order to analyse this question we need to ascertain the key
variables that are influencing and those that production has an influence on as well as define their causality. We can do this by asking, for example, What
leads directly to more “production”? The figure above can be read to indicate:
• More inland consumption leads to more production. • More exports also lead to more production.
• There is a reinforcing closed loop between production and consumption. These questions are asked systematically for each factor. By doing so, inter-connections can easily be identified and structures emerge through the feed-back loops. Based on the connections that are identified by the modeler, this can then be evaluated with the help of the Consideo software tool:
• To calculate what factors have the strongest impact on one central factor (positive/negative in the short/medium/long term).
• To look for feedback loops and for causal chains.
Feedback loops can either be reinforcing (indicated with an R) or balancing (indicated with a B), and they can be represented as shown in Figure 2 below. Figure 2 (left side) should be read as follows:
• More use of resources (demand) will cause prices to increase on the world market in the midterm.
• Higher prices on the world market will lead to fewer imports of resources.
• Fewer imports will mean less regionally available resources.
• When there are less regional resources available, it will limit the use of the resources.
R
+ + + + + + + + Use of resources Pollution Production Export of products Electricity demand Inland consumptionFigure 2 (right side) should be read as follows: • More wages lead to more inland consumption.
• More inland consumption leads to more regional economic growth which will in turn…
• Lead to higher wages
The results are then shown in the so-called “Insight Matrix”. The Insight Matrix is used to illustrate the strength of the relationships between the fac-tors: the further a factor is located to the right, the stronger the increasing effect of a selected factor is on the central factor. The opposite is the case the further a factor is located to the left. The orientation on the y-axis reflects the involvement in loops (either balancing or reinforcing). It makes it possible to ask questions such as, What is the strongest driver of one factor? What
meg-atrend has a positive/negative effect on my target factor?
Figure 2. An illustrative example of a balancing feedback loop on the left side and a reinforcing loop on the right side; excerpt from the model.
B R + + + + + -+ Regional availability of resources Inland Consumption use of resources Import of resource Regional economic growth Wages price of resources on world market
N egat iv e f ee dbac ks Po si tiv e f ee db ac ks
Negative/decreasing impact Positive/increasing impacts
Figure 3. An Insight Matrix of the possible positive or negative impacts of GMTs on resource scarcity.
How to read the Insight Matrix: The further a factor is to the right, the stronger the posi-tive effect, and the further it is to the left, the stronger the negative effect. The higher a factor is on the y-axis, the more positive feed-backs are involved, and the lower down a factor is, the more negative feedbacks there are.
The following combinations are possible:
A positive x-value and a positive y-value (green area) means: a positive effect that is getting even more positive over time (with the feedbacks).
A negative x-value and a positive y-value (blue area) means: a negative effect that is lessened by positive feedbacks.
A positive x-value and a negative y-value (yellow area) means: a positive effect that is getting smaller due to negative feedbacks.
A negative x-value and a negative y-value (red area) means: a negative effect that is getting even more negative due to the negative feedbacks. An Insight Matrix can be transferred into a diagram with columns of the x-values. Columns can be grouped into short, medium and long term. The y-value is not explicitly shown (only implicitly by the change of the column height over time).
1.2.2 Some more theoretical background
The roots of this kind of analysis can be found in Causal Loop Analysis, which is part of the broader System Dynamics methodology. Emphasis is put on the analysis of cause and effect relationships and feedback loops. This methodology was introduced by Jay Forester (1977)4 and has evolved into an important element of strategic foresight analysis.
In this context, a “model” is any conceptual understanding of a pheno-menon, fact, or event that can be applied to evaluate cause and effect. A model is a simplified representation of some aspect that has been observed in the real world and represents any consequence or interpretation taken from a set of observations or experiences.
Studies have shown that there is a tendency to reach a mental barrier when trying to grasp the interconnections between more than four factors with-out the assistance of a computer or pen/pencil and paper. In such cases, there is a tendency to listen to “gut feelings” and follow best practices, e.g. those which have been applied under other circumstances in the past. This can sig-nificantly limit the analytical value and credibility of decisions or outcomes made under the circumstances. Hence, the application of a tool such as quali-tative modelling is an important asset towards understanding complexity. 1.2.3 The use of software tools
In principal, any conceptual model can be developed and drawn on a piece of paper. However, to identify, interpret and analyse loops, causal chains and potential impacts of factors, the classical pen and paper method reaches its limits. Having the support of computer tools becomes essential at a certain point. There are quite a few visualisation tools available on the market, mainly in the area of system dynamics and the preparation/visualisation of SD models5. In the case of qualitative modelling, there are only very few visualisation and assessment tools available. Worth mentioning are so-called “fuzzy cognitive maps”, which can be drawn as simple block diagrams, assessed with Excel tools and evaluated with network theory6. Another tool worth mentioning for quali-tative modelling and simulation is “Garp3”7.
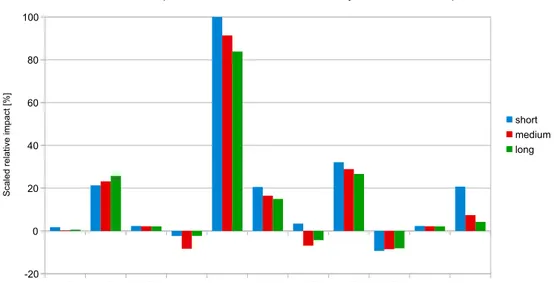
Figure 4. An example of how an Insight Matrix can be transformed into a bar chart. The y-axis shows the relative impact of the respective global megatrend on the central factor (here: resource
scarcity in northern Europe) standardised to 100% (highest impact). The short, medium and long
term impacts are shown for each global megatrend (GMT).
GMT 1 GMT 2 GMT 3 GMT 4 GMT 5 GMT 6 GMT 7 GMT 8 GMT 9 GMT 10 GMT 11 -20 0 20 40 60 80 100
Possible impact of GMT on resource scarcity in northern Europe
short medium long Scaled relative im pact [%]
In this study we used the Consideo Modeler and iModeler. Qualitative model-ling with the use of Consideo is a further development bringing together ele-ments of CLD (system dynamics) and fuzzy cognitive maps. During the course of the study, we switched from the Modeler 7.5 to the iModeler. Although the algorithms are the same, the iModeler is web oriented and allows for cloud computing and collaborative modelling. Hence, the layout of the screenshots is different. This can also be seen in this report as not all screenshots have been reworked to the Modeler 7.5 or the iModeler. More information about the tool and concept can be found online8.
2 Case Study I: “Possible impacts
of global megatrends on resources
scarcity (general concept from the
perspective of northern Europe)”
2.1 Introduction
2.1.1 Purpose of the study
The study examines the general mechanism of resource scarcity. The global megatrends – as described in the SOER 2010 – are included in the model as well as some measures from the EU Roadmap on Resource Efficiency. By taking this approach the model is able to answer the following main questions:
What exactly are the mechanisms of resource use and scarcity, respectively?
->Section 2.2
Which of the GMTs most greatly promotes (or hinders) the problem of resource scarcity (and how)?
-> Section 2.3
Which of the principal approaches of the EU roadmap possibly has the greatest potential to reduce the challenge of resource scarcity?
-> Section 2.4
Before answering these central questions, some definitions of the term “resources” will be presented in light of European Resource Efficiency Policy, including a brief overview of policy approaches to address the topic of “resource efficiency”. A short overview of the model design will be provided before we present a more detailed analysis of how to interpret the model. 2.1.2 resources and resource efficiency policy in the Eu
A resource is a source or supply from which benefit is produced. Typically, resources are materials or other assets that are transformed to produce benefit, and in the process, they may be consumed or made unavailable. From a human perspective, a natural resource is anything obtained from the environment to satisfy human needs and wants. From a broader biological or ecological per-spective, a resource satisfies the needs of a living organism. Resources such as raw materials, energy, food, water and land are directly used as the basis of our economyii. In addition, other natural resources such as clean air, biodiversity
and ecosystems provide environmental and social services and are therefore fundamental to our wealth and quality of life. But we live in a finite system in which the supply of natural resources is by definition limited, and growing global demand puts even more pressure on the environment. Resource use,
ii The EU has a broad understanding of resources, defined e.g. in the Thematic Strategy on
especially unsustainable use, changes our ecosystem: land use, soil depletion, water consumption and many other human interventions, among other things, all lead to climate change and biodiversity loss. In the EU, we currently use 16 tonnes of materials per capita every year. In total, this is eight billion tonnes per year. Globally, raw materials production will increase from its level of 53 billion tonnes in 2005 to 80 billion tonnes by 2020 according to an estimation by the OECD9.
The need to address the challenge of the unsustainable use of natural resources has been recognised in several high-level EU policy documents. In 2001, the EU Sustainable Development Strategy10 identified seven
unsus-tainable trends hindering the susunsus-tainable development of the EU, and defined the need for more efficient use of resources to ensure sustainable growth in the future. In 2005, the EU Commission adopted its Thematic Strategy on the
Sustainable Use of Natural Resources11 in response to the growing evidence that
the intensive use of natural resources is taking an increasing toll on the planet. The overall objective of the strategy was to reduce the negative environmen-tal impacts generated by the use of natural resources in generating economic growth. Therefore, the strategy introduced the concept of double decoupling, which refers to the decoupling of resource use from economic growth as well as the decoupling of environmental impacts from the related resource use. Furthermore, the strategy recognised the need for a life cycle perspective when tackling unsustainable resource use, as the environmental impacts are often distributed along the entire production chain of products. With its Action Plan on Sustainable Consumption and Production and Sustainable Industrial Policy12 the EU Commission intends to reduce the environmental impacts that
stem from the retail sector and foster sustainable products.
Further recognition of its strategic importance is indicated by the inclu-sion of sustainable resource use as a topic addressed in the Europe 2020 strat-egy13. The sustainable and efficient use of natural resources was recognised as
crucial for the further economic development in the EU and became a focus of one of the seven flagship initiatives within the strategy. The flagship initia-tive A Resource Efficient Europe14 sets out a framework to ensure that policies
in all relevant areas produce results on resource efficiency. It explains how the focus on resource efficiency in policymaking is both a necessity and an oppor-tunity for the EU. One of the major elements of the flagship initiative is the
Roadmap for a Resource Efficient Europe15, which was published in September
2011. This roadmap describes the EU’s vision for a resource efficient and sus-tainable European economy and proposes ways to increase resource produc-tivity and decouple economic growth from resource use and its environmental impact. It illustrates how policies interrelate and build on each other. It sets out milestones until 2020 and suggests policy measures and instruments on the way to making Europe the most resource-efficient economy worldwide.
Modern societies depend on a secure supply of a variety of raw materials to a very high degree. Many industries such as construction, chemicals, auto-motive, aerospace, machinery and equipment manufacturing, which provide
a total value added of €1,324 billion and employment for some 30 million people, all depend on access to raw materials. Many of these are imported into the EU as they are not available or cannot be extracted in an adequate amount within Europe. Especially metallic minerals need to be imported as the domestic production is limited to about 3% of the world production. Based on the assumption that the success of the EU economy is vulnerable to increasing price volatility, price increases and insecurity of raw material supply, the EU Commission published The Raw Material Initiative – Meeting
our Critical Needs for Growth and Jobs in Europe16. This initiative proposes
to develop a European policy safeguarding the EU raw material supply to ensure that the EU has sufficient access to raw materials at fair and undis-torted prices. This strategy is based on three pillars, (i) access to raw materi-als on world markets at undistorted conditions, (ii) foster sustainable supply of raw materials from European sources and (iii) reduce the EU’s consump-tion of primary raw materials. In 2011, the EU published a strategy entitled
Tackling the Challenges in Commodity Markets and on Raw Materials17. This
strategy incorporated the three pillars and proposed a variety of instruments and policy measures such as bilateral raw material partnerships with material-rich countries, the improvement of framework conditions for exploration and extraction of raw materials within the EU, the increase of material specific recycling rates and the intensification of circular flow economy. To underpin the second pillar, the sustainable supply with raw materials from within the EU, the European Commission set up the European Innovation Partnership (EIP) on Raw Materials18 in February 2012. With this partnership, non-ener-getic and non-agricultural raw materials are addressed. With the clear focus on innovations along the entire value chain of raw materials it also provides a direct link to the lead initiative “Innovation Union” under the Europe 2020 strategy. The EIP on raw materials brings together several EU member states, companies and research teams who will jointly promote innovations – from exploration to extraction processing to recycling, but also the substitution of raw materials. Although the focus is on technologically driven solutions, the use of instruments on the demand side, e.g. non-technological options are taken into account. Expected results of the EIP on raw materials are quite practical such as building up ten innovative pilot/demonstration plants and substituting at least three key applications of critical and scarce raw materials by 2020.
The Roadmap for a Resource Efficient Europe, the raw material strategy as well as the European Innovation Partnership on Raw Materials all three attempt to address several of the global megatrends described above (e.g. GMT 5, GMT 7, GMT 8 and GMT 10), and can be viewed as the EU Commission’s answer to the different forms of resource scarcity as described below.
Any resource that comes from a source is used and goes to a sinkiii. Basically, what we mean by this are material natural resources, which are derived from the environment and not from other resources (production factors) such as “work force” or “capital”. Many of these natural resources are essential for human survival, while others are used for satisfying human desires. Natural resources may be further classified in different ways:
• Abiotic – biotic resources: abiotic resources comprise non-living things (e.g. land, water, air and minerals such as gold, iron, copper and silver) while biotic resources are obtained from the biosphere, e.g. wood or fish. Minerals such as coal and petroleum are sometimes included in this cate-gory because they were formed from fossilised organic matter, albeit over long periods of time.
Natural resources can be categorised on the basis of renewability:
• Non-renewable resources are formed over very long geological periods. Minerals and fossils are included in this category. Since their rate of forma-tion is extremely slow, they cannot be replenished once they are depleted. Out of these, the metallic minerals can be re-used by recycling them, but many resources including fossil fuels (e.g. coal, gas) and petroleum based by-products cannot be recycled.
• Renewable resources, such as forests and fisheries, can be replenished or reproduced relatively quickly. However, overexploitation beyond replenishment rates or resource use which damages the conditions for reproduction may lead the source to run dry (or collapse in the case of a population or ecosystem).
2.1.3 Overview of the model on resource scarcity
Any scarcity is a function of a mismatch between offer (supply) and demand. The model is a generic model which means that the goal of the model is to understand and explain the principal mechanism of resource scarcity. Of course there would be differences in the model when talking about finite resources such as e.g. crude oil or renewable resources like wood. With respect to minerals and metals it is not the intention of this report to discuss whether these resources are scarce per se or if there are unlimited (but undis-covered) reserves in the crust of the earth.
Figure 5 gives a broad overview of the model that we developed. It shows two main boxes, the use of resources and the availability of resources (offer/ supply). These two boxes are determined (mainly) by activities and outcomes within different subsystems or spheres, like the social sphere, the economic sphere and the political sphere. For each, the use and the availability of resources is determined and driven by various factors from these interacting spheres. Of course, the availability of resources is determined by the physical world around us.
Figure 5. An overview of the qualitative model on resource scarcity.
The global megatrends are considered part of the model because they also con-sist of drivers and factors that will potentially influence the use and/or avail-ability of resources. As indicated in Section 0.1, resource use and availavail-ability are themselves identified as key megatrends in the SOER 2010 GMT Report:
intensified global competition for resources (GMT 7) and decreased stocks of resources (GMT 8) and other GMTs will also be influenced by changes in
these factors. For the purpose of clarity, the megatrends are shown as an extra box in Figure 5.
At the same time, for Europe, the measures and levers identified in the EU
Roadmap on Resource Efficiency or the EU Raw Material Strategy are one
answer of how policy is going to treat the problem of resource scarcity. Hence, some measures and causal argumentations identified in the roadmap are also included in the model.
In the following sections some main outcomes and conclusions of the model will be presented and interpreted. We will describe and explain the model progressively. A more comprehensive and structured documentation of the model is available in the Section 4.1 (Annex).
2.2 Understanding the system: resource use,
types of scarcity and common approaches
2.2.1 Scarcity – identifying the problemIn general, scarcity means that more of something is being used or is needed than is available. Major drivers for demand of resourcesiv are: production, energy demand, domestic consumption, the export of products and, as a general overarching driver, “human needs”. The availability of substitutes also plays
iv With a focus on northern Europe, resources such as water and land are not referred to with this broad
term. In Europe, the focus should be on material resources such as minerals, metals and renewable resources. Since products and trade are also included in the model, the (hidden) mass flows should be considered as well.
Global Megatrends
Use of
resources of resources Availability Roadmap for resource efficicency
Political sphere
Social sphere
a role. Major determinants of regional availability are the stocks of natural resources, geological reserves, imports from global stocks and the adoption and success of the circular economy (recycling, reusing).
Scarcity occurs when regional stocks are exhausted or limitedv – this is what could be described as physical scarcity. When the availability of resources depends on import – which in Western Europe is true for many raw materials, especially metals – scarcity is, in the short term at least, more greatly driven by economic and/or political factors. This observation is also emphasised in the study Scarcity in a Sea of Plenty published by the PBL 201119.
v Mineral resource stocks, in particular metals, are not depleted in the same way as conventional oil stocks
are, because they are graded resources that are distributed in the entire earth’s crust. Their physical scar-city is primarily a matter of energy availability. In the case of renewable resources, also a stock would be Figure 6. An excerpt from the model showing the central factor resource scarcity in northern Europe and the first levels of the model. Scarcity is determined by use of resources and regional availability. The availability is determined by regional resources and imports. Exports decrease regional availability. The use of resources is determined by production and heat and power demand and, of course, by the
availability of resources in general.
A central factor of this economically-driven mass flow is the industrial sectors’
striving for profits and the drive for macro-economic growth (increasing GDP).
The higher the prices of resources are on the world market, the more a national economy (when growth driven) will export rather than import them. Indirectly, however, prices of imported products will increase because the price of production increases externally. So, in theory, with a little delay, demand will decrease and prices will balance out. So far, this is a description of the theory of the perfect neoclassical market – a slightly increasing oscillation.
B B + -+ + + -+ + -+ Resource scarcity in northern Europe Export of natural resources Regional availability of resources Regional natural resources Use of resources Electricity and heat
demand
Import of resources Production
There are at least two possible (and critical) matters that disturb this self-regu-lation: artificially altered prices of resources on the world market and reaching the natural limit of a carrying capacity (extensively described in D. Meadows et al.20; Rockström21). In addition to this, prices of natural resources, in gen-eral, do not reflect their “true” cost. This applies to the environmental and social externalities of the resource extraction, processing and use that are not reflected in the cost (price) of that resource at all stages in the value chain. This is a key factor in the depletion of natural resources and the extensive damage caused to ecosystems as a result.
Surpassing natural limits in the form of carrying capacities is the more detrimental problem, and is – incidentally – also driven by population growth and rising living standards (“overshot and collapse”). Some studies surmise that on a global scale we are already exceeding our carrying capacity for some of the earth’s systems, e.g. the WWF (2012) used ecological footprinting to calculate that in 2008, the footprint of global consumption and production exceeded the world’s biocapacity (defined as the area of land and productive oceans actually available to produce renewable resources and absorb CO2 emissions) by more than 50%22.
However, in the context of our model, the artificially altered prices of resources are mainly driven by politics. When a country decides to limit the export rate of a resource, all other things being equal, the high demand will cause its price to increase. This phenomenon is what the PBL study referred to as “political resource scarcity”. A side effect, albeit a slightly different one, is when a national economy cannot afford the high prices of resources and therefore has no access to the material. This is “economic resource scarcity” Figure 7. An excerpt from the bigger model – profit for industry/economy is a central factor that influences the export of both resources and products.
+ -+ -+ -+ + + + -+ + -+ + + + + + -Profit for industry/economy Price of resources on world market Efficient running production unit Investment in production technology Import of resources Export of products Resource efficiency of product Regional price of resources Export of resources Price of products Regional resources Cost of production Import of products
(which could be influenced by political decisions elsewhere). While the political resource scarcity can be dealt with through negotiations and agreements, the “economic resource scarcity”, when prompted by limited global reserves of the respective resource, will be a serious problem and a question of global equity and hence possible conflicts. Recent events in relation to the trading of commodities in global financial markets, and the subsequent impact on food prices, have raised awareness about artificially high food prices23.
These general principles can be applied differently to, for example, the scarcity of drinking water in various regions.
From an environmental perspective, an additional issue is that higher prices for resources can make alternative sources of these resources more attractive. And this may potentially have significant consequences. For example, as oil and gas prices increase, the additional cost associated with hugely damaging extraction methods, such as tar sands and “fracking”, become economically attractive to producers. Likewise, global food prices may make the destruction of natural ecosystems for agricultural production a more attractive proposition economically, as can be seen in the conversion of vast areas of rainforest to palm oil plantations and cattle grazing to meet increased global demands for vegetable oils and meat (especially beef).
2.2.2 Increasing efficiency
It seems counterintuitive, but the world market prices of resources mentioned above can also play a key role in increasing resource efficiency as well as have an effect on technological innovation. This becomes clear when taking into account that the high prices of resources encourage the better use of available resources and result in less wastage. However, this benefit is limited to the extent that a given resource is still being used and access to new resources might be limited. Another problem might arise when the national economy is so stressed that investment in technological innovation is no longer possi-ble. Interestingly enough, trade barriers have a comparable effect: a national economy cut off from some resources must be as efficient as possible until the resources (financially, intellectually, materials) are gone before it will continue developing technological innovation and the entire economy starts shifting or collapsing.
The contrary effect occurs when there is a huge abundance of resources. No real necessity is there to increase efficiency (e.g. less fuel-demanding cars).
In summary, increasing efficiency is a key measure, but it will not prevent the scarcity of resources in the long run; the problem will only be shifted until the future24, vi. This also applies to the other key measures such as recycling
and substitution. On account of the fact that 100% recycling is thermody-namically impossible, recycling, too, can only shift scarcity to the future (in a steady or growing economy).
Substitution on a material level will only replace one resource with another and thus also only shift scarcity to the future. Another factor is that efficiency has been shown to lead to consumption elsewhere: through the “re-bound effect”, which means that efficiency savings in one form of consumption (e.g. a more efficient boiler) will often be, at least partially, offset by increased con-sumption elsewhere (e.g. by using the more efficient boiler to keep your house warmer!)25. In the next section (“Balancing effects”) rebound effects will be
discussed in more detail.
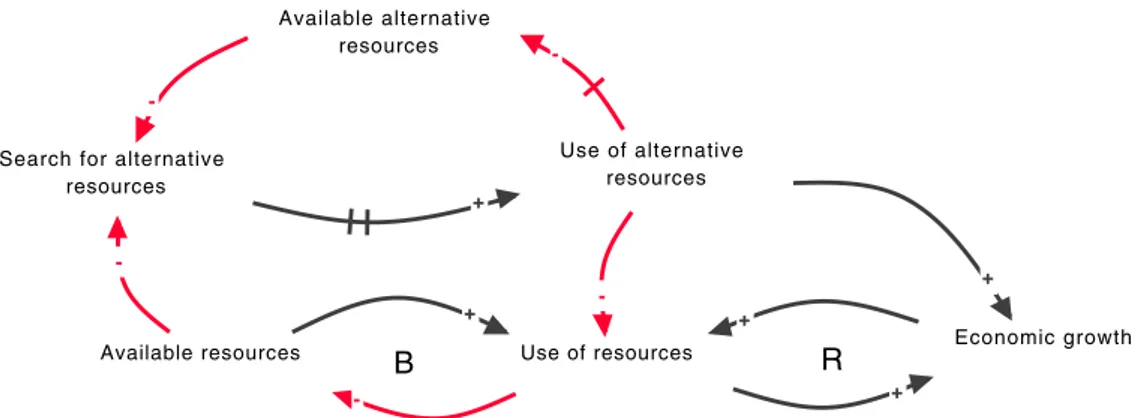
Accompanying measures should be directly linked to domestic consump-tion, production and exports, i.e. the current model of economy and growth. 2.2.3 balancing effects – a key to understanding rebound effects
One of the characteristics of systemic analysis that we demonstrated in the model is the fact that you can see and assess feedback structures. In the model that we built, 46 loops are defined, which determine the behaviour of the system that is analysed. There are some feedback structures that require a closer look.
The production of goods is prompted by domestic consumption and by the export of the products. More production leads to an increased use of resources, which will result in a price increase on the world market, unless the availability of the resource can be expanded through increased recycling and exploration. The more expensive a resource is, the greater the price of produc-tion will be, which causes the products to be more expensive and hence will lower both consumption and the export of the products. This, in turn, will lower the demand on the market, and in the event that there is no scarcity, the price will decrease and more resources will be in demand. This is a balancing feedback structure that levels out offer and demand by establishing a price on the market (Figure 8).
Figure 8. An excerpt from the model – an example of a balancing loop. Greater inland consumption leads to more production, which requires more use of resources. Over time this demand increases the price of resources on the world market, which increases the prices of production, which will in turn decrease inland consumption.
+ + -+ + + Export of products Production Price of production Use of resources Domestic consumption Price of resources on world market
This balancing structure is well known in system dynamics and – depending on the actual delay – this archetype will result in slightly oscillating behaviour (prices and production).
There is another feedback structure that will alter this behaviour as well: domestic consumption, the export of products and the export of natural resources will directly lead to economic growth, which will, with a little delay, lead to higher wages, which will then stimulate domestic consumption. Here, we should expect to see a rather dominant loop of economic growth.
Figure 9. An extended basic balancing structure. Within the big balancing structure, a reinforcing structure can be identified. This reinforcing loop nicely describes the current growth model:
re-gional economic growth leads to higher wages, which leads to more inland consumption. And this
leads to regional economic growth. This reinforcing feedback structure is quite dominant and will steadily move the entire balanced loop to a greater use of resources.
The “growth loop” (‘R’ inside) will steadily move the entire balancing struc-ture into a kind of exponential increase. This can also been viewed from a different angle: as long as regional economic growth is the overarching goal, the entire system will inevitably steadily move towards increased resource use. From a corporate point of view, the economy of scale is also an important trig-ger for growth. Especially for the mining industry and mining companies the need to (physically) grow (or externalise costs) in order to stay on the market is quite strong, because they cannot compete on the market based on the quality or innovation of their product (raw material) the way other industries can.
Regional economic growth does not only depend on inland consumption.
It also depends on the export of natural resources and the export of products. Figure 10 illustrates the extended structure.
These connected (balancing) loops nicely illustrate the so-called rebound effects. As long as the entire system seeks regional economic growth, the use
of resources will inevitably increase. Although, due to the delay in the loop,
it is likely to see a slight oscillation – a rebound effect is not static, but always time dependent.
B
R
+ + -+ + + + + Production WagesInland consumption Price of resources on
world market Regional economic
growth Price of production
In the literature, three types of rebound effects are described (e.g. Maxwell et al. 2011)25:
• Direct rebound effect – where increased efficiency and associated cost reduction for a product/service result in its increased consumption because it is cheaper.
• Indirect rebound effect – where savings from efficiency cost reductions enable more income to be spent on other products and services.
• Economy wide rebound effect – where more efficiency drives overall eco-nomic productivity resulting in more ecoeco-nomic growth and consumption at a macroeconomic level.
The loops in Figure 10 illustrate all three types of rebound effects, though the economy-wide rebound effect is depicted bestvii. However, the question as to whether regional economic growth is steadily moving or a result remains open in this model.
The only way growth might be achieved without increasing resource use would be to have economic output “decoupled” from resource use: relative decoupling exists when the relative amount of a resource required per unit of output decreases over time (thus overall resource use increases, just at a slower rate); and absolute decoupling exists when economic production increases, but resource use actually decreases or stays constant. It is for this
vii The increase of efficiency is “hidden” in the connection between production and use of resources.
Even if fewer resources are in demand due to production, the price effect will balance this out. Figure 10. Causal loop diagram showing the relationship between a rebound effect and economic growth. Here the basic loop structure is further expanded.
B B R R + + + -+ + -+ + + + + + Regional economic growth Use of resources Export of products Price of production Inland consumption Price of resources on world market Export of natural resources Production Wages