PAPER WITHIN Production Systems
AUTHOR: Sharath Chandrashekar & Vishal Nitin Sawalekar JÖNKÖPING May 2019
Forecast and Context Driven
Sales & Operations Planning
This exam work has been carried out at the School of Engineering in Jönköping in the subject area Production system with a specialization in production development and management. The work is a part of the Master of Science program.
The authors take full responsibility for opinions, conclusions and findings presented.
Examiner: Kerstin Johansen
Supervisor: Mahmood Reza Khabbazi
Scope: 30 credits (second cycle)
Abstract
This thesis aims to provide the reader with knowledge of preliminary processes in-volved in sales and operations planning. A case study design has been adopted with one case company and their production system has thus been contextualised to high variety low volume production. The report goes on to provide valuable information on different forecasting methods that can be implemented in the first step of sales and operations planning. The data gathering, and qualitative data required to support the validation of these techniques have also been included in the thesis. The report also shows how fore-cast can be used to drive sales and operations planning process. Further, the research aims to fill the gap in knowledge of contextualised sales and operations planning pro-cedure by providing a model suited for the high variety low volume manufacturing en-vironment.
Keywords
Sales and operations planning, forecasting, supply chain strategies, operations plan-ning, high variety low volume
Contents
Contents
Table of Figures... 6
List of Tables ... 7
1
Introduction ... 8
1.1 CASE DESCRIPTION ... 9 1.2 PROBLEM DESCRIPTION ... 101.3 PURPOSE AND RESEARCH QUESTIONS ... 11
1.4 LIMITATIONS &DELIMITATIONS ... 11
1.5 OUTLINE ... 12
2
Theoretical background ... 13
2.1 S&OP CONCEPTS ... 13
2.2 FORECASTING TECHNIQUES ... 18
2.3 STRATEGIC AND TACTICAL FORECASTING ... 19
2.4 MAKE-TO-ORDER &MAKE-TO-STOCK ... 21
2.5 HIGH VARIETY LOW VOLUME MANUFACTURING (HVLV) ... 21
3
Method and implementation ... 23
4
Findings ... 25
5
Analysis ... 31
6
Discussion and conclusions ... 35
6.1 DISCUSSION OF METHODS ... 35
6.2 DISCUSSION OF FINDINGS ... 35
6.3 DISCUSSIONS OF ANALYSIS ... 37
6.4 FURTHER DIRECTIONS OF RESEARCH ... 38
7
References ... 40
8
Appendices ... 43
8.3 APPENDIX 3DETAILED FORECAST ERRORS ... 44 8.4 APPENDIX 4YEARLY ANALYSIS WITH SALES TRENDS... 47
Contents
Table of Figures
Figure 1. Example of machine produced by Ecolean ... 9
Figure 2. Example of machines produced by Ecolean ... 10
Figure 3. Integration framework of marketing operations ... 14
Figure 4. Supply chain planning matrix adopted from (Steinrücke & Jahr, 2012) ... 20
Figure 5. Sales & Operations Planning adopted from (Wallace, 2006) ... 21
Figure 6. Research design ... 23
Figure 7. Actual demand data A, B machines ... 26
Figure 8. Actual demand data C, D, E machines ... 27
Figure 9. Actual demand data F, G & H machines ... 28
Figure 10. Comparison of forecasting techniques ... 33
List of Tables
Table 1. S&OP integration framework as given by Grimson & Pyke (2007) ... 15 Table 2 Literature search ... 24 Table 3. Current state of the host company ... 30 Table 4. Monthly machine production rate in percentage based on various forecasting methods ... 31 Table 5. Monthly machine production rate in percentage based on various forecasting methods ... 32 Table 6. Forecasting techniques on yearly basis ... 33 Table 7. Possible future state of the company ... 36
Introduction
1
Introduction
The sales and operations planning process is a trending topic today in the field of busi-ness control. Although an old idea, it is getting acknowledged for being useful to make improvements in business whilst being economical. Companies such as Electrolux, Honeywell and Nestle have pioneered the sales and operations planning process by having a concrete process in place (Sheldon, 2006).
The historical roots of sales and operations planning can be traced back to 1970s when organizations experimented and evolved their processes. Today in this competitive world, sales and operations planning (S&OP) has evolved into a tool that strategically helps in risk management and decision making (Sheldon, 2006).
According to Sheldon (2006), S&OP process can be used in different types of industries such as pharmaceuticals, automobile, consumer products, packaging manufacturer and furniture manufacturing to name a few. S&OP aims at unifying interrelated processes of a company such as operations, services into a single entity and obtain alignment (Plank & Hooker, 2014).
Nowadays companies offer diverse range of products to cater variety of customer de-mands. The increase in product variation and ever-changing demands has moved man-ufacturing practices to make-to-order or configure-to-order type which is characterised by high product variety and low volume ( Zhang & Tseng, 2009).
Companies go with make-to-order type when they need to manufacture customised products whereas Make-to-stock type is used for commoditized products. However due to varied range of products one particular practice is not enough to cope up with the trends of customer demand. Hence companies follow combined Make-to-order/Make- to-stock like mixed practice (Chen, Tai, & Yang, 2014).
In addition, to gain competitive edge companies need to differentiate themselves from others in terms of order commitment and on time deliveries ( Zhang & Tseng, 2009). Further, Zhang & Tseng (2009) point out that order commitment process is vital to compliment the balancing of demand and supply. The competition has moved to supply chain vs supply chain which has increased the requirement of internal coordination in companies (Malhotra & Sharma, 2002). It is crucial for a product-based company to have the capacity to deliver the right product at right time and in right quantity to the right customer. Such capacity is achievable through constant balance of demand and supply (Lahloua, Barkany, & Khalfi, 2018). As per Sheldon (2006) and Pedroso, Silva & Tate (2016), S&OP can be used to even out the inconsistencies between the demand and supply.
According to Pedroso, Silva & Tate (2016) S&OP is a process of making decisions that can be utilised to obtain alignment with primary objective of tactical plans in order to harmonize demand and supply sides of the business. Similarly, as per (Chen-Ritzo, Ervolina, Harrison, & Gupta, 2010) S&OP results in orientation of sales at the front with the operations at the rear. The S&OP is also affected by the context in which it operates. The objective and the subsequent result of S&OP is exclusive to the context of company’s production type (Kristensen & Jonsson, 2017). Therefore, it is vital to
Figure 1. Example of machine produced by Ecolean
Source: (Ecolean, 2018) agreed consensus and plan accordingly.
1.1 Case description
This thesis has been carried out at Ecolean AB based in Helsingborg, Sweden. Ecolean is manufacturer within the packaging industry who makes packaging material as well as filling machines. It has operations spread across 30 countries with their headquarters in Helsingborg. The plant in Helsingborg is divided into two units, one for making their proprietary light weight package and the other to make filling machines. This thesis focuses on the unit that produces the filling machines. The machines broadly classified into two types; ambient & chilled are assembled in a job shop layout. Each type has further variants based on capacity and the type of package it fills. The nomenclature of the machines is given as A, B, C (chilled types) and D, E, F, G, H (ambient types). See
Introduction
Figure 2. Example of machines produced by Ecolean
Source: (Ecolean, 2018)
Ecolean also offers service support to its customer by providing maintenance as well as spare parts. The scope of this thesis is limited to the production of machines itself and has little or nothing to do with the packaging material. Analysis is carried out for one of the machines, G and can further be extrapolated to other machines. The reason for choosing G machine is that it is one of the most selling and popular products offered by the company.
1.2 Problem description
According to Zhang & Tseng (2009), order commitment is significant to contrast a company in this competitive environment. In the present case, order commitment is unsatisfactory due to improper planning techniques. The high variety of parts and low volumes makes it difficult to plan operations that are coherent with sales/marketing objectives. High variety of parts also results in diverse lead times from suppliers and thus difficulty in procurement. There also exists improper coordination between the sales team and the production department which results in mismatch between demand and supply. The sales team utilises a prediction-based model to develop a sales plan for the year which serves as an input to production department for planning. Therefore, the sales team needs a proper forecast model that can be facilitate the operations planning. As per Kristensen & Jonsson (2017), the research lacks in the knowledge of S&OP structure in the context of manufacturing strategy. Previous research does not suggest
egies. There is gap in knowledge about structuring S&OP with respect to a context (Kristensen & Jonsson, 2017). Further, forecasting has been proven to be a barrier as well as enabler in implementation of S&OP as per the study of (Pedroso, Silva, & Tate, 2016). It is also essential that sales department be involved in the S&OP process. The lack of proper sales team integration has been attributed to disagreement for inputs and numbers from sales team (McCall, 2013). Similarly, in this case, the sales input is not entirely agreed upon by the production team. Therefore, this thesis will address two problems, first being the use of forecasting to facilitate S&OP and the second being structuring S&OP in an HVLV manufacturing context.
1.3 Purpose and research questions
The aim of this thesis is to study the current state of planning operations of the case that produces low volume, high variety equipment and relate to theories on different S&OP strategies that can be implemented in different types of industries. Moreover, in order to achieve better delivery times, suggesting a strategy that the host company can use when it comes to its planning operations. Since the study aims at operations and plan-ning solutions for companies with high variety, low volume production, the research questions are designed to revolve around this specific issue:
Research question 1: How can forecasting be used to facilitate sales and operations planning in low volume, high variety production environment?
Research question 2: How can S&OP be structured in balancing of demand and supply for HVLV context?
1.4 Limitations & Delimitations
This thesis is limited to defining the initial steps of sales and operations planning such as forecasting which can be used for procurement of materials to improve supply chain operations. However, certain procedures on executive meetings and supply chain inte-gration have been touched upon, though not extensively since the case focuses on im-plementing the sales and operation planning process from scratch and due to time con-straints, which led to limiting the scope of the thesis.
The primary limitation of this thesis also comes in the form of a limitation to data col-lection. Since the process of sales and operations planning is an interdisciplinary pro-cess that involves various domains of the company and their data over a long period of time, it is quite challenging to even maintain all the historical data, let alone extracting the data. The inputs from finance functions are lacking due to constraints within the company and time.
Given the low volume and high variety of production environment in the company, the forecasting techniques of weighted moving average and exponential smoothing delivers reliable results to the company in this context. However, the techniques might differ given difference in conditions to 3-period-moving average or even simple average as the volume and variety of production change. The result of data gathering was that the
Introduction
data available for analysis was limited to the past four years due to a change in the ERP system at the host company.
1.5 Outline
Chapter 2 describes the theoretical concepts surrounding the thesis. It includes the con-cept of sales and operation planning, production strategies of to-order and make-to-stock. S&OP described in detail consists of its objectives, steps and planning hori-zons. The situation of high variety, low volume production is explained along with its typical traits.
Chapter 3 consists of the methodology adopted of case study and the associated tech-niques to gather data and literature to answer the research questions. The chapter also describes the tools used in forecasting and extraction of qualitative data key personnel. Chapter 4 reveals the findings which are essentially current practices and shortcomings at the company. Quantitative data have been graphically presented in this chapter with a combination of points regarding several meetings at the host company.
Chapter 5 comprises of analysis of findings using the theoretical concepts discussed. Chapter 6 is dedicated towards the discussions and conclusions which answers the re-search questions. The methods incorporated are discussed first and the subsequent find-ings which is followed by the answers for each of the questions.
2
Theoretical background
2.1 S&OP concepts
S&OP is the stage at which the strategies meet to create a production plan that caters the market while supporting the financial and strategic aims of the company (Olhager, Rudberg, & Wikner, 1999). Various definitions of S&OP available have a common gist of obtaining alignment (Plank & Hooker, 2014). As per the decision-making framework of Malhotra and Sharma (2002), S&OP is a mix of strategic and tactical level planning. While S&OP is limited by capacity strategy, it affects long term capacity planning through feedback from implementing of production plan and sales plans. The resource planning transforms the production plan into a requirement plan for compliance. The main aim of S&OP is to strike a balance between sales plan and production plan which is achieved through decisions within marketing, output, inventory, etc. Such decisions are classified into two types, namely; modifying demand and modifying supply (Olhager, Rudberg, & Wikner, 1999).
Modify demand refers to the marketing tools that alter the sales trend that can be used to reach levelled production. The modify supply decisions consist of strategies within planning namely chase, level and combination. These planning strategies are dependent on environment such as, make to order, make to stock, assemble-to-order and so on (Olhager, Rudberg, & Wikner, 1999).
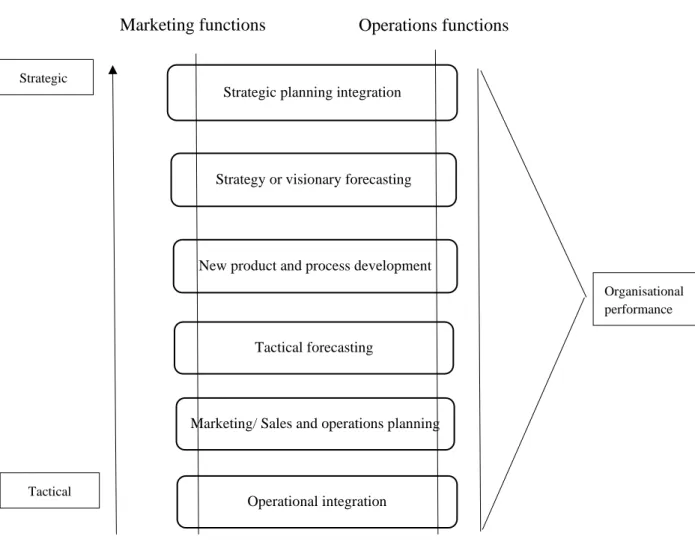
Malhotra and Sharma (2002), propose a framework that lays down the areas where the scope of integration exists for to link the marketing and operations. The framework is as shown below in Figure 3. The framework sheds light on the key decision areas which are shared between the two functions. The topmost level calls for agreement between marketing and operations via integrated planning. This is followed by a visionary fore-cast which accounts for future development of the company. On the other hand, tactical forecast emphasises on operational parameters. S&OP is listed at a transition stage be-tween strategic and tactical planning (Malhotra & Sharma, 2002).
Grimson & Pyke (2007) propose an integration framework which classifies organisa-tions stages ranked from 1 to 5 based on the cohesion between sales and operaorganisa-tions at the company as shown in Table 1. It begins with stage 1 which signifies no existence of S&OP. The last stage signifies the best S&OP process in a company proactively prac-tising the process. These stages are given dimensions in terms of meetings & collabo-ration, organization, measurements, IT and S&OP plan integrations (Grimson & Pyke, 2007). The same framework is used to recommend steps to advance into further stages of tighter integration of sales and operations.
Theoretical background
Marketing functions Operations functions
Strategic planning integration
Strategy or visionary forecasting
New product and process development
Tactical forecasting
Marketing/ Sales and operations planning
Operational integration
Organisational performance
Figure 3. Integration framework of marketing operations
Strategic
Table 1. S&OP integration framework as given by Grimson & Pyke (2007)
Stage 1 Stage 2 Stage 3 Stage 4 Stage 5
Meetings, Collabora-tions Silos struc-ture No meet- ings/collab-orations Top level meetings, Finance tar-get priori-tised Staff pre-meeting, Executive S&OP Integrated customer and sup-plier data, suppliers and cus-tomers part of meet-ings. Meetings based on events over scheduled ones, real time exter-nal data Organiza-tion No S&OP No formal S&OP, Parts of S&OP at places S&OP inte-gral of some de-partment. Ex Supply chain, prod-uct man-ager Formal S&OP team, par-ticipation of executives S&OP un-derstood by entire or-ganisation Measure-ments None Measuring how well operations meet sales Stage 2 + measuring sales for forecast ac-curacy Stage 3 + new prod-uct launch, S&OP ef-fectiveness Stage 4 + Profitability IT No infor-mation sharing, Managers have sepa-rate spread-sheets Limited sharing of spread-sheets done manually Centralised infor-mation, software for planning operations Batch pro-cess, ERP system linked to sales and operations, S&OP team Integrated S&OP soft-ware, inter-faced with ERP, ac-counting & forecasting. S&OP In-tegration No formal-ised plan, Operations tries to ful-fil incom-ing orders Sales drives operations, Top down approach. Limited plan inte-gration, Bottom up approach Highly inte-grated plan, concurrent approach Seamless integrated plans, opti-mised pro-cesses for profits
Theoretical background
The results put forward by Grimson & Pyke (2007) point out to measures necessary for S&OP integration these include, creation of an organisation dedicated for S&OP by selection of teams and leaders, schedule regular meetings and plot incentives for teams. Information resources should be set up to support the team and representative from each section of sales, operations and finance must participate. An owner should be appointed to be responsible for results. It is to be noted that the ultimate focus should be on unification of sales and operations through information sharing, limitations, opportunities among sales, finance and operations and not on new organization units, extra meetigs and new software (Grimson & Pyke, 2007).
The study of (Thome, Scavarda, Fernandez, & Scavarda, 2011) categorised the purpose of S&OP into different categories as described as follows:
• Alignment and integration of different parts of the company such as supply and demand, different functions and horizontal and vertical integration of the com-pany.
• Improvement of operations in terms of forecasting, inventory management, managing volume and variety, resource management and capacity.
• Singular focus on business areas namely, customer service, costs minimisation, revenues, demand fluctuations etc.
• Obtaining results that are a consequence of trade-offs, for instance cost vs cus-tomer demand, inventory vs demand fulfilment, more profit vs adjusted profit. • Ultimate outcome of the S&OP viz margins, profits, return on assets.
Wallace (2006), points out that S&OP assists the managers to get an inclusive picture of the company and insights into prospects. S&OP is based upon four pillars namely, supply, demand, mix and volume. Volume corresponds to the resources, product fami-lies, orders while mix refers to product types, stock keeping units (Wallace, Forecasting and sales and operations planning: synergy in action, 2006).
Wallace (2006), puts forwards five steps as a part of executive S&OP which are de-scribed below.
• Gathering of data and updating: Making of forecasts, documenting actual re-sults.
• Demand planning: Sales and marketing department establish product require-ments and agree on a forecast.
• Supply planning: At this step, operations plan is created which incorporate fore-cast changes, inventory and capacity. The operations department is involved followed by product development and finance.
• Pre-meeting: Generated demand and supply plan are resolved to tweak balance between demand and supply. Substitute plans are recommended by various managers.
• Executive meeting: At this stage the top executives come into picture to address the short comings of pre-meeting. Validation of S&OP in terms of company strategy.
Kristensen & Jonsson (2017) describe variables that affect S&OP. Context, response and performance variables are defined with respect to S&OP by them which are as below;
Contextual variables: The way in which S&OP is structured is dependent on the context it serves. A particular problem under consideration is influenced by the context in which it occurs. Complexity of the supply chain comprising of dynamic and detail complexity is a contextual parameter that affects S&OP. Uncertain nature of supply and demand fall within dynamic complexity which forms the requirement of risk assessment. Simi-larly, detail complexity corresponds to sales and units which result in demand planning within S&OP (Kristensen & Jonsson, 2017). Factors such as strategy of manufacturing, product families, are a few more context variables that come into play (Wallace & Stahl, The Demand Planning Process in Executive S&OP, 2008).
Response variables: Kristensen & Jonsson (2017) put forward four response varibales on the basis exisiting S&OP frameworks namely; organisation, meeting & collaboration, information technology and parameters of planning. The variable of organisation consists of structural features of the company, meeting & collaboartion consists of detailed features of decision making and finally information technology variable comprises of IT to support planning and scheduling.
Performance variables: The performance of S&OP is gauged in terms of efficiecny and effectivness. Efficiecny refers to the ability to efficiently allign horizontally and vertically along with quality plans. The developed plans are then evaluated on the basis of their effect on performance of operations which is defined as effectiveness (Kristensen & Jonsson, 2017).
Among these variables the literature study by Kristensen & Jonsson (2017) revealed that contextual variable of manufacturing strategy is being studied only from final impact on outcome and lacks knowledge about structuring S&OP as per manufacturing strategy and also its subsequent impact on performance.
For successful implementation of S&OP the study of (Pedroso, Silva, & Tate, 2016) listed a number of factors that act as enablers and barriers. Among these, forecasts which were high on accuracy were found to be enablers and at the same time forecasts that lacked faithful numbers were deemed as barriers. Forecast that is reliable to predict demand is one of the crucial parts of S&OP (McCall, 2013).
Theoretical background
2.2 Forecasting techniques
In this section we present the forecasting techniques that have been used in this thesis. Production systems lack the ability to react to customer needs immediately and hence a prediction of future demand in the form of forecast is necessary to develop effective plans for operations (Blocher, Mabert, Soni, & Venkataramanan, 2004).
Foercasting is a mixture of qualitative and a quantitative techniques. For products that are focussed on innovation, demand data is limited. Therefore for such products judgement is used by specialists that utilise their industrial knowledge to guess the demand. Such specialists use some historical demand information in their predicition (Blocher, Mabert, Soni, & Venkataramanan, 2004).
Below are some of the forecasting techniques which lie within the scope of this thesis. Three-period moving average
This forecasting technique is based primarily on historical demand data. An average demand over three periods is used to forecast the demand for next term (Bhattacharya, Jina, & Walton, 1996).
Ft+1 = (Dt +Dt-1 +Dt-2)/3 Where Ft+1 – Forecast for next time period;
Dt – Demand for current period; Dt-1 – Demand for (t-1) period; Dt-2 – Demand for (t-2) period; Weighted moving average
In this forecast, weightage is applied to the most latest data in contrast to simple moving where all entires are weighed in equally. Positional weights in increasing order are assigned to three previous demands to calculate the forecast for the current period (Chapman, 2008).
Ft+1 = (w1Dt + w2Dt-1 + w3Dt-2); w1 + w2 + w3 = 1
where w1, w2 & w3 are positional weights; w1>w2>w3; Basic exponential smoothening
Exponential smoothening is nothing but a weighted average with distinct weighs. The weights gets smaller as they are placed on intervals beyond the present interval (Blocher, Mabert, Soni, & Venkataramanan, 2004).
Where An-1 – previous period demand Dn-1 – previous period forecast
α – smoothing constant
Here α is the regarded as smoothening paramter whose values lie between 0 and 1. The study of Ambrose and Rutherford (2016) emphasised on the succesful nature of S&OP as an outcome of group effectiveness. Internal team factors such as cohesion, centralisation tend to have an impact on group effectiveness of S&OP and contextual influencers such as information quality, procedural quality, rewards, outcome and mediation were found to impact S&OP group (Ambrose & Rutherford, 2016).
2.3 Strategic and Tactical forecasting
Strategic forecasting is a way of picturing the future in various ways. It is beyond prediction and focuses on learning about the future ahead of the competition (Duus, 2016). Duus (2016) puts forwards a number decision areas that can be optimised using a strategic forecast. These areas include decisions within market, new products, production, finance and employees. Within the area of production, the decisions include procurement of inventory and equipment and real estate (Duus, 2016). Similarly Malhotra & Sharma (2002) refer strategic forecast as a visioanry forecast that assits future planning.
Tactical forecasting on the other hand is inclined towards operations of the company (Malhotra & Sharma, 2002). Tactical foreacasting assist in planning for production, labour, distribution and are derived in preiods of weeks or months (Lapide, 2002). The operations planning activities in supply chain deal with the coordination mecha-nism that focus on material and capacity management, formulating plans and schedules to meet the company’s demand goals. This process involves extensive sharing of quality information within the company to find a balance between the supply and demand (Kaipia, 2009). And as mentioned by Kaipia & Holmström (2007), matching of supply chain capabilities to the demand characteristics is one of the main objectives of supply chain planning. This brings us to determining several planning techniques and models that vary depending on the products in focus. Global OEM’s tend to have a wide variety of customers and suppliers, which results in long lead times, due to which the company has to plan months or years ahead of the customer order and delivery. The process of planning consists of forecasting, sales, demand planning, supply planning and supply capabilities. In a high variety production environment, planning for mid-term and short-term provides the company the key answers to questions about the volume and the type of product variants that need to be manufactured within the stipulated time horizon (Kaipia & Holmström, 2007).
Theoretical background
There exists a variety of planning models for short-term, mid-term and long-term tacti-cal and strategic planning. While the flow of materials throughout the planning process can be differentiated into four stages, namely procurement, production, distribution and sales, the short-term, mid-term and long term planning activities are divided based on the type of activities performed for the achievement of these planning activities (Steinrücke & Jahr, 2012). This particular model is illustrated below Figure 4.
Figure 4. Supply chain planning matrix adopted from (Steinrücke & Jahr, 2012)
Steinrücke & Jahr (2012) mention that there are three levels of supply chain planning in terms of time horizons. Namely, short-term, mid-term and long-term planning, which can also be bifurcated as operational level, tactical level and strategic level respectively. Wallace (2006) talks more about strategic or executive sales and operations planning, while suggesting that the process is highly cross-functional and is thereby helpful in lowering the value of the forecast error rather than eliminating it fully. While the focus is mainly on long-term planning horizon, there seems to be a common ground that Steinrücke & Jahr (2012) and Wallace (2006) share when it comes to strategic planning, which involves a top-down approach to the S&OP process. The executive meetings, top management support and the network structure are a few noteworthy commonalities between the two structures.
Figure 5. Sales & Operations Planning adopted from (Wallace, 2006)
2.4 Make-to-order & Make-to-stock
A make to stock production strategy is built on forecasts of prospective orders from customers. Subsequently products are manufactured and stored for deliveries to customers. Make to order strategy on the other hand is entirely dependent on customer order (Rafiei, Rabbani, & Alimardani, 2013). However forecasts are not irrelevant in make-to-order systems. Forecasts in make-to-order systems are used at high levels of decisions in order to balance the capacity needed and production over the medium term planning (Gansterer, 2015). Recently companies have started to shift to a hybrid of make-to-order/make-to-stock production. A mixed approach benefits the company by low inventory and shorter lead times (Kalantari, Rabbani, & Ebadian, 2010).
2.5 High variety low volume manufacturing (HVLV)
Companies characterised by HVLV manufacturing offer products that are either stand-ard or customised resulting in customer orders that penetrate the whole manufacturing chain (Hendry, 2010). HVLV practice is featured by a mix of make-to-order engineer-to-order manufacturing depending on the extent of customisation and the manufactur-ing activities such as design, fabrication, assembly etc (Amaro, Hendry, & Kmanufactur-ingsman, 1999).
HVLV cases are typical of the following features as per Jina, Bhattacharya & Walton (1997)
Theoretical background
• High range of product types which can be customised while having a low total volume.
• A strategy of Make to order with assured lead time and delivery schedule. • High level of vertical integration in order to maintain the unique nature of the
product being offered and its variations.
• A production plant that can cater to differing customer sectors such as special-ised equipment or customers who purchase configured products along with spares that in addition to standard products.
A typical HVLV manufacturing company faces the problem of turbulence in its manu-facturing as opposed to a traditional lean manumanu-facturing. Such turbulence corresponds to varied inputs which causes production system to operate abruptly and hence unsatis-factory output (Bhattacharya, Jina, & Walton, 1996). Four categories of turbulence are given by (Jina, Bhattacharya, & Walton, 1997) which are as follows;
• Schedule: Modifications to schedule as deadlines get closer for delivery. • Product mix: It is caused in multiproduct settings described by product mixes
along different time periods.
• Volume: It is similar to product mix but corresponds to gross volume along the periods.
• Design: The extent and the rate of changes to products during the expected lead time.
A HVLV production also lacks the ability to absorb the disruptions of input by decou-pling outbound and internal supply chain as in the case of high volume, medium variety production. Further in the internal supply chain turbulence can affect to the level of bill of materials. Schedule changes also adversely affect part suppliers both internal and external. Lastly, the spare parts demand is uneven for aftermarket services for a HVLV manufacturing company (Jina, Bhattacharya, & Walton, 1997).
3
Method and implementation
The thesis incorporates a case study design. According to Williamson (2002), a case study is useful to comprehend a context. In this thesis, the focus is on S&OP within the context of HVLV production. Literature review lies at the core of this thesis. The data collected is a combination of both, quantitative as well as qualitative. Quantitative data was obtained from the ERP system comprising of historical sales, upcoming budgets, and supplier lead times. The qualitative data was obtained from interviews and ques-tionnaires. The data gathered along with the literature review is used in answering the research questions. Figure 6 below represents the way in which the research is structured to answer the research questions.
For qualitative data, the source point of information was the in-charge personnel of sales/marketing department, supply chain, production and spare parts. The interview consisted of open-ended questions. The interview followed an unstructured approach to gain insightful data. As pointed out by Williamson (2002), unstructured interviews are used to yield thorough data from important people. The quantitative data such as previous sales, lead times of suppliers, parts consumption was analysed in Microsoft excel. Forecasting model of the type 3-period- moving, weighted moving average and exponential smoothing (see section 2.2) were used to predict upcoming demand. Eval-uation of forecasting techniques was done to determine the best suitable method for the given context. Simple moving average, weighted moving average, exponential smooth-ing were a few other techniques tested out in the process. After careful evaluation of the results of each of these techniques, and the history of demand data for past four years, the most appropriate methods were evaluated to estimate the demand for the up-coming year of 2020.
While the forecasting techniques were used to analyse quantitative data, skype meetings with the regional director for Asia North and Oceania was scheduled to obtain details on the current methods of forecasting, procedure for sales operations and coordination of operations between the different markets. The interview questions and meeting dis-cussion questions can be found in Appendix 1 Interview questions & Appendix 2 Interview questions (skype).
Research question 1 Quantitative data + Qualitative data Literature review Research question 2 Qualitative data Literature review
Method and implementation
Literature search process
As previously mentioned, literature search is at the central core of this research. To extract relevant literature several databases were searched using first the main key-words followed by the keykey-words which were closely related to the main concepts. The main operator used was AND in the databases of Sciencedirect, Emerald, Scopus, Francis & Taylor group and Elsevier. The Boolean operator OR was also used in some cases. The main literature was focussed on sales and operations planning and it was extracted with the keywords, Sales AND operations planning, s&op, marketing AND operations, sales AND production. For research questions 1, the keywords used were, forecasting AND sales and operations, forecasting AND s&op, forecast* AND s&op. Similarly, for the literature surrounding high variety, low volume production concepts the keywords used were, high volume low variety manufacturing, hvlv manufacturing, HVLV manufacturing. Since hvlv was closely related to production strategies of make to order, respective keywords used were, make to order manufacturing, mto, mto AND hvlv, mto production, production strategies. Following Table 2 describes the search process for literature search.
Table 2 Literature search
Aspect Respective keywords in databases of Sciencedirect, Emerald, Scopus, Francis & Taylor group and Elsevier
Re-search question 1 fore-casting AND sales and op-erations fore-casting AND s&op fore-cast* AND s&op Re-search question 2 high volume low va-riety manu- factur-ing hvlv manu- factur-ing HVLV manu- factur-ing make to order manu- factur-ing Mto, mto AND hvlv mto produc-tion produc-tion strate-gies Other parts of theoreti-cal frame Sales AND opera-tions plan-ning s&op market-ing AND opera-tions sales AND produc-tion
4
Findings
This chapter aims to provide the reader with data obtained from the case study by using various methods and relate them to the purpose of the thesis. The findings of this thesis work have been structured according to the five-step process of Sales and Operations Planning suggested by Wallace (2006). The findings represent the current practices at the company of how sales and the subsequent operations are done. The current state is then represented using the framework of (Grimson & Pyke, 2007). The preliminary step of data gathering was performed at the host company, which included historical data from the ERP systems of the company.
The data of demand, which was forecasted, and the actual demand for the past four years were analysed. The forecast errors and trends were analysed by using Microsoft Excel. The consumption of parts for a few variants of machines were also fetched as part of demand analysis. While these data formed the quantitative base for the thesis, a number of meetings, interviews, and skype meetings were scheduled to gather more qualitative data such as information regarding methods of forecasting, current status of sales and operations planning, etc. The capacity constraints were also come across in the process.
The meetings and interviews were generally one on one and was more of an open dis-cussion to make the interviewee more comfortable in sharing as much information as possible. The current status of sales and operations planning revealed that the company was still in the infancy stage when it comes to S&OP process implementation. There have been minimal signs of a formal approach to the process of S&OP. Although, the supply chain department realises the importance of implementation of S&OP. The dis-cussions also revealed that probability was used in place of a forecasting technique to predict demand and as a medium to communicate the demand data from the company’s overseas branches to the branch operating in Sweden. A probability of 80% or more means that the manufacturing facility in Sweden would start the production of the ma-chines.
The presence of a promising and proven forecasting was not to be found in the host company based on the current operations. According to the supply chain department at the host company, the management of the company has been unaware of the benefits of implementing a Sales and Operations Planning process, adopting a forecasting tech-nique to effectively plan for future production, and determine effective ways of plan-ning inventory depending on the demand forecast. The demands for machines the com-pany produces have been stochastic given the type, segment of low volume high variety production and market conditions. Also, there exists an uncertainty in the inventory management due to varying delivery times for various customers and market condi-tions. Due to these uncertainties, the forecast or sales budget sometimes deviated from the actual sales by 85% and sometimes 30%. Skype meetings with company personnel also revealed that the sales team that operated overseas was generally overoptimistic in predicting the sales of the machines, due to which, the supply chain operations were
Findings
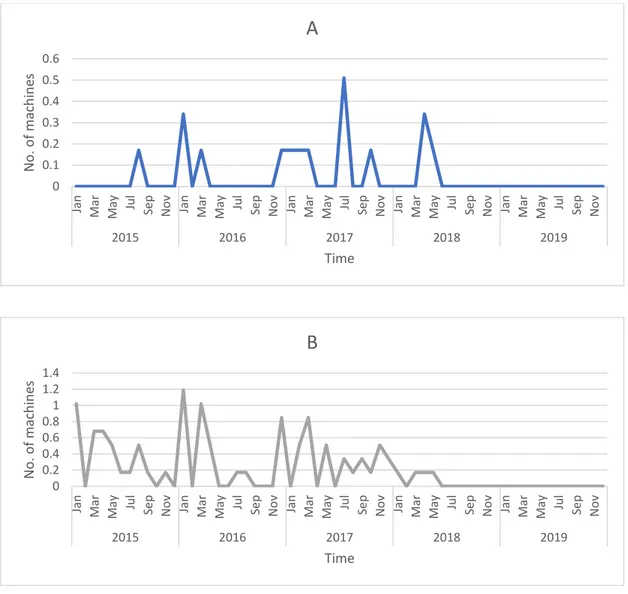
often disrupted. Such practice of prediction is similar to judgement-based forecast where demand is guessed. The arising disruptions are similar to turbulence for a HVLV system as descried earlier using the arguments of Jina, Bhattacharya, & Walton, (1997). Although the customers were aware of the lead times for their orders, which is usually about four to six months, some orders had been signed to be delivered within the span of one month. This caused irregularities in supply chain operations such as procure-ment. Below we present the sales trend of the machines over the last four years (see figures 7-9).
Figure 7. Actual demand data A, B machines 0 0.1 0.2 0.3 0.4 0.5 0.6
Jan Mar May Jul Sep No
v
Jan Mar May Jul Sep No
v
Jan Mar May Jul Sep No
v
Jan Mar May Jul Sep No
v Jan Mar May Jul Sep No v 2015 2016 2017 2018 2019 N o . o f ma ch in es Time
A
0 0.2 0.4 0.6 0.8 1 1.2 1.4Jan Mar May Jul Sep No
v
Jan Mar May Jul Sep No
v
Jan Mar May Jul Sep No
v
Jan Mar May Jul Sep No
v Jan Mar May Jul Sep No v 2015 2016 2017 2018 2019 N o . o f mach in es Time
B
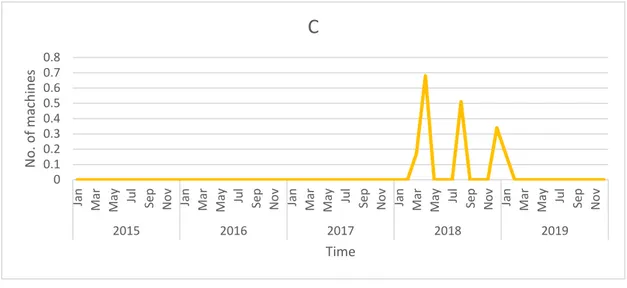
Figure 8. Actual demand data C, D, E machines 0 0.1 0.2 0.3 0.4 0.5 0.6 0.7 0.8
Jan Mar May Jul Sep Nov Jan Mar May Jul Sep Nov Jan Mar May Jul Sep Nov Jan Mar May Jul Sep voN Jan Mar May Jul Sep Nov
2015 2016 2017 2018 2019 N o . o f mach in es Time
C
0 0.05 0.1 0.15 0.2Jan Mar May Ju
l Se p N o v
Jan Mar May Ju
l Se p N o v
Jan Mar May Ju
l Se p N o v
Jan Mar May Ju
l Se p N o v
Jan Mar May Ju
l Se p N o v 2015 2016 2017 2018 2019 N o . o f mach in es Time
D
0 0.05 0.1 0.15 0.2Jan Mar May Jul Sep Nov Jan Mar May Jul Sep Nov Jan Mar May Jul Sep Nov Jan Mar May Jul Sep voN Jan Mar May Jul Sep Nov
2015 2016 2017 2018 2019 N o . o f mach in es Time
E
Findings
Figure 9. Actual demand data F, G & H machines 0 0.05 0.1 0.15 0.2 0.25 0.3 0.35 0.4
Jan Mar May Ju
l Se p N o v
Jan Mar May Ju
l Se p N o v Jan Mar May Ju l Se p N o v
Jan Mar May Ju
l Se p N o v Jan Mar May Ju l Se p N o v 2015 2016 2017 2018 2019 N o . o f mach in es Time
F
0 0.05 0.1 0.15 0.2 0.25 0.3 0.35 0.4Jan Mar May Ju
l Se p N o v
Jan Mar May Ju
l Se p N o v Jan Mar May Ju l Se p N o v
Jan Mar May Ju
l Se p N o v Jan Mar May Ju l Se p N o v 2015 2016 2017 2018 2019 N o . o f mach in es Time
G
0 0.02 0.04 0.06 0.08 0.1 0.12 0.14 0.16 0.18Jan Mar May Ju
l Se p N o v
Jan Mar May Ju
l Se p N o v Jan Mar May Ju l Se p N o v
Jan Mar May Ju
l Se p N o v Jan Mar May Ju l Se p N o v 2015 2016 2017 2018 2019 N o . o f mach in es Time
H
The data was extracted from the company’s ERP systems and further used to select a method of forecasting based on the trends presented in Figure 7, Figure 8 & Figure 9. The data presented extend from 2015 to February of 2019. The data from these plots were coded in excel to produce a three-period moving average, weighted moving aver-age and exponential smoothing which will be presented in the analysis chapter. Sum-marising the current state of the company is Table 3 with highlights of different param-eters. It defines certain procedures that the company currently follows without imple-menting a formal sales and operations procedure. The categorisation is based on the input data which consists of historical data, interviews, meetings and observations. Data pertaining to all the machines, their forecast errors that exist, and the sales trends can be found in Appendix 3 Detailed forecast errors & Appendix 4
Findings
Table 3. Current state of the host company
Stage 1 Stage 2 Stage 3 Stage 4 Stage 5
Meetings, Collabora-tions Silos struc-ture No meet- ings/collab-orations Top level meetings, Finance tar-get priori-tised Staff pre-meeting, Executive S&OP Integrated customer and sup-plier data, suppliers and cus-tomers part of meet-ings. Meetings based on events over scheduled ones, real time exter-nal data Organiza-tion No S&OP No formal S&OP, Parts of S&OP at places S&OP inte-gral of some de-partment. Ex Supply chain, prod-uct man-ager Formal S&OP team, par-ticipation of executives S&OP un-derstood by entire or-ganisation Measure-ments None Measuring how well operations meet sales Stage 2 + measuring sales for forecast ac-curacy Stage 3 + new prod-uct launch, S&OP ef-fectiveness Stage 4 + Profitability IT No infor-mation sharing, Managers have sepa-rate spread-sheets Limited sharing of spread-sheets done manually Centralised infor-mation, software for planning operations Batch pro-cess, ERP system linked to sales and operations, S&OP team Integrated S&OP soft-ware, inter-faced with ERP, ac-counting & forecasting. S&OP In-tegration No formal-ised plan, Operations tries to ful-fil incom-ing orders Sales drives operations, Top down approach. Limited plan inte-gration, Bottom up approach Highly inte-grated plan, concurrent approach, Seamless integrated plans, opti-mised pro-cesses for profits
5
Analysis
This chapter provides the reader with knowledge of how the findings relate to the theory already available. Given the context and scope of this thesis, the findings are analysed with the theories presented in the theory chapter.
In the case study, the current state of the company which produces high variety of prod-ucts in low volume is that it is yet to implement the sales and operations planning pro-cess. Upon analysing the quantitative data from the company’s ERP systems, it has been evident that the forecast methods have been an issue for the supply chain division in their operations. Given that the current method of forecasting is probability, there have been errors of up to 85%, which is proof of probability being a less effective method of forecasting techniques. From the analysis of the findings, it is evident that a forecasting technique such as three period moving average can be used to predict the demand based on the actual demand of previous periods.
The technique of three period moving average was tested on the demand data of one of the machines to find out how the data can be smoothened out to achieve an even tran-sition of demand data to production planning. Although there maybe a number of revi-sions required as time progresses, the method can be used as a basis for beginning the planning process. Given below in Table 4. Table 4 and Table 5 is a comparison of how the different forecasting techniques stack up against each other in the monthly forecasting analysis. While 3PMA, WMA & EXP represent the forecasting techniques, COMP rep-resents the values existing in the company.
Table 4. Monthly machine production rate in percentage based on various forecasting meth-ods
2016
G Jan Feb Mar Apr May Jun Jul Aug Sep Oct Nov Dec
3PMA 9.92 9.92 9.92 9.92 9.92 9.92 9.92 9.92 9.92 9.92 9.92 9.92 WMA 0.00 0.00 0.00 0.00 0.00 0.00 0.00 0.00 0.00 0.00 0.00 0.00 EXP 2.83 2.83 2.83 2.83 2.83 2.83 2.83 2.83 2.83 2.83 2.83 2.83 COMP 0.00 51.00 0.00 34.00 0.00 0.00 0.00 0.00 17.00 17.00 0.00 0.00
2017
G Jan Feb Mar Apr May Jun Jul Aug Sep Oct Nov Dec
3PMA 18.42 18.42 18.42 18.42 18.42 18.42 18.42 18.42 18.42 18.42 18.42 18.42 WMA 12.75 12.75 12.75 12.75 12.75 12.75 12.75 12.75 12.75 12.75 12.75 12.75 EXP 4.96 4.96 4.96 4.96 4.96 4.96 4.96 4.96 4.96 4.96 4.96 4.96 COMP 0.00 17.00 17.00 17.00 34.00 17.00 51.00 17.00 17.00 17.00 0.00 17.00
Analysis
Table 5. Monthly machine production rate in percentage based on various forecasting meth-ods
2018
G Jan Feb Mar Apr May Jun Jul Aug Sep Oct Nov Dec
3PMA 10.39 10.39 10.39 10.39 10.39 10.39 10.39 10.39 10.39 10.39 10.39 10.39 WMA 12.70 12.70 12.70 12.70 12.70 12.70 12.70 12.70 12.70 12.70 12.70 12.70 EXP 9.00 9.00 9.00 9.00 9.00 9.00 9.00 9.00 9.00 9.00 9.00 9.00 COMP 0.00 17.00 17.00 34.00 17.00 0.00 0.00 34.00 34.00 34.00 0.00 0.00
2019
G Jan Feb Mar Apr May Jun Jul Aug Sep Oct Nov Dec
3PMA 12.91 12.91 12.91 12.91 12.91 12.91 12.91 12.91 12.91 12.91 12.91 12.91 WMA 13.25 13.25 13.25 13.25 13.25 13.25 13.25 13.25 13.25 13.25 13.25 13.25 EXP 9.41 9.41 9.41 9.41 9.41 9.41 9.41 9.41 9.41 9.41 9.41 9.41 COMP 17.00 17.00 17.00 17.00 34.00 0.00 34.00 0.00 17.00 17.00 17.00 0.00
The above analysis has been performed for one machine; G, due to the relatively high volume of sales, which makes the comparison of numbers much easier. Now that the forecasting methods applied have been proven to be more effective than the existing technique at the company in Table 6, we see how even distribution of these values hold up for a year’s production against the company’s given values in Table 4 and Table 5. 3PMA represents 3-period-moving average; WMA represents weighted moving aver-age; EXP stands for exponential smoothing and COMP depicts the company’s plans of production. The production levels are assumed to be constant throughout the year for ease of analysis, which means that the company works all-round the year. The even distribution, although very ideal, provides a basis to plan the operations of the company in such a way that the working capital is also maintained at a constant level, without many peaks and crevices. This is further depicted in Figure 10.
Figure 10. Comparison of forecasting techniques
The Figure 10 also provides information on keeping the production levels even by smoothening out the demand. While the company’s demand has null values and high peaks, the techniques used provide almost no null values, which means that the com-pany is producing at all times at a reduced rate to keep up with the demand. When we compare these values to the actual sales, they are closer than the values predicted by the company based on probability.
Table 6. Forecasting techniques on yearly basis
G Company pre-dicted demand 3-period moving average Weighted moving average Exponential smoothing Company actual sales 2015 0.00 - - 0.00 0.34 2016 1.19 - - 0.34 1.36 2017 2.21 - - 0.60 0.68 2018 1.87 1.25 1.53 1.08 1.53 2019 1.87 1.55 1.52 1.13 0.17* 2020 - 1.67 1.59 1.26 -
*current production year
Table 6. Forecasting techniques on yearly basisshows how the forecasting techniques com-pare with each other when the analysis is extended to the yearly basis. Different meth-ods provide forecast numbers which are compared with each other, the company’s pre-dicted demand and the actual demand. Due to lack of abundant data, the analysis shows different methods being accurate for different time periods. However, further research for an extended time period might reveal which method provides a long-term solution to improve the forecast accuracy. The closest values to actual sales have been high-lighted. However, we can also see that the numbers produced by the forecast methods are closer to the actual sales values than compared to the company’s predicted values. This confirms that one of the forecasting techniques need to be used in order to provide the company with a basis for its sales and operations planning. The company also must account for qualitative data while keeping the forecasting as the base.
0.00 10.00 20.00 30.00 40.00 50.00 60.00
Jan Mar May Jul Sep Nov Jan Mar May Jul Sep Nov Jan Mar May lJu pSe Nov Jan Mar May Jul Sep vNo Jan Mar May Jul Sep Nov
2015 2016 2017 2018 2019 Pro d u ctio n p erce n ta ge Time
Machine production rate vs forecasting techniques
Analysis
Given the production environment, market conditions and the practices of the company, make-to-stock is adopted in the company’s production line. While this is the case within the company’s production, the sales team operating mostly outside the company’s premises works in the basis of make-to-order. This decoupling point has been a bit of an issue for the company as the data transfer has proved less effective. Therefore, the production section comprising of HVLV often gets disrupted which as per Jina, Bhattacharya, & Walton, (1997) is turbulence and is difficult to absorb. The common ground of understanding between the two domains seems to be missing as the manage-ment is unaware of the sales and operations planning process benefits and the im-portance of linking the two sides of the decoupling point. On the basis of argument of Ambrose & Rutherford (2016) information sharing between the two sides is vital for S&OP. It also validates the argument of McCall (2013) which says there is less involve-ment of sales team in operations process.
The scope of this thesis lies within the initial stages of the sales and operations planning process, meaning that the main focus is on data gathering, the first step of sales and operations planning as suggested by Wallace (2006). The results of data gathering sug-gests that the rest of the steps of sales and operations planning have not been formally defined by the company yet. And there are a number of steps that can be taken to im-plement the process.
Given the low volume of products being manufactured at the company, the delivery times are rather long, about four to six months. This gives the company a good amount of time to plan effectively once a standard procedure is defined and a forecasting method is adopted. According to Steinrücke & Jahr (2012) and as per Figure 4, plan-ning can also be done for different time horizons namely, short-term, which is opera-tional level, medium-term, which is tactical level and long-term, which is strategic level. The short-term planning is mostly daily activities such as warehousing, lot sizing, transport planning, production scheduling, etc. The mid-term planning stretches further in terms of time and processes by planning for activities such as distribution planning, material resources planning, master planning and capacity planning. The long-term planning takes more of an executive or top management view by extending to activities such as supplier selection, plant location and network structure (Steinrücke & Jahr, 2012). There has been very limited scope in the company in regard to the planning process. Also, for a company with both MTO and MTS practices, it becomes imperative to bring the strategies on the same page, which is also one of the primary objectives of sales and operations planning of harmonising sales plan and production as pointed out by (Olhager, Rudberg, & Wikner, 1999). S&OP results in alignment of the two pro-cesses which supports the idea of (Plank & Hooker, 2014).
6
Discussion and conclusions
6.1 Discussion of methods
The method adopted in completion of this thesis were in line with the scope and the formal procedures that need to be followed in implementing the process of sales and operations planning as suggested by Wallace (2006). Since the process of sales and operations planning is vast, the data collection and the support from management form an integral part of the process. This calls for a combination of top-down and bottom-up approaches for sales and operations planning.
The initial step of data gathering also revealed details on inexistence of forecasting techniques. This provides us with justification as for the basis of sales and operations planning, which turns out to be one of the most important steps, providing a strong backing for the used methods.
While qualitative data can be rated high on validity, the quantitative data scores more on both reliability and validity. This can be justified as different techniques of forecast-ing were tried on data that already existed and the best methods of weighted movforecast-ing average and exponential smoothing can be considered, which predicted sales closest to the actual sales in the previous years. We can see that the aforementioned methods prove effective for different periods. However, it is too soon to zero down on one method to adopt for implementation at the company. Also, the methods of three-period moving average and weighted moving average have another downside which is, it fails to deliver results in the first three periods of the forecast due to the limitations of the methods itself. And hence we can only see results of these methods in the last two years of the analysis. However, this is not the case with exponential smoothing. It does deliver results from the second period of analysis, but like mentioned earlier, it would be too soon to zero down on the method for a long-term solution.
The data collection techniques in obtaining quantitative data has also proven effective in fulfilling the purpose of this thesis. Given the limitations regarding inaccessibility to certain company personnel, Skype meetings were scheduled due to their location over-seas. While most meetings at the company were one on one and open-ended interviews, it helped in gathering the required qualitative data.
6.2 Discussion of findings
The purpose of this thesis was to gain insight into sales and operations strategies that can be used to shorten lead times in the given context of low volume and high variety production. The findings show that in order to start the process, there is a requirement of coordination and integration of the company, which includes various domains such as sales, marketing, production and operations. Given these basic requirements, adopt-ing a forecastadopt-ing technique becomes one of the primary steps towards this improvement process. Table 7 shows the possible future state of the company once the suggested techniques and processes are implemented.
Discussion and conclusions
Table 7. Possible future state of the company
Stage 1 Stage 2 Stage 3 Stage 4 Stage 5
Meetings, Collabora-tions Silos struc-ture No meet- ings/collab-orations Top level meetings, Finance tar-get priori-tised Staff pre-meeting, Executive S&OP Integrated customer and sup-plier data, suppliers and cus-tomers part of meet-ings. Meetings based on events over scheduled ones, real time exter-nal data Organiza-tion No S&OP No formal S&OP, Parts of S&OP at places S&OP inte-gral of some de-partment. Ex Supply chain, prod-uct man-ager Formal S&OP team, par-ticipation of executives S&OP un-derstood by entire or-ganisation Measure-ments None Measuring how well operations meet sales Stage 2 + measuring sales for forecast ac-curacy Stage 3 + new prod-uct launch, S&OP ef-fectiveness Stage 4 + Profitability IT No infor-mation sharing, Managers have sepa-rate spread-sheets Limited sharing of spread-sheets done manually Centralised infor-mation, software for planning operations Batch pro-cess, ERP system linked to sales and operations, S&OP team Integrated S&OP soft-ware, inter-faced with ERP, ac-counting & forecasting. S&OP In-tegration No formal-ised plan, Operations tries to ful-fil incom-ing orders Sales drives operations, Top down approach. Limited plan inte-gration, Bottom up approach Highly inte-grated plan, concurrent approach, Seamless integrated plans, opti-mised pro-cesses for profits
6.3 Discussions of analysis
In this section, the answers to research questions are presented.
RQ1: How forecasting can be used to facilitate sales and operations planning in low volume, high variety production environment?
As it has been proved in this case that forecasting is suitable for high variety low volume manufacturing originating from MTO strategy, justifying the argument of (Gansterer, 2015) which states that forecasting is not entirely obsolete for MTO production. In this case, the results have been two-fold, one for short-term and one for long-term. As for the short-term, the forecasting technique of exponential smoothing conforms to the ac-tual demand values as seen at the host company. However, the difference between the three forecasting techniques used, namely, weighted moving average, three-period moving average and exponential smoothing, all provide results that are very close to each other. But for long term, either weighted moving average or three-period moving average techniques can be used for increased forecast accuracy to facilitate sales and operations planning. Forecasting techniques can be applied primarily by the supply chain division for procurement processes to level out production and then be extended to the sales team to increase the forecast accuracy. Therefore, the forecast in this context can be categorised as strategic forecast. This strategic forecast can be used for planning for procurement of inventory as pointed out by (Duus, 2016). As it was mentioned ear-lier, for this context the supplier lead times for components is very high and uneven. Therefore, such strategic forecast can assist in planning for components well in ad-vance. Moreover, such a strategic forecast should be developed through collaboration of sales and production team. Therefore, alignment can be obtained on both the sides which is necessary for sales and operations planning.
RQ2: How S&OP can be structured in balancing of demand and supply for HVLV context?
Based on the S&OP concepts put forward in theory and understanding of the context, a structure of S&OP is proposed here. The contextual variable of manufacturing strategy is found to be MTO which gives rise to HVLV production environment. To begin with, the framework of integration of marketing and operations by (Malhotra & Sharma, 2002) puts S&OP in the middle of strategic and tactical planning. In this context how-ever, it was revealed that forecasting not only facilitates S&OP but at strategic levels helps in mid-term planning. Therefore, for HVLV systems S&OP should be coupled with visionary forecasting for effective linking of marketing and operations. This will also increase involvement of sales team towards production. Of the listed response var-iables, meetings and collaborations dedicated for S&OP is found to be necessary. In-formation sharing can be done by manually sharing of spreadsheets. A dedicated IT system for S&OP can be looked upon when the process advances into advance stages such as 4 and 5. A formation of team comprising of key personnel from departments of sales, supply, production needs to be formed. This team could be deemed as executive S&OP team. The visionary forecast done at strategic level should serve as a guide to
Discussion and conclusions
these executives. Interdisciplinary meetings should be done on a regular basis to plan for supply and demand. On the basis of the supply chain planning matrix of (Steinrücke & Jahr, 2012) S&OP in this context should be mix of long term and mid-term planning. The procurement stage should be planned for long term basis based on visionary fore-cast and should account for placing orders from suppliers for components. Long deliv-ery times of components can be dealt with at procurement stage. The following stages of production, distribution and final sales should have midterm planning approach. In-formation flow among these stages should be moderated by the dedicated S&OP team. The advance stages of S&OP given by integration framework of Grimson & Pyke (2007) could be used as milestones by the team. The team should accordingly make advancements in organization, IT systems, team members and measurements. In the present context measurements should be prioritised on conformance between daily op-erations and sales target. Following Figure 11 is a framework that highlights structure of S&OP in the context of HVLV manufacturing.
Figure 11. Structured S&OP in HVLV context
6.4 Further directions of research
The above structured S&OP model (Figure 11) is at an executive level for HVLV con-text. At the detailed level steps can be taken for procurement planning, operations plan-ning measurement and distribution. For procurement planplan-ning we recommend selecting ordering points in the supply chain for components of the machines planned to be man-ufactured. Such an order point can be derived by analysing commonly shared parts be-tween machines and their subsequent delivery times from suppliers. Further the finance aspect needs to be considered for this context. The working capital for this model will follow a smoother curve which in common terms translates to level production and level
S&OP team with key people
Procurement planning (Long term)
Operations planning and measurement (mid term)
Distribution and sales (mid term)
Strategic level planning. Visionary forecast agreed
upon by the team
Tea m m o d era ted in fo rm ati o n f lo w
the production operations will spread equally through the curve. Therefore manpower, resources might need alteration which needs further investigation.