Department of Economics
The phase-out of crop-based biofuels in EU
by 2030
- Analyzing the effects on the palm oil market and
𝐶𝑂
2emissions
Sanae Sone Dy
Independent project • 15 credits
Agricultural programme - Economy 300.0 hpDegree thesis/SLU, Department of Economics, 1204 • ISSN 1401-4084 Uppsala 2019
The phase-out of crop-based biofuels in EU by 2030
- Analyzing the effects on the palm oil market and 𝐶𝑂2emissionsSanae Sone Dy
Supervisor: Yves Surry, Swedish University of Agricultural Sciences, Department of Economics
Examiner: Jens Rommel, Swedish University of Agricultural Sciences, Department of Economics
Credits: 15 credits
Level: First cycle, G2E
Course title: Independent project in economics
Course code: EX0903
Programme/education: Agricultural programme - Economy 300.0 hp
Course coordinating department: Department of Economics
Place of publication: Uppsala
Year of publication: 2019
Cover picture: Unknown photographer (CC BY-NC-ND) Title of series: Degree thesis
Part number: 1204
ISSN: 1401-4084
Online publication: https://stud.epsilon.slu.se
Keywords: Biofuel, Palm oil, International trade, Partial equilibrium, RED, REDII, ILUC, CO2 emissions, carbon dioxide
Swedish University of Agricultural Sciences
Faculty of Natural Resources and Agricultural Sciences Department of Economics
iii
Abstract
When EU introduced the Renewable Energy Directive (RED) in 2009, one of the goals where that by 2020 every EU country should have 10% of their transportation running on biofuels. This made the market for biofuel rise and therefore also the exports of palm oil to the EU. In 2017, 3,9 million tons of palm oil was used for biofuels and that is a share of 51% of all palm oil imported in to the EU. In 2018, EU updated the RED and is now called REDII. One of the criteria was to phase-out crop-based biofuels with high Indirect Land Use Change (ILUC) risk by 2030. The palm oil used for biofuel in EU is questionable as an environmental and sustainable fuel. This thesis investigates the phase-out of crop-based biofuels with high ILUC risk by 2030 in EU, its impact on the palm oil market and 𝐶𝑂2 emissions. This is simulated with a quota on imported palm oil to EU in a partial equilibrium model. The results from the simulation show that there is a small distortion from the introduced quota and an overall negative welfare effect. Concluding that the REDII and its phase-out of crop-based biofuels, may not have the impact on less land being converted, from biodiverse forest to plantations. The calculations and methods used for establishing the reduction of 𝐶𝑂2 emissions from the
ILUC, vary too much to have a stable and reliable result.
Keywords: Biofuel, Palm oil, International trade, Partial equilibrium, RED, REDII, ILUC,
iv
Sammanfattning
När EU introducerade Renewable Energy Directive (RED) 2009, var ett av målen att 10% av alla transportmedel i medlemsländerna skulle drivas på biobränsle år 2020. Införandet av direktivet ökade efterfrågan på biobränsle, det medförde att exporten av biobränsle till EU växte. År 2017 användes 3,9 miljoner ton palmolja till biobränsle i EU. Det är 51% av all palmolja importerat till EU. RED uppdaterades år 2018 och fick namnet REDII. I den nya versionen sattes ett nytt mål upp; en utfasning av spannmålsbaserat biobränsle med hög risk för Indirect Land Use Change (ILUC), utfasningen ska vara klar år 2030. Det är tveksamt om palmolja är ett bra alternativ som bränsle för att minska påverkan på miljön och som ett hållbart substitut till fossila bränslen. I denna uppsats undersöks utfasningen av spannmålsbaserat biobränsle med hög risk för ILUC och dess påverkan på palmoljemarknaden och 𝐶𝑂2 utsläppen. Det simuleras genom att använda en kvot på importerad palmolja till EU i en partiell jämviktsmodell. Resultatet av simuleringen visar en liten förändring på marknaden när importkvoten introduceras och välfärdseffekten är övergripande negativ. Slutsatsen är att REDII kanske inte minskar omvandlingen av regnskog till palmoljeplantager. Metoder och uträkningar använda för att kunna etablera minskningen av 𝐶𝑂2 utsläppen från ILUC är av stor
variation, resultaten är därför inte trovärdiga.
Nyckelord: Biobränsle, Palmolja, Internationell handel, Partiell jämviktsmodell, RED, REDII,
v
Table of Contents
List of Figures ... vi List of Tables ... vi Acknowledgments ... vii Abbreviations ... viii 1. Introduction ... 1 1.1 Background ... 11.2 Objective and research question ... 5
2. Literature review ... 6 3. Trade theory ... 9 4. Method ... 11 4.1 Conceptual model ... 11 4.2 Data ... 12 4.3 Model Implementation ... 15 5. Results ... 17 6. Discussion ... 22 6.1 Conclusions ... 24 References ... 26
Appendix A – Simulated model ... 30
Appendix B – Calculations ... 31
Appendix C – Sensitivity Analysis ... 32
Appendix D – Welfare effects from sensitivity analysis ... 35
vi
List of Figures
Figure 1. Vegetable Oils Monthly Average – May 2018-May 2019 ... 1
Figure 2. Biodiesel use of major feedstock (MT) ... 3
Figure 3. Import quota (large country case) ... 9
Figure 4. Import quota (small country case) ... 10
Figure 5.Share of vegetable oil used for biodiesel production ... 13
List of Tables
Table 1. Variable definitions ... 11Table 2. Data on average trade flows 2015/16-2017/18 and average price 2015-2016 ... 12
Table 3. Values on elasticities ... 13
Table 4. Results in trade flows and domestic prices for all regions ... 17
Table 5.Results of changes in producer and consumer surplus and world price for all regions ... 18
Table 6. Results on: world welfare effects and quota rent ... 19
Table 7. Terms of trade (Indonesia and Malaysia) ... 19
Table 8. Total reduction in 𝑪𝑶𝟐 emissions from Indonesia and Malaysia together ... 20
vii
Acknowledgments
First of all, I want to thank my husband Jodennis T. Dy for always supporting me and for being understanding when I need to study late. To my parents who always have a helping hand when me and my family needs it, especially when I am stressed about my school work, a big thank you. Yves Surry, without your guidance this could not have been possible, and it has really been an eyeopener. And of course, my classmates Emma Pettersson and Ulrika Aschan, for laughter and advice, it would not have been as fun writing without you guys.
viii
Abbreviations
EU European UnionRFS Renewable Fuel Standard program MT Metric ton
RED Renewable Energy Directive REDII Renewable Energy Directive II LUC Land Use Change
ILUC Indirect Land Use Change 𝐶𝑂2 Carbon dioxide
WTO World Trade Organization IND Indonesia
MAL Malaysia ROW Rest of the world
NGO Non-governmental organisation WEO Waste edible oil
1
1. Introduction
1.1 Background
Palm oil market at a glance
The oil palm came to South East Asia through trade around 1848. The purpose was not to extract oil, quite contrary, the oil palm was planted in Java at the Bogo Botanic Gardens (for non-production purpose) which was situated in the, then, Dutch East Indies (Corely & Tinker 2016). Before all that happened, in 1562 slave trade in West Africa began and palm oil was often used in food for them. It was in 1809, when the slave trade had stopped that the palm oil was traded for more commercial reasons. Trade with palm oil was unstable until around 1850 and at that time, the British government had promoted trade with palm oil for a while. The demand where now increasing.
The main exporters before the World War II where countries in West Africa (Corely & Tinker 2016). After the war Malaysia had caught up and where key producers of the palm oil and continued to evolve, this led to a liner growth in planted area until the end of the 20th century. Indonesia had a slower growth because of the battle of independence, their palm oil production exceeded Malaysia in 2006 and has since then been the largest exporter of palm oil. Indonesia and Malaysia have together dominated the palm oil market since 1970. In 2018, they supply around 80% of the palm oil in the world (Oil world 2018).
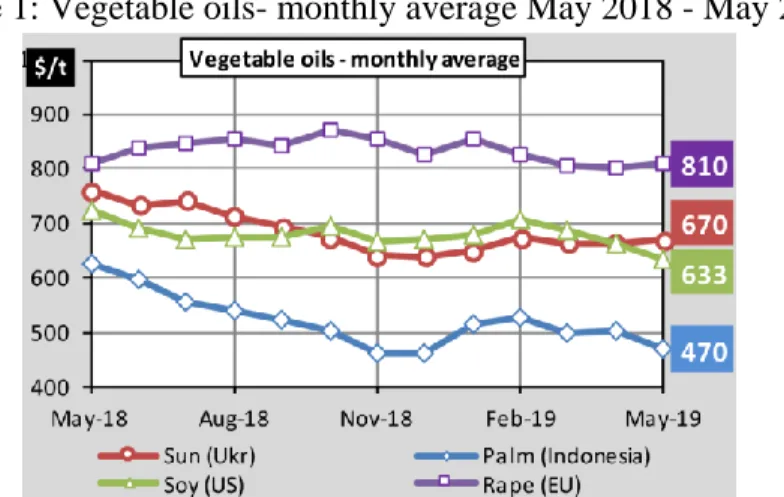
The major increase in demand for palm oil origins both from the low price, compared to other oilseeds (see Figure 1), and from its special characteristics (Corely & Tinker 2016) (Tan et al. 2009). So, how can palm oil keep having a lower price compared to other vegetable oils? There seem to be several elements that makes this possible.
Figure 1: Vegetable oils- monthly average May 2018 - May 2019
Source: European commission (a) (2019).
First, intervention and support from the government in Indonesia and Malaysia. The government have been highly involved in the expansion of the palm oil production. For example: development of efficient supply chains, plant breeding, good management and a reputation as a dependable trade partner (Official Portal of Malaysian Palm Oil Board 2019) (Thoenes 2006, p. 2).
2
Second, that oil palm is more productive per unit land compared to other oil crops. The oil palm yields more oil per hectare than other oil crops, for example soybean. To compare, oil palm yields around 3.1-5 MT oil per hectare/year compared to soybean that yields 0.4-0.6 MT per hectare/year (Erixon 2012, p.19). That is a significant difference and contributes to the low price.
Third, the low production costs. Perfect conditions for the oil palm together with the low wages in these countries, makes production costs in Indonesia and Malaysia the lowest on the market (Corely & Tinker 2016). A proof of the iron hand they have on the palm oil market, is to look at produced palm oil in 2017/18: Indonesia produces 56% palm oil to the market and Malaysia 28%, to compare with the third largest producer Thailand, which only produce 4% (USDA 2019).
What are the palm oils characteristics that makes it so popular? Palm oil is a very versatile oil and can be used in many different areas (Corely & Tinker 2016). As early as 1589 palm oil was used for making soap in Europe, and today palm oil can be found in shampoos, ice-cream, baking – and dairy products and that’s just a few examples. It is often used for deep frying, mainly because it is more stable at high temperatures compared to other unsaturated oils. Palm oil is very diverse and that adds up to the increased demand. The market for palm oil has flourished in the last decade, in just in 10 years the demand has increase with around 89% (USDA 2019) (Erixon 2012).
Biofuel Market at a glance
The biofuel market all over the world has thrived since the beginning of the 2000’s (OECD/ FAO 2016). This is a reaction to the increasing climate change caused by greenhouse gas emissions, where a switch from fossil fuels to biofuels is believed to decrease the emissions from transportation. Intervention from the government has been the main tool to make the demand increase through blending mandates, exceptions from taxes and investment support. Examples of that is the Biofuel Directive set by EU in 2003 and the Renewable Fuel Standard program (RFS) set by USA in 2006 (UNCTAD 2014).
There are two main fuels on the biofuel market: ethanol and biodiesel. USA and Brazil are the leading users and producers for ethanol, crops often used for ethanol is maize and sugarcane (USDA 2015) (OECD/FAO 2018). In EU, rapeseed is the crop mainly used and produced for alternative fuel and is usually blended with diesel to produce biodiesel (Erixon 2012) (Moschini et al. 2012).
Soybean and palm oil are two oilseeds that have increased its shares on the biodiesel market (see Figure 2), they are also forecasted to increase because of the lower price they hold, especially palm oil (OECD/FAO 2016).
3
Figure 2: Biodiesel use of major feedstock (MT)
Source: Oil world (2018)
RED
EU imports 15% of all palm oil in the world, the increase in demand for palm oil can partly be explained by a directive that was set in 2008/09 called Renewable Energy Directive (RED). The purpose was to promote more sustainable energy, like biofuels, in the transport sector. This directive was developed to reach the goals that was set in the Kyoto protocol connected to the reduction of greenhouse gases (EUR-Lex 2009 p. 16). Early in the RED it is stated that ”In
particular, increasing technological improvements, incentives for use and expansion of public transportation, the use of energy from renewable sources in transport are some of the most effective tools by which the Community can reduce its dependence on imported oil in the transport sector, in which the security of energy supply is most acute” (EUR-Lex 2009, p. 16).
The directive is pushing for more renewable energy in the transport sector and the importance to move away from fossil fuel.
A national mandatory target was set in RED, that 20% of all energy should be from renewable sources by 2020 (EUR-Lex 2009, p. 17). And a specific target for transportation, that 10% for all energy in transport should be from renewable sources by 2020. The 10% goal in the transport sector is not required but desired to be reached through a combination of domestic production and imports (EUR-Lex 2009, p. 18).
The problem with the increasing demand for biofuels is that it reinforces the Land Use Change (LUC) in biofuel producing countries, for example in Indonesia and Malaysia. There is of course a huge profit to be made and a lot of rainforest to be converted into palm oil plantations in these countries. On the other hand, it is specified in the RED that the increasing demand for biofuels and bioliquid (not discussed in this paper) should not support destruction of biodiverse land (EUR-Lex 2009, p. 23). This is elaborated more clearly in Article 17, it roughly says that the biofuel should not originate from land with “high biodiversity value” (EUR-Lex 2009, p. 37). What is “high biodiversity value “? They consider land that have certain importance, for example primary forests with high carbon stock or highly biodiverse grassland that can be found in January 2018 and after.
4
REDII
Clearly, RED had the ambition to decrease greenhouse gases. That the biofuel used should not have a negative impact on land with high biodiversity, but what went wrong? In a report from the European commission in March 2019, it is stated that the RED did not address the indirect impacts rather only limit the direct impacts of producing biofuels. The indirect land use change (ILUC) is defined as: agricultural land that was used for food and feed markets that is
instead devoted to production of fuels from biomass (European commission 2019). The food
or feed need to be produced on other sites, and in some cases conversion of land with high carbon stocks occurs and will lead to greenhouse gas emissions.
On 24 December 2018 a revised version of RED was implemented and is called REDII, it has a set of new regulations connected to emissions from ILUC. The new overall goal is a 32% share of renewable energy by 2030 (EUR-Lex 2018, p. 82). That target is based on the Paris agreement from 2015, which aims to reduce greenhouse gases and prevent the climate change. The specific rules for biofuels are presented in Article 26, where they limit the share of biofuels, bioliquids and biomass fuels that come from food and feed crops. The share should not exceed 7% of consumption of energy in the road and rail transport by 2020. This is accompanied by a phase-out of crop-based biofuels, bioliquids and biomass fuel with high ILUC risk that will take place from 31 December 2023 to 31 December 2030. Until 31 December 2023 European countries are not allowed to exceed their consumption of high ILUC risk fuels that they had in 2019.
Deforestation
Palm oil is a very controversial commodity, mostly because of the deforestation of rainforest and its indirect effect on the climate. Forests is a large carbon sink and when they are logged the carbon is released into the atmosphere which reinforces the climate change (Perman et al. 2011, pp. 626-629).The big players on the palm oil market is Malaysia and Indonesia and the deforestation of rainforest in these countries occurs primarily because of new palm oil plantations.
Many have contributed to the discussion about the increased demand for biofuel over the world, and that it triggers the deforestation and conversion of rainforests to palm oil plantations. Mekhilef et al. (2011) investigate the palm oil used for biodiesel in Malaysia, from a technological aspect. They point out the advantages and disadvantages using palm oil for biodiesel. The advantages include that palm oil is biodegradable and thus safe to handle, and that it has brought technical development to Malaysia in this specific area. The disadvantages are focused on more in this thesis, which Mekhilef et al. covers: the impact on the environment. This include deforestation of forestland that causes a disruption in the ecosystem and that the carbon stocks cycles are interrupted, when forests and peat lands is converted to palm oil plantations.
Tan et al. (2009) also bring light to the problem, surrounding the deforestation of virgin tropical forests for palm oil plantations in South East Asia. The extinction of many animal species is said to be caused by the expansion of the plantations. Some of the animals close to extinction is Asian elephants, Sumatran rhinos, Sumatran tigers and orangutans. The orangutan, you can say, is the face of all the negative effects of palm oil. Orangutans requires tropical forests for food and nesting sites; what happens when deforestation occurs in these areas is that
5
orangutans has to change environment which is less optimal. Death rate goes up among orangutans and less orangutans are born. They also get confused and end up in their old habitats that is now palm oil plantations, they are killed for meat or because plantation owners want to protect the oil palm fruits. Tan et al. also cover the peatland fires that emit a huge amount of 𝐶𝑂2. Peatland fires are used for clearing land to cultivate for crops like palm oil (UN
environment 2018). These fires are easily spread when South East Asia has its dry season and has caused a lot of damage. This is just a selection of what the consequences are of the ongoing expansion of palm oil plantations in countries that hold high biodiverse values in their forests.
1.2 Objective and Research question
The big exporters on the palm oil market are Malaysia and Indonesia. The deforestation of rainforest in these countries occurs mainly because of new palm oil plantations. The palm oil used for biofuel in EU is questionable as an environmental and sustainable fuel because of the ILUC. The objective for this thesis is to investigate the phase-out of crop-based biofuels with high ILUC risk by 2030 in EU, its impact on the palm oil market and 𝐶𝑂2 emissions. This is done by determining the palm oil market before REDII is implemented and then see how it will be affected by the phase-out. A quota will imitate the phase-out and is simulated in a partial equilibrium model. Is the effect of such policy really going to lower the 𝐶𝑂2 emissions caused by ILUC that EU strives for?
The main research question asked is:
How will the phase-out of crop-based biofuels with high ILUC risk effect the palm oil market and 𝐶𝑂2 emissions in Indonesia and Malaysia?
The partial equilibrium model will have four regions Indonesia, Malaysia, EU and rest of the world (ROW). Where Indonesia and Malaysia are exporters and EU and ROW are importers on the palm oil market. When the palm oil market is simulated with the quota, welfare effects can be derived. Calculations of change in world price, producer surplus, consumer surplus, terms of trade, quota rent and the world welfare effects can now be performed. The reduction of 𝐶𝑂2 emissions will be calculated through the change in supplied amount in Indonesia and
Malaysia.
The target group is policymakers in EU. It can also be used for other countries or organizations on the verge to apply new policies or legislations that have the same ambition to decrease the 𝐶𝑂2 emission caused by ILUC. Not only for palm oil, but for other agricultural commodities that has the same problem e.g. soybean.
The outline of this thesis is: Section 2 describes the gap that this thesis fills and a review of literature that is relevant and discuss similar problems. Section 3 gives a general overview of an import quota, so the reader to get a clear view of the policy used. Section 4 presents the method used for the analysis and how its implemented. Section 5 displays the results from the simulation and sensitivity analysis. Finally, section 6 discusses the results and literature used, also conclusions of findings and what can be done in further research is briefly considered.
6
2. Literature review
To find literature on policies used to limit biofuel imports is difficult, especially when it comes to biofuels being limited due to sustainable and environmental reasons. Trade is essential for the world economy, environmental aspects expressed in policies may be a natural development all over the world, as a measure to fight the current climate change. This is an angle that is important to analyze, trade could be a strong instrument if it is used in the right way. The ILUC as described in REDII is the beginning of a discussion, but definitely not the end. There seems to be many gaps to consider and many, not yet discovered, when it comes to including ILUC as a variable in polices that effect trade flows. The effects of such policies, the negative and positive outcomes, both domestic and international, is an area not widely researched. As well as the connection to 𝐶𝑂2 emissions actually being reduced from the policy. Maybe because the climate change has not been in the limelight as much as now and that the consequences of the deforestation is starting to show.
Oostererveer & Mol (2009) discuss in a review, the effects of the increasing demand for biofuels and its impact on trade and sustainability for developing countries. Even if it is written ten years ago it has a solid forecast surrounding the trade outlook for biofuels and for developing countries. This is linked to the environment and the difficulties it comes with. They emphasize the problem with the many different labeling of sustainable biofuel, and that the World Trade Organization (WTO) is absent when it comes to this area. Instead many non-governmental organizations (NGO) and a combination of NGOs and governments, have developed to handle this problem. This causes uncertainties for developing countries because they do not know right from wrong and what criteria to follow for what market.
Oostererveer & Mol conclude that the loss for the developing countries are going to be large, because they often do not have the resources to implement all the criteria for both sustainable labeling and directives like RED. The countries that are going to be affected need to be present to discuss how this is going play out, so they still can profit from the market.
In a research report, Erixon (2012) discusses the difficulties with the RED connected to biofuel and trade policies and environmental and sustainability issues. He, like Oosterveer & Mol, lift the negative effects on developing countries, and the fact that they could face problems with reaching all the goals set in RED. This is due to economic and technical reasons and that the entry to the EU market could be restricted to these countries or producers not able to reach the goals.
Erixon has an evident ambition to analyze the effects of policies like RED from an economic and trade aspect, and it supplies the reader with a thorough description of the biofuel market and its players. He emphasizes the upcoming problems if EU would introduce trade restrictions on biofuels, that it could generate conflicts in the areas of climate change and trade for the involved countries.
Erixon continues to investigate how and why RED is formulated. The main vegetable oil used for biofuels in EU is rapeseed, this is where EU have the motive to protect their market. EU is the largest consumer and producer of rapeseed in 2010/11 and vegetables oils like palm oil has an advantage with its low price and is a competitor to be aware of. There are claims, especially from countries who may be denied market access, that RED protects the domestic
7
producers. EU on the other hand claims that the same criteria are set for domestic and foreign producers and is not in favor for domestic producers. The outcome of this kind of restrictions is not going to affect the vegetable oil market a lot. That is because of the low share of imports that EU holds of vegetable oil with high LUC, for example palm oil. The low share of 15% palm oil imports, implies that the only thing that will occur is that the palm oil that used to be imported to EU is now imported to another country. The sustainable and environmental criteria in RED have no influence but only a shift in trade flows.
Erixon continues analyze the undesirable effects of a restriction of competitive vegetable oils on the EU market. This restriction will slow down the shift from fossil fuels to more sustainable alternatives. The outcome will be a higher price for biofuels in the EU also there is a maximum of how much biofuel that can be produced on domestic land. Furthermore, an increased subsidy cost for EU to farmers for them to be able to produce without loss. Erixon concludes that the weaknesses surrounding calculations of ILUC is challenging and it is close to impossible to create a rule that correctly represents the emissions from it. He also states that there is a way to unite the goals for a greener alterative to fossil fuel and standards of world trade, but for the cost of the environmental aspects in the directive.
There are many papers that have used the partial equilibrium model as their method to analyze outcomes on markets, but not many that is coupled with biofuel and 𝐶𝑂2 emissions. A recent paper by Saikkonen et al. (2014), uses a partial equilibrium model to look at the demand in EU for renewable diesel production, when greenhouse gases are considered. They also look at how the social welfare in Finland is affected by the biofuel policy set in EU. What they find is that the social welfare is affected by how the biofuel policy is designed and what kind of land the palm oil is cultivated on. The use of palm oil in biofuel for a more environmental fuel is only applicable if it does not originate from natural forests, otherwise the greenhouse gas emissions from palm oil production can exceed the fossil fuel emissions.
Saikkonen et al. state that for Finland to achieve the goals set in RED, the social welfare is going to be affected negatively when palm oil and rapeseed are used for biofuel. What causes this is both the high price of blended diesel and the high price of abatement, this effects the consumers and evidently the consumer surplus. With this result they conclude that it is important to consider the social welfare effects when biofuel policies are developed. In addition to that, to consider environmental and other impacts when designing a policy for biofuels is motivated.
Moschini et al. (2012) analyze polices and methods used to investigate the outcome of different biofuel policies economically. This is done on the big producers and users of biofuel: USA, Europe and Brazil. Models often used for this purpose is the computable general equilibrium and the partial equilibrium model.
There are many different simulations made with different combinations of policies, this is not relevant for this thesis. The conclusions about ILUC and its contradictions is more enlightening: how much it actually effects the greenhouse gases and if biofuels are an effective way to reduce emissions. They suggest that the policy often preferred and have the best response is a carbon tax, to make that possible the monetary value of the social cost of carbon will have to be established. Biofuel production is increasing, this distorts the food prices, but how much food prices increase seem to be some uncertainties about. However, the biofuel production is alleged to influence the food prices more than the energy prices. Similar to the other papers in
8
this literature review, Moschini et al. bring up the lack of a collective effort to have an international collaboration surrounding the sustainability and certification labeling. This can interfere with global trade. The conclusion to the many uncertainties about the aftermaths that biofuel trade and rising demands bring is, that to reduce 𝐶𝑂2 emissions, biofuel is best produced
where most efficient.
9
3. Trade theory
Import Quota large country and small country case
A quota will be used to imitate the phase-out of crop-based biofuels in EU. An import quota is often used to protect domestic production of similar or the same commodity (Koo & Kennedy 2005, pp. 113-119). When an import quota is introduced it can lead to inefficiencies in both consumption and resource use in the country that is protected by the quota. Also, the distortion of a quota is larger than tariffs, and this is a reason why quotas are not allowed according to the WTO.
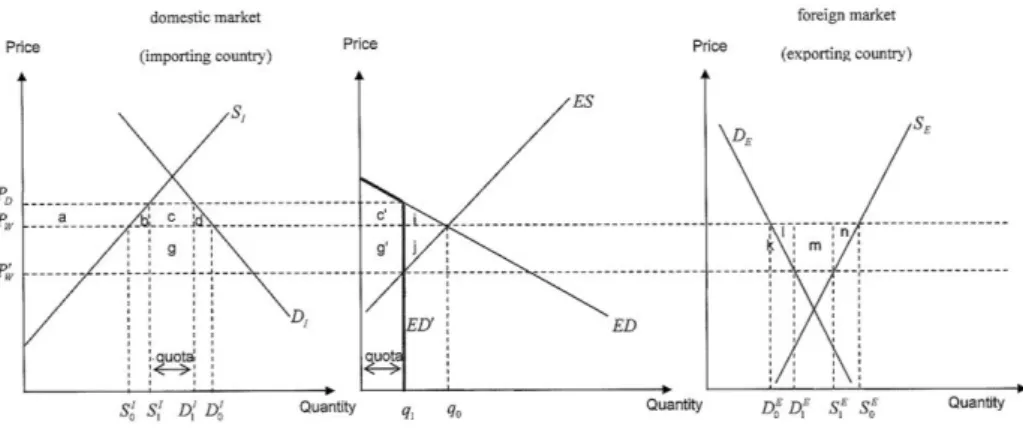
The general effect of an import quota for a large country is that it will increase the price in the country that has set the quota. It will do the opposite and decrease the price in the exporting countries (Koo & Kennedy 2005, pp. 113-119). This is shown in the Figure 3 below, where 𝑃𝐷 is the new higher domestic price and 𝑃′𝑊 is the new lower world price that the exporting country is faced with, after the quota is introduced.
Figure 3: Import quota (large country case)
Who are paying for the quota? Looking at Figure 3, we can see that the area marked 𝑐′ is paid
by the consumers in the importing country. The quota leads to a loss in the consumer surplus by the areas 𝑎 + 𝑏 + 𝑐 + 𝑑. The area marked 𝑔′ is paid by the producers in the exporting
country and a loss in the producer surplus with areas 𝑘 + 𝑙 + 𝑚 + 𝑛. The rent of the quota is the areas 𝑐′+ 𝑔′, they are equal to the areas 𝑐 + 𝑔. Who will get the rent depends, and will be discussed later in this thesis. The welfare loss are the areas 𝑖 + 𝑗 where 𝑖 is equal to 𝑏 + 𝑑 and 𝑗 is equal to 𝑙 + 𝑛. The terms of trade effects are area 𝑚 which equals the areas 𝑔 and 𝑔′, this
is the area that the exporting country lose after the imposed quota.
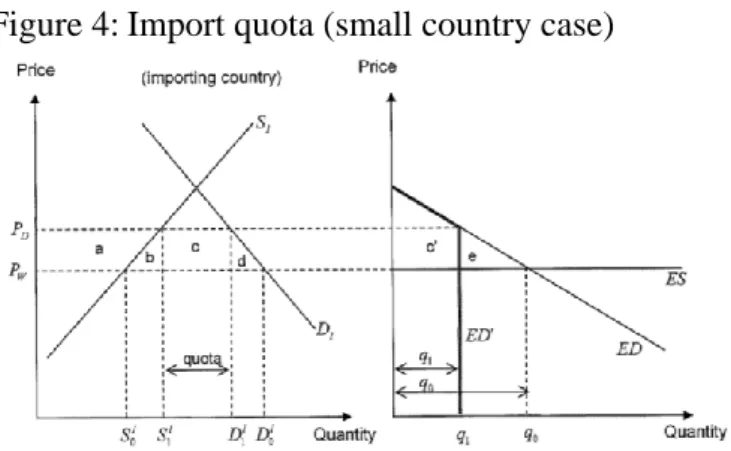
In the small country case, there are some differences from the large country case. The general outcome is presented in Figure 4.
10
Figure 4:Import quota (small country case)
A quota set by the importing country does not affect the world price, since they face a perfectly elastic export supply (ES) curve. It is assumed that the small country imports a little share on the world market, so they do not affect the world price and thus have a perfectly elastic ES curve (Koo & Kenndy 2005, pp. 114-116). Instead what happens is that the domestic price 𝑃𝐷 increases which causes the consumer to lose some of their surplus. Areas 𝑎 + 𝑏 + 𝑐 + 𝑑 are lost for the consumers and the producer gains 𝑎. Who are the ones paying for the quota in the small country case? It is the consumers that pays for the whole quota rent which is area 𝑐 = 𝑐′ and the warfare loss is areas 𝑏 + 𝑑 = 𝑒.
11
4. Method
4.1 Conceptual model
In a paper by Jafari et al. (2017), they use a partial equilibrium model to observe the impact on trade flows, prices and deforestation of reduced imports of palm oil to EU. This is the model also used in this thesis to analyze and answer the research question. A partial equilibrium model is a tool that is suitable for analyzing trade policies on agricultural market and see the welfare effects (Koo & Kennedy 2005, p. 79). The partial equilibrium is also a good instrument to see the effects of a policy on world prices and domestic supply and demand. This information is useful for policymakers, even though it is a simplified and basic picture of the trade equilibrium, it is convenient for making conclusions (Francois & Reinert 1997, p. 122). The framework for the method and model description is obtained from Francois & Reinert (1997) and Koo & Kennedy (2005).
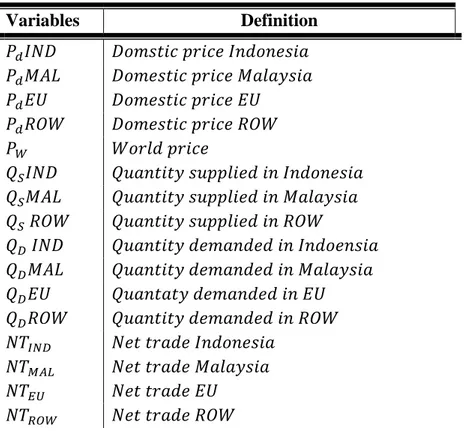
There are 16 endogenous variables required for this partial equilibrium, these are presented in Table 1:
Table 1: Variable definitions
Variables Definition 𝑃𝑑𝐼𝑁𝐷 𝐷𝑜𝑚𝑠𝑡𝑖𝑐 𝑝𝑟𝑖𝑐𝑒 𝐼𝑛𝑑𝑜𝑛𝑒𝑠𝑖𝑎 𝑃𝑑𝑀𝐴𝐿 𝐷𝑜𝑚𝑒𝑠𝑡𝑖𝑐 𝑝𝑟𝑖𝑐𝑒 𝑀𝑎𝑙𝑎𝑦𝑠𝑖𝑎 𝑃𝑑𝐸𝑈 𝐷𝑜𝑚𝑒𝑠𝑡𝑖𝑐 𝑝𝑟𝑖𝑐𝑒 𝐸𝑈 𝑃𝑑𝑅𝑂𝑊 𝐷𝑜𝑚𝑒𝑠𝑡𝑖𝑐 𝑝𝑟𝑖𝑐𝑒 𝑅𝑂𝑊 𝑃𝑊 𝑊𝑜𝑟𝑙𝑑 𝑝𝑟𝑖𝑐𝑒 𝑄𝑆𝐼𝑁𝐷 𝑄𝑢𝑎𝑛𝑡𝑖𝑡𝑦 𝑠𝑢𝑝𝑝𝑙𝑖𝑒𝑑 𝑖𝑛 𝐼𝑛𝑑𝑜𝑛𝑒𝑠𝑖𝑎 𝑄𝑆𝑀𝐴𝐿 𝑄𝑢𝑎𝑛𝑡𝑖𝑡𝑦 𝑠𝑢𝑝𝑝𝑙𝑖𝑒𝑑 𝑖𝑛 𝑀𝑎𝑙𝑎𝑦𝑠𝑖𝑎 𝑄𝑆 𝑅𝑂𝑊 𝑄𝑢𝑎𝑛𝑡𝑖𝑡𝑦 𝑠𝑢𝑝𝑝𝑙𝑖𝑒𝑑 𝑖𝑛 𝑅𝑂𝑊 𝑄𝐷 𝐼𝑁𝐷 𝑄𝑢𝑎𝑛𝑡𝑖𝑡𝑦 𝑑𝑒𝑚𝑎𝑛𝑑𝑒𝑑 𝑖𝑛 𝐼𝑛𝑑𝑜𝑒𝑛𝑠𝑖𝑎 𝑄𝐷𝑀𝐴𝐿 𝑄𝑢𝑎𝑛𝑡𝑖𝑡𝑦 𝑑𝑒𝑚𝑎𝑛𝑑𝑒𝑑 𝑖𝑛 𝑀𝑎𝑙𝑎𝑦𝑠𝑖𝑎 𝑄𝐷𝐸𝑈 𝑄𝑢𝑎𝑛𝑡𝑎𝑡𝑦 𝑑𝑒𝑚𝑎𝑛𝑑𝑒𝑑 𝑖𝑛 𝐸𝑈 𝑄𝐷𝑅𝑂𝑊 𝑄𝑢𝑎𝑛𝑡𝑖𝑡𝑦 𝑑𝑒𝑚𝑎𝑛𝑑𝑒𝑑 𝑖𝑛 𝑅𝑂𝑊 𝑁𝑇𝐼𝑁𝐷 𝑁𝑒𝑡 𝑡𝑟𝑎𝑑𝑒 𝐼𝑛𝑑𝑜𝑛𝑒𝑠𝑖𝑎 𝑁𝑇𝑀𝐴𝐿 𝑁𝑒𝑡 𝑡𝑟𝑎𝑑𝑒 𝑀𝑎𝑙𝑎𝑦𝑠𝑖𝑎 𝑁𝑇𝐸𝑈 𝑁𝑒𝑡 𝑡𝑟𝑎𝑑𝑒 𝐸𝑈 𝑁𝑇𝑅𝑂𝑊 𝑁𝑒𝑡 𝑡𝑟𝑎𝑑𝑒 𝑅𝑂𝑊
Further, the equations needed for the partial equilibrium model are:
𝑁𝑒𝑡 𝑡𝑟𝑎𝑑𝑒: 𝑁𝑇𝑖 = 𝑄𝑆𝑖− 𝑄𝐷𝑖 (1)
𝑀𝑎𝑟𝑘𝑒𝑡 𝐸𝑞𝑢𝑖𝑙𝑖𝑏𝑟𝑖𝑢𝑚: ∑𝑁𝑇𝑖 = 0 (2)
𝑆𝑢𝑝𝑝𝑙𝑦 𝑓𝑢𝑛𝑐𝑡𝑖𝑜𝑛: 𝑄𝑆𝑖= 𝑆𝑖+ 𝛽𝜀𝑆𝑖 ∗ 𝑃𝑑𝑖 (3)
12
𝑇𝑟𝑎𝑛𝑠𝑝𝑜𝑟𝑡 𝑐𝑜𝑠𝑡: 𝑇𝐶𝑖 = 𝑃𝑑𝑖− 𝑃𝑊 (5)
𝑃𝑟𝑖𝑐𝑒 𝑒𝑞𝑢𝑎𝑡𝑖𝑜𝑛: 𝑃𝐼𝑁𝐷𝑖 = 𝑃𝑊+ 𝑇𝐶𝑖 (6)
Where, 𝑖 = 1, 2, 3, 4 and 1 = 𝐼𝑛𝑑𝑜𝑛𝑒𝑠𝑖𝑎, 2 = 𝑀𝑎𝑙𝑎𝑦𝑠𝑖𝑎, 3 = 𝐸𝑈, 4 = 𝑅𝑂𝑊
There are limitations in the partial equilibrium model, the model only takes into account the relevant players on the market analyzed, everything else is left out (Francois & Reinert 1997, p. 231). Because of the timeframe and lack of knowledge, linear curves in the partial equilibrium model is assumed, though this may not be the real case.
4.2 Data
Trade flows and palm oil prices
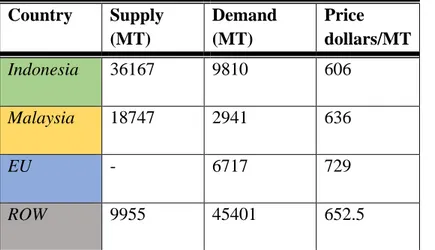
To create the partial equilibrium and simulate a quota in the model, data on trade flows, prices for palm oil and elasticities in Indonesia, Malaysia, EU and ROW have to be gathered. The palm oil crop year starts in October, so the trade flows are an average of three years between 2015/16-2017/18 and in metric ton (MT). Source of this information is USDA (2019). Prices where harder to find, for the numbers to be reliable, an average of two years are used between 2015-2016 of import and export quantity. The values are in dollars/ MT, this data was collected from FAO STAT (2018). The numbers on prices and supply and demand quantity are presented in Table 2.
Table 2: Data on average trade flows 2015/16-2017/18 and average price 2015-2016.
Country Supply (MT) Demand (MT) Price dollars/MT Indonesia 36167 9810 606 Malaysia 18747 2941 636 EU - 6717 729 ROW 9955 45401 652.5
Source: USDA (2019) and FAO STAT (2018)
Elasticities
The elasticities of supply and demand are originating from several scientific papers, that have in some way calculated or used the elasticities of palm oil. The same demand and supply elasticities are used for Malaysia and Indonesia because they are the largest net exporters and have similar prerequisites. The supply elasticity of Malaysia and Indonesia is retrieved from Abdullah (2011) and the demand elasticity from Gaskell (2015). In the case of ROW, the elasticities of India are used, because they are the largest importer and ROW is a net importer.
13
The supply elasticity that is used is taken from Kumar et al. (2010) and the demand elasticities from Pan (2008). EU dose not supply any palm oil, in that case, EU only need demand elasticity which is derived from a paper on Brazilian ethanol imports by Farinelli et al. (2009). Elasticity of demand for palm oil imports in EU was hard to find. The elasticity of demand for ethanol are used instead, because ethanol has the same area of use as the palm oil imported for biofuel. For all the values on elasticities see Table 3.
Table 3: Values on elasticities
Elasticity of supply = 𝜀𝑆
Indonesia Malaysia EU ROW
Base Values 0.41 0.41 - 0.51
Elasticity of demand = 𝜀𝐷
Base Values -0.5 -0.5 -0.21 -0.75
Source:Abdullah (2011), Gaskell (2015), Kumar et al. (2010), Pan (2008), Farinelli et al. (2009)
Sensitivity analysis
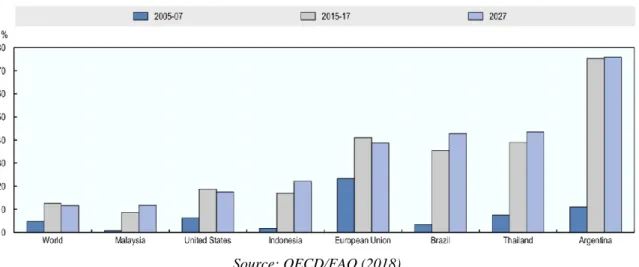
There are many different data of elasticities of supply and demand, the outcome could change if other data where used. A sensitivity analysis is therefore performed to get a stronger base for the analysis. The indicators for how much to change the elasticities with is based on a report from OECD/FAO (2018). The report shows predictions of ten years between 2018-2027, for the vegetable oil market. Concluding that the vegetable oil market will be saturated and therefore the growth will slow down compared to decades before. Same for vegetable oil in biofuel (see Figure 5), but in the case of biofuels the new policies and legislations connected to environment and sustainability also drives the growth down. A growth of only 3% is estimated for biofuel production in the whole world.
Figure 5: Share of vegetable oil used for biodiesel production
Source: OECD/FAO (2018)
Both in consumption and production vegetable oil will have a small expansion, small changes in the elasticities of supply of exporting countries are therefore simulated with an increase of 5%, 10% and 15%. Also, the oil palm is a perennial plant which makes the short
14
run very long, the produced amount is quite fixed and do not fluctuate as much. The 15% increase in elasticity is less likely but can still give an interesting perspective. These changes are put on Indonesia because of their big share of exports. For the demand side the changes in elasticities are small and the same percentage change are used. The changes are put on ROW and EU, because they are the largest consumers. The intercept of the supply and demand curves will not be changed, so a rotation will occur and that is something to have in mind. The calculated elasticities for the sensitivity analysis can be observed in Appendix E.
Quota
The size of the quota that will be introduced and simulated, is the amount of palm oil that EU imports to use for biofuel. According to Transport and Environment (2018), 51% of all palm oil imported to the EU was used for fuel in 2017. The equation of the quota size and what the 51% is equivalent to is presented below:
𝑄𝑢𝑜𝑡𝑎 𝑠𝑖𝑧𝑒 = 𝑅𝑒𝑠𝑡𝑟𝑖𝑐𝑡𝑖𝑜𝑛 𝑖𝑛 % ∗ 𝑄𝐷𝐸𝑈 (7)
0.51 ∗ 6717 = 3425.67 𝑀𝑇 𝑝𝑙𝑎𝑚 𝑜𝑖𝑙 𝐶𝑂2 emissions
In this thesis only 𝐶𝑂2 emissions are analyzed, other externalities will not be included, this is because the biofuel industry has a goal to reduce greenhouse gas emissions.
To analyze the effect of the quota on carbon emissions, how much carbon is emitted per hectare palm oil planted need to be derived. Data needed for the calculations originates from IPCC (2016), where they have looked at the change from tropical peatlands to palm oil plantation where the original land use could be forests. There are different estimations of the carbon emissions per hectare and year, therefore an average of four values are going to be used.
13.8 + 18.09272 + 22.33736 + 26.58199
4 ≈ 20.20302 𝑀𝑇 𝐶𝑂2⁄𝐻𝑒𝑐𝑡𝑎𝑟𝑒/𝑌𝑒𝑎𝑟
How much palm oil is produced per hectare? According to Erixon (2012), the oil palm yields in Indonesia and Malaysia an amount between 3.1-5 MT oil per hectare/year. The amounts that will be used to estimate the reduction of 𝐶𝑂2 emission through the quota are three values an
upper, lower and an average value. The values are presented in Appendix E.
How much 𝐶𝑂2 emission is reduced depends on the land that the palm oil plantations are
planted on. It is therefore assumed in this thesis that the palm oil originates from LUC or ILUC, of natural rainforests which have high carbon stocks.
Ahlgren & Di Luca (2014) have gathered studies that have attempted to model how much greenhouse gas emission ILUC is caused by biodiesel and other biofuel production. What they find is that there are large variations in the different studies and what they estimate. The reason seems to be various assumptions that differ, for example the development of oil and food prices. Also, that different models are used which causes the results to have a wide spread. That is why, the results from the calculations on reduction of 𝐶𝑂2 emissions in this thesis are limited and
15
4.3 Model Implementation
The equations and variables from section 4.1 and data from section 4.2 is now used to implement the model. The first thing that need to be derived is the net trade, who is net exporter and net importer? If the amount will be negative the country is a net importer and the other way around for net exporter (Koo & Kennedy 2005, pp. 80-83). It is important that the market equilibrium of the net trade equals to zero (see equation 2), what is exported on the market must also be imported on the market.
The data that was collected can be used to get the values of (intercept) and the (coefficient) for the supply and demand functions:
𝛽𝑆𝑖 (𝑐𝑜𝑓𝑓𝑖𝑐𝑖𝑒𝑛𝑡) 𝑜𝑓 𝑡ℎ𝑒 𝑠𝑢𝑝𝑝𝑙𝑦 𝑓𝑢𝑛𝑐𝑡𝑖𝑜𝑛 = 𝜀𝑆𝑖 ∗ 𝑄𝑆𝑖⁄𝑃𝑑𝑖 (8) 𝛽𝐷𝑖 (𝑐𝑜𝑓𝑓𝑖𝑐𝑖𝑒𝑛𝑡) 𝑜𝑓 𝑡ℎ𝑒 𝑑𝑒𝑚𝑎𝑛𝑑 𝑓𝑢𝑛𝑐𝑡𝑖𝑜𝑛 = 𝜀𝐷𝑖 ∗ 𝑄𝐷𝑖 /𝑃𝑑𝑖 (9)
The 𝛽 - values can now be used to establish the :
𝛼𝑆𝑖(𝑖𝑛𝑡𝑒𝑟𝑐𝑒𝑝𝑡 )𝑜𝑓 𝑡ℎ𝑒 𝑠𝑢𝑝𝑝𝑙𝑦 𝑓𝑢𝑛𝑐𝑡𝑖𝑜𝑛: 𝑄𝑆𝑖− 𝛽𝑆𝑖⁄𝑃𝑑𝑖 (10)
𝛼𝐷𝑖 (𝑖𝑛𝑡𝑒𝑟𝑐𝑒𝑝𝑡) 𝑜𝑓 𝑡ℎ𝑒 𝑑𝑒𝑚𝑎𝑛𝑑 𝑓𝑢𝑛𝑐𝑡𝑖𝑜𝑛: 𝑄𝐷𝑖− 𝛽𝐷𝑖⁄𝑃𝑑𝑖 (11)
All the variables in the supply and demand functions are now constructed and can be used in the simulation. The world price (𝑃𝑊) in the partial equilibrium is assumed to be the same as the domestic price of Indonesia (𝑃𝐼𝑁𝐷), because they are the largest exporters on the market and
can set the price. The price equations are also required to run the model and are derived according to equation 5 and 6.
The equation and size of the quota can be found in section 4.2 equation 7, and it is introduced by the amount restricted in percent times the amount imported to the EU.
The time has come to simulate the model with the quota to see the outcome on the market, such as supply and demand changes, welfare effects, increase or decrease in world prices.
To determine the effects on the market certain calculations have to be conducted. Naturally, the next step after the simulation, is to calculate the producer surplus and consumer surplus in every country. Through this, welfare effects can be analyzed after the quota is introduced. The function used to calculate and derive the producer surplus and consumer surplus in the partial equilibrium model is expressed as followed:
𝑃𝑟𝑜𝑑𝑢𝑐𝑒𝑟 𝑠𝑢𝑟𝑝𝑙𝑢𝑠: (𝛼𝑆𝑖+ 𝑄𝑆𝑖) ∗ 𝑃𝑑𝑖∗ 0.5 (12)
𝐶𝑜𝑛𝑠𝑢𝑚𝑒𝑟 𝑠𝑢𝑟𝑝𝑙𝑢𝑠: (−𝛼𝐷𝑖/𝛽𝐷𝑖− 𝑃𝑑𝑖) ∗ 𝑄𝐷𝑖∗ 0.5 (13)
The quota rent can be calculated through the function:
16
Where 𝑃′𝑑𝐸𝑈 is the new domestic price in EU and 𝑃′𝑊 is the new world price that Indonesia, Malaysia and ROW is faced with. The equation used for establishing the terms of trade is:
𝑇𝑒𝑟𝑚𝑠 𝑜𝑓 𝑡𝑟𝑎𝑑𝑒 = ∆𝑃𝑊∗ (𝑄𝑢𝑜𝑡𝑎) (15)
Where, ∆𝑃𝑊 is the change in world price and its multiplied by the size of the introduced quota. This is calculated for the exporting countries: Indonesia and Malaysia.
To answer the question how the quota will affect the 𝐶𝑂2 emissions, the changes in the supply of palm oil in Indonesia and Malaysia are used. The reduced amount of produced palm oil in MT can be transformed in to how much 𝐶𝑂2 emission will be reduced.
𝐶𝑂2 𝑟𝑒𝑑𝑢𝑐𝑡𝑖𝑜𝑛 = ∆𝑄𝑆𝐼𝑁𝐷 ∗ 𝑀𝑇 𝐶𝑂2𝑒𝑚𝑖𝑠𝑠𝑖𝑜𝑛 𝑀𝑇 𝑝𝑎𝑙𝑚 𝑜𝑖𝑙⁄ (16)
17
5. Results
The results from the simulation will be presented in Table 4, changes in producer surplus and consumer surplus and world price, the value of the quota rent, terms of trade and world welfare effect is displayed in Table 5-7. The reduction of 𝐶𝑂2 emission from the implemented quota is
shown in Table 8.
The partial equilibrium model can be found in Appendix A, the calculations for welfare effects, changes in producer surplus and consumer surplus, quota rent, terms of trade and 𝐶𝑂2 reduction, can be found in Appendix B. The sensitivity report is found in Appendix C, selected results of interest are presented in Table 9. The welfare effects from the sensitivity analysis is presented in Appendix D.
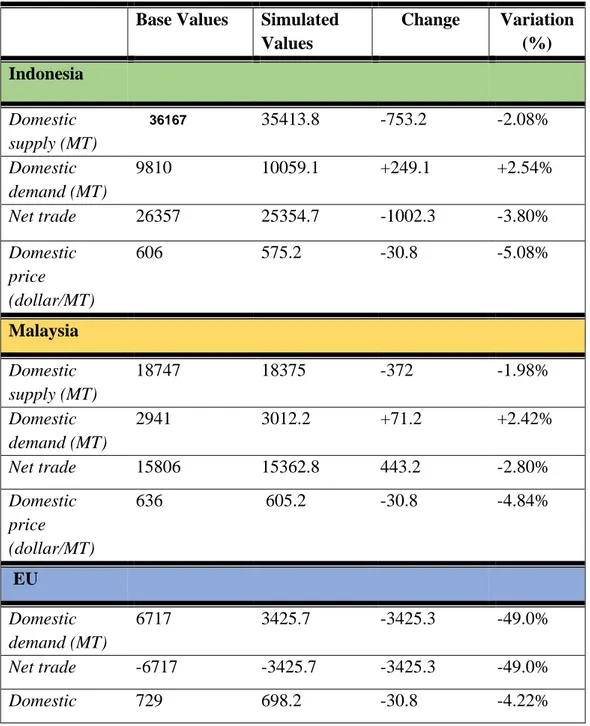
Table 4: Results in trade flows and domestic prices for all regions.
Base Values Simulated
Values Change Variation (%) Indonesia Domestic supply (MT) 36167 35413.8 -753.2 -2.08% Domestic demand (MT) 9810 10059.1 +249.1 +2.54% Net trade 26357 25354.7 -1002.3 -3.80% Domestic price (dollar/MT) 606 575.2 -30.8 -5.08% Malaysia Domestic supply (MT) 18747 18375 -372 -1.98% Domestic demand (MT) 2941 3012.2 +71.2 +2.42% Net trade 15806 15362.8 443.2 -2.80% Domestic price (dollar/MT) 636 605.2 -30.8 -4.84% EU Domestic demand (MT) 6717 3425.7 -3425.3 -49.0% Net trade -6717 -3425.7 -3425.3 -49.0% Domestic 729 698.2 -30.8 -4.22%
18 price (dollar/MT) ROW Domestic supply (MT) 9955 9715.5 -239.5 -2.41% Domestic demand (MT) 45401 47007.3 +1606.3 +3.54% Net trade -35446 -37291.8 +1845.8 +5.21% Domestic price (dollar/MT) 652.5 621.7 -30.8 -4.72%
Source: Own calculations
Table 5: Results of changes in producer and consumer surplus and world price for all regions.
Base Values Simulated Values Change Variation (%) Indonesia Producer surplus(dollars) 17 424175.6 16 322 506.8 -1 101 668.8 -6.32% Consumer surplus(dollars) 5 944 860 6 250 657.3 +305 797.3 +5.14% Malaysia Producer surplus(dollars) 9 478 858.1 8 907 529.7 -571 328.4 -6.03% Consumer surplus(dollars) 1 870 476 1 962 098.6 +91622.6 +4.90% EU Consumer surplus(dollars) 11 658 792.9 5 998 707.3 -5 660 085.5 -48.55% ROW Producer surplus(dollars) 4 839 249.9 4 536 510 -302740 -6.26% Consumer surplus(dollars) 19 749 435 21 171 650.9 +1 422 215.9 +7.20% World price (dollars) 606 575.2 -30.8 -5.08%
19
The results in Table 4 and 5 show that the world price decreases with 5.08% due to the implementation of the quota in EU. Indonesia and Malaysia lower their supply to the world market with around 2%. The net trade drop more in Indonesia (-3.8%) compared to Malaysia (-2.8%). The domestic prices in Indonesia and Malaysia have a similar reduction as the world price with about 5%. Producers in exporting countries loose surplus with approximately 6% and consumers gain around 5%.
EU, who set the quota, have a fall in domestic price with 4.22%, the net trade and the domestic demand fall with 49%. This is the largest change in all regions and can be traced to the import quota simulated on the EU market. Also, the consumers have a loss of 48.55% in their surplus due to the quota introduced.
ROW impact of the quota is similar to Indonesia and Malaysia, what differs is a larger increase in domestic demand with 5.21% because of the lower world price. This also mirrors the gain of 7.2% in consumer surplus, greater improvement than other regions.
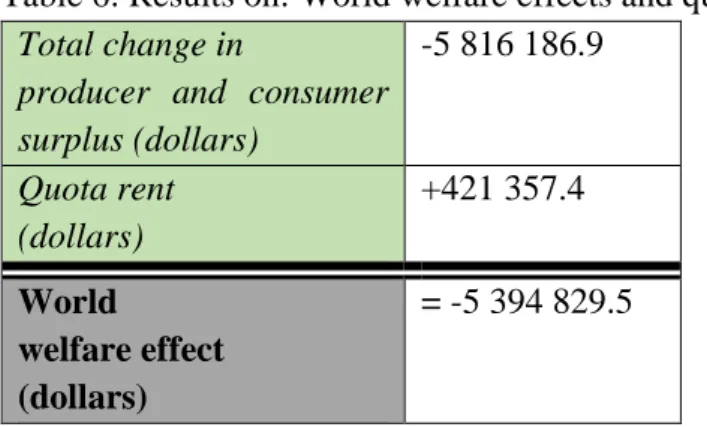
Table 6: Results on: World welfare effects and quota rent
Total change in
producer and consumer surplus (dollars) -5 816 186.9 Quota rent (dollars) +421 357.4 World welfare effect (dollars) = -5 394 829.5
Source: Own calculations
Table 7: Terms of trade (Indonesia and Malaysia)
Terms of trade (dollars)
210 891.9
Source: Own calculations
In Table 6 the world welfare effect is calculated and there is an overall negative effect of 5 394 829.5 dollars in the palm oil market. The quota rent has a value of 421 357.4 dollars that could be distributed. The terms of trade are what Indonesia and Malaysia lose when they, as exporters on the palm oil market, are faced with a lower world price (see Table 7).
20
Table 8: Total reduction of 𝐶𝑂2 emissions in Indonesia and Malaysia together. 𝑪𝑶𝟐 𝒆𝒎𝒊𝒔𝒔𝒊𝒐𝒏𝒔 Base Values 𝑪𝑶𝟐 𝒆𝒎𝒔𝒔𝒊𝒐𝒏𝒔 Simulated Values Reduction MT 𝑪𝑶𝟐𝒆𝒎𝒊𝒔𝒔𝒊𝒐𝒏𝒔 Variation (%) Lower yield/ha (6.52) 358 039.3 350 703 - 7336.3 -2.05% Average yield/ha (4.99) 274 020.9 268 406.1 -5614.7 -2.05% Upper yield/ha (4.04) 221 852.6 217 306.8 -4545.8 -2.05%
Source: Own calculations
As presented in Table 4 the supply goes down, the change in supplied amount is calculated as reduced 𝐶𝑂2 emission. A reduction of 4545.79-7336.28 MT 𝐶𝑂2 emission is estimated dependent on yield/ha.
Table 9: Results from the sensitivity analysis for Indonesia.
Indonesia Base Values
𝜺𝑺= 𝟎. 𝟒𝟏 5% 𝜺𝑺= 𝟎. 𝟒𝟑𝟎𝟓 10% 𝜺𝑺= 𝟎. 𝟓𝟏 15% 𝜺𝑺= 𝟎. 𝟒𝟕𝟏𝟓 Domestic supply (MT) 35 413.8 35 950.4 36 475 36 987.9 Variation in supply (%) -2.08% -0.60% +0.85% +2.27% Domestic demand (MT) 10059.1 10 111.8 10 163.3 10 213.7 Variation in demand (%) +2.54% +3.08% +3.60% +4.11% Net trade 25354.7 25 838.6 26 311.6 26 774.3 Variation in net trade (%) -3.80% -1.97% -0.17% +1.58% Domestic price (dollar/MT) 575.2 568.7 562.4 556.1 Variation domestic price (%) -5.08% -6.50% -7.20% -8.23% Change in producer and consumer surplus -5 816 186.9 -5 627 213.5 -5 442 467.9 -5 261 809.7
21 Variation in producer and consumer surplus (%) -8.20% -7.93% -7.67% -7.43% World welfare effects -5 394 829.5 -5 205 856.1 - 5 021 110.5 -4 840 452.3 Terms of trade 210 891.9 255 475.5 299 061.6 341 683.3 Quota rent 421 357.4 421 357.4 421 357.4 421 357.4
Source: Own calculations
The results of the sensitivity analysis show that: for all elasticities used in the analysis the domestic price goes down. As the elasticity of supply gets more elastic, the domestic price goes lower for these specific values used. Therefore, the demand in Indonesia goes up, an increase of approximately 3-4%. When the elasticity of supply is changed with 10% and 15%, the supplied amount does not go down, it increases with 0,85% and 2.27%. The world welfare effect decreases for all values, same with the impact on producer surplus and consumer surplus. The terms of trade increases at all levels.
22
6. Discussion
The effect on the palm oil market
The effect on the world price is a 5% reduction from 606 dollar/MT palm oil to about 575 dollar/ MT palm oil. The consumers in Indonesia, Malaysia and ROW are the ones who gain from this. The consumer surplus in these countries increase with 5-7%, where the consumers in ROW benefits the most with an increase of 7.2%. All regions besides EU have an increase in domestic demand with about 2.5-3.5%. That is what Erixon (2012) predicted, the restriction in REDII where not actually going to reduce the production of palm oil. On the contrary, the palm oil not imported by the EU will now be demanded in other countries that benefits form the lower price, there are only a shift from one region to another.
The producer surplus decreases with around 6% in all countries besides EU (who does not produce any palm oil). This is an effect of the lower price they have to sell the palm oil for, the supply in Indonesia falls with 2.1% and that equals 753.2 MT palm oil. When a country like Indonesia produces 56% palm oil to the market, a fall by 2.1% is not going to affect the production a lot. Therefore, in this case, the pace of deforestation for new palm oil plantations will not slow down significantly.
The results show a small distortion on the palm oil market by the import quota. This is mainly because EU holds a moderate share of the world imports of palm oil (15%). These changes are looking more like a small country case where, the ES curve is assumed to perfectly elastic hence the importer cannot affect the world price (see Figure 4) (Francois & Reinert 1997, p. 236). In both the large country case and the small country case a higher price on the domestic market, will be the outcome of implementing a quota. Consequently, the quota is mostly payed by the consumers in the importing country. In this case, EU consumers that have a loss in consumer surplus with 48.55% (Koo & Kennedy 2005, pp. 114-116).
The overall welfare effect is negative, a loss of 5 394 829.5 dollars that is caused by the introduction of the import quota, this is a loss that could benefit trade and economic growth in the world, especially for developing countries. This brings us to the terms of trade effects, the exporting countries have to pay a part of the quota rent, this is a loss of 210 891.94 dollars. The deterioration in their terms of trade, effects countries negatively because of the lower export price (Koo & Kennedy 2005). How much this will affect developing countries like Indonesia and Malaysia is past the scope of this thesis.
Quota rent
As said before, the quota rent in this case, is paid partly by the consumers in EU and partly by producers in Indonesia and Malaysia. The question is who is going to benefit and get the quota rent? There could be less of an impact depending on how EU decides to use the quota rent. The quota rent could be distributed to the producers in Indonesia and Malaysia or their governments. There are no rules to how the quota rent should be distributed, and it is not stated in the REDII either how this will be handled. There are different ways that have been used through the years, for example quota rents can be auctioned or given to the exporting country on the basis of “first come first serve” (Kerr & Gaisford 2007, pp. 267-274). In this case the quota rent could actually be allocated to the producers in Indonesia and Malaysia that have proof of sustainable produced
23
palm oil. So, when the market demands palm oil for a lower price, they can continue to produce sustainable palm oil and be able to compete on the same market.
The quota rent could also go to an NGO that strives to have a certification for sustainable palm oil. One of the movements in this area is certifications called Roundtable on Sustainable Palm Oil (RSPO), which is a commitment that 15 countries support, and some large companies have committed to the terms (RSPO 2019). The commitment contains 8 principals that the countries and companies should follow or attain. One of them are not to import palm oil that have been produced on land that has been converted from primary forest to palm oil plants or forest land that have been set on fire to make way for palm oil plantations. The certification is given to producers that can prove that the palm oil exported is produced in a sustainable matter.
Several of the papers reviewed for this analysis has brought up the uncertainties and absence of policies and strategies that pushes for sustainable production. Tan et al. (2009) see the palm oil as important source to provide the world with vegetable oil and that it could be a good replacement for fossil fuel with the right management, policies and strategies to support its sustainability. The quota rent could be a good investment to still be able to consume palm oil but not affect the environment as much as it does today. For developing countries to still be able to flourish economically and not have a set back from policies introduced in developed countries.
Another example to where the rent could go is to Research and Development, to improve and develop sustainable, environmental and more local produced fuel. There are attempts to make “waste edible oil” (WEO) and algae into biofuel. The WEO seems to be a very cost-efficient solution since it can be used two times and it can solve the problem with waste management (Gui et al. 2008). The algae have many positive features: it does not need fertile land; it can grow almost anywhere and the production of algae is less energy craving than the energy that it provides (Demirbas & Demirbas 2011). These examples could have a place at the biofuel market in the future with a little help.
WTO and RED
Quotas are no longer a policy approved by the WTO, as earlier said. The measures to decrease the LUC and ILUC in RED and REDII can be interpreted as a policy to protect the domestic market (Erixon 2012). So why is that? The problem is that the rapeseed has difficulties to compete on the international market because of its high price, the subsides EU has set on rapeseed has helped it stay on the market. In the WTO rules, it says that you are not allowed to discriminate between domestic and foreign products that are similar. Erixon (2012) states in his report that the RED sustainability criteria will discriminate between similar products and it will also have a “disguised restriction on international trade”, which is not allowed by the WTO either. The discrimination between similar products is based on that rapeseed and palm oil have the same physical characteristics, tariff classification and end use of biofuels. The disguised restriction is based on for example, the LUC criteria, which has almost no affect in EU.
There are possibilities to restrict imports because environmental issues that have been approved by the WTO (DeSombre & Barkin 2002). It is still more of a rarity than a rule, mostly because many of the legislations are badly designed or coverups for protecting domestic production, as discussed above. The ILUC impact is hard to establish and could be hard for EU to defend the phase-out to the WTO (Ahlgren & Di Luca 2014).
24
There are more that can be considered and analyzed about this subject, but the point to be made is: that some of the criteria in RED and REDII may not pass the WTO rules and therefore should be formulated on a different matter.
𝐶𝑂2 emissions
The effect of the phase-out of crop-based biofuel on 𝐶𝑂2emissions is hard to establish, the insecurities about how to calculate the ILUC seems to be the big problem (Ahlgren & Di Luca 2014). The initial simulation shows that lower production occurs after the quota is introduced, this can be assumed as less forest to be logged due to decreased demand in EU for palm oil (Jafari et al. 2017). The results show that a 2,05% reduction of 𝐶𝑂2 emission, and if the yield is low, more 𝐶𝑂2emission will be reduced. What can be said is the higher the yield/hectare the lower 𝐶𝑂2 emission. Moschini et al. (2012) conclude that the best way is that the palm oil is produced is where its most efficient, for palm oil that is in Malaysia and Indonesia. The results are very insecure and to be interpreted with caution.
Sensitivity analysis
The sensitivity analysis displays small changes in the demand when the elasticities of demand in ROW and EU are changed. What can be observed is that if the elasticity of demand is more elastic in ROW the impact on world welfare and terms of trade are less destructive. When the elasticity of supply in Indonesia is changed with 10% and 15%, the supplied amount increases by 0,85% and 2,27%. This is an outcome of the 7-8% lower domestic price that offsets the impact of the quota. This implies that at these levels the production has to intensify, inference of that is: 𝐶𝑂2 emissions may increase.
6.1. Conclusion
The conclusion of this thesis is that the REDII and its phase-out of crop-based biofuels with high ILUC risk, may not have the impact on land being converted from biodiverse forest to plantations, as set out to do. The calculations and methods used for establishing the reduction of 𝐶𝑂2 emissions vary too much to have a stable result. What can be interpreted is that it has a negative impact on world trade and economic growth, because the terms of trade are damaging for developing countries and the world welfare effect is negative. What Jafari et al. (2017) concluded is that one way this could be solved is for Indonesia and Malaysia to agree to a joint solution set by all regions/producers involved. For the palm oil to continue to be offered to the market and not loose from policies that have sustainable and environmental criteria.
There are many uncertainties in this work that could be further examined, that is unfortunately passed the scope of this thesis. For example, there are other policies that could have been evaluated instead of a quota. A policy that perhaps have a better effect on the reduction of 𝐶𝑂2 emissions and does not distort the market as much. Moschini et al. (2012) proposes that a carbon tax could be introduced on palm oil, since the LUC and ILUC effect the climate due to the emitted carbon when deforestations occurs. Furthermore, an improvement of this analysis could have been done through adding more markets to the partial equilibrium. For example, adding large players on the biofuel market like USA and Brazil could give a better
25
and more complete picture. What would have been interesting to see is the substitution effect of the quota. One optional outcome could be that the consumers shift back to fossil fuels again and the 𝐶𝑂2 emissions will not decrease; they will keep remaining on the same level or increase. The question EU policymakers needs to ask is: What is more important? The allocation from fossil fuel to biofuels or the footprint on the environment that is caused by the shift? Is it possible to get both a shift without any major imprint on the environment? There is a long way until sustainability and economic growth can be combined and at the same time have as little impact on the environment.
26
References
Abdullah, A. (2011). Determinants of Indonesian Palm oil Export: Price and Income Elasticity Estimation. Trends in Agricultural economics, Volume 4, pp. 50-57. DOI: 10.3923/tae.2011.50.57
Ahlgren, S., Di Luca, L. (2014). Indirect land use changes of biofuel production – a review of modelling efforts and policy developments in the European union. Biotechnology for Biofuels, March, Volume 7. Available:
https://biotechnologyforbiofuels.biomedcentral.com/articles/10.1186/1754-6834-7-35 [2019-05-18]
Corely, R.H.V., Tinker, P.B.H. (2016). The Oil Palm. 5th edition. Chichester, England: Wiley
Balckwell.
Demirbas, A., Demirbas, F.M. (2011). Importance of algae oil as source of biodiesel. Energy
Conversion and Management, January, Volume 52, pp. 163-170.
DeSombre, R. E., Barkin, J.S. (2002). Turtles and Trade: The WTO’s Acceptance of
Environmental Trade Restrictions. Global Environmental Politics, February, Volume 2, pp. 12-18.
Erixon, F. (2012). The rinsing trend of green protectionism: Biofuels and European Union.
ECIPE Occasional paper, Volume 2, European Center for International Political Economy
(ECIPE), Brussels
EUR- Lex. (2009). Directive 2009/28/EC of the European Parliament and of the Council of
23 April 2009 on the promotion of the use of energy from renewable sources and amending and subsequently repealing Directives 2001/77/EC and 2003/30/EC. Available: https://eur-lex.europa.eu/eli/dir/2009/28/oj [2019-04-22]
EUR- Lex. (2018). Directive (EU) 2018/2001 of the European Parliament and of the Council
of 11 December 2018 on the promotion of the use of energy from renewable sources.
Available:
https://eur-lex.europa.eu/legal-content/EN/TXT/?uri=uriserv:OJ.L_.2018.328.01.0082.01.ENG&toc=OJ:L:2018:328:TOC
[2019-04-24]
European commission. (2019). Report from the commission to the European parliament, the
council, the European economic and social committee and the committee of the regions. On the status of production expansion of relevant food and feed crops worldwide. Brussels: COM
(2019)142 final.