NATIONAL FOOD AGENCY, Sweden
�
LIVSMEDELS
VERKET
Rapport 12 - 2012Proficiency Testing
Drinking Water Microbiology
2012:1, March
by Tommy Šlapokas, Malin Lindqvist and Kirsi Mykkänen
36 ↓ 0 4 8 12 16 20 0 15 30 45 60 75 90 105 120 135 150 Escherichia coli (M F) No. of results
No. of colonies per 100 m l
Proficiency Testing
Drinking Water
Microbiology
2012:1, March
Tommy Šlapokas1Malin Lindqvist2
Kirsi Mykkänen2
1 Compilation and writing 2 Laboratory work
2nd edition
Microbiology Division National Food Agency
Box 622
SE-751 26 UPPSALA SWEDEN Uppsala 2012
Edition
Version 2 (10 December 2012)
Editor in chief
Annika Rimland, Head of the Science Department, National Food Agency
Responsible for the scheme
Contents
Introduction ... 5
Design ... 5
- Analyses and mixtures ... 5
- Quality control of the mixtures ... 7
Laboratory results ... 8
- General information regarding the results ... 8
- Outcome of the mixtures ... 9
Mixture A ... 9
Mixture B ... 16
Mixture C ... 21
Outcome of the methods ... 26
- Method information by use of internet ... 26
- General information regarding methods outcome ... 26
- Coliform bacteria and E. coli with membrane filtration methods (MF) ... 26
Alternative methods ... 26
Results ... 28
- Clostridium perfringens with membrane filtration methods (MF) ... 31
Various methods ... 31
Results ... 31
- Moulds and yeasts in water (MF) ... 33
Various methods ... 33
Results ... 33
The outcome of deviating results – assessment ... 36
Figure 2 — Box plot ... 38
References ... 41
Annex A — all analytical results ... 42
Annex B— z-values to use in the follow-up process ... 46
Livsmedelsverket, report no. 12/2012 5
Introduction
All analytical activities require the execution of work of a high standard that is accurately documented. For this purpose most laboratories carry out some form of internal quality assurance, but their analytical work also has to be evaluated by an independent party. Such external quality control of laboratory competence is
commonly required by accreditation bodies and can be done by taking part in
proficiency testing (PT).
In a proficiency test, identical test material is examined by a number of laboratories. The laboratories must follow instructions, perform analyses on the samples provided and report their results to the organiser. They are also expected to use their routine methods for their analyses. The organiser subsequently evaluates the results using statistical tools and finally compiles them in a report.
Benefits of the National Food Agency’s proficiency tests
1. Laboratories are externally evaluated with respect to their analytical competence, including usage of methods, documentation and orderliness.
2. Accreditation bodies are provided with a tool for inspections regarding new accreditation or maintenance of accreditation.
3. Laboratories and the organiser improve their knowledge of the efficiency of analytical methods used routinely by participating laboratories with respect to various types of organisms.
Design
Analyses and mixtures
This proficiency test was performed in March 2012, and is registered as no. 610/2012 at the National Food Agency, Uppsala.
Samples were sent to 99 laboratories 33 of which were in Sweden, 59 in other Nordic countries and 7 in other countries. One laboratory did not report results.
Assessed parameters
Coliform bacteria and Escherichia coli with membrane filtration method (MF) Coliform bacteria and Escherichia coli with rapid kit methods using most probable numbers (MPN)
Presumptive Clostridium perfringens with MF, colonies before confirmation
Clostridium perfringens with MF
Microfungi (yeasts and moulds) with MF
Culturable microorganisms (total count) after incubation for 3 days at 22±2 °C
Not assessed parameters
For the analyses using membrane filtration, the number of suspected colonies obtained on the initial culture plates could be reported by the participants, i.e. before the confirmation steps. However, these results are not included in the
calculation of deviant results but are used as information for interpretation and discussion of analyses outcomes.
The proficiency test comprised three simulated water samples. Each laboratory was assigned to perform the analyses according to its methods routinely used on drinking water samples. The test material is first and foremost adjusted to the EN ISO methods for analyses of drinking water, stated in the drinking water directive of the European Union (1). Accepted alternative methods in EU are also possible to use, as well as other similar methods.
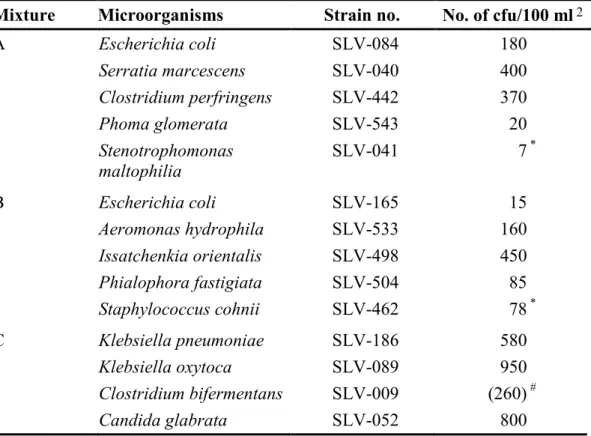
Three freeze-dried test materials were produced with different microorganism mixtures. The material was manufactured and freeze-dried in portions of 0.5 ml in small vials, according to the description by Peterz and Steneryd (2). Each
Table 1 Microbial mixtures 1
Mixture Microorganisms Strain no. No. of cfu/100 ml2
A Escherichia coli SLV-084 180 Serratia marcescens SLV-040 400 Clostridium perfringens SLV-442 370 Phoma glomerata SLV-543 20 Stenotrophomonas maltophilia SLV-041 7 * B Escherichia coli SLV-165 15 Aeromonas hydrophila SLV-533 160 Issatchenkia orientalis SLV-498 450 Phialophora fastigiata SLV-504 85 Staphylococcus cohnii SLV-462 78 * C Klebsiella pneumoniae SLV-186 580 Klebsiella oxytoca SLV-089 950 Clostridium bifermentans SLV-009 (260) # Candida glabrata SLV-052 800
1 The links between the mixtures and the randomised sample numbers are shown in Annex A
2 Results based on duplicate analyses of 10 vials per mixture, performed at the National Food
Agency (Table 2); m-Endo Agar LES was used for E. coli, K. pneumoniae, K. oxytoca, S.
marcescens and A. hydrophila; TSC Agar for C. perfringens and C. bifermentans; RBCC Agar
for Ph. glomerata, I. orientalis, Ph. fastigiata and C. glabrata; YeA for S. maltophilia and S.
cohnii – cfu = colony forming units
* cfu per ml
Livsmedelsverket, report no. 12/2012 7
laboratory received one vial of each mixture. The simulated water samples were prepared by dissolving the content of the vials in 800 ml of sterile diluent. The composition of each mixture is listed in Table 1.
Quality control of the mixtures
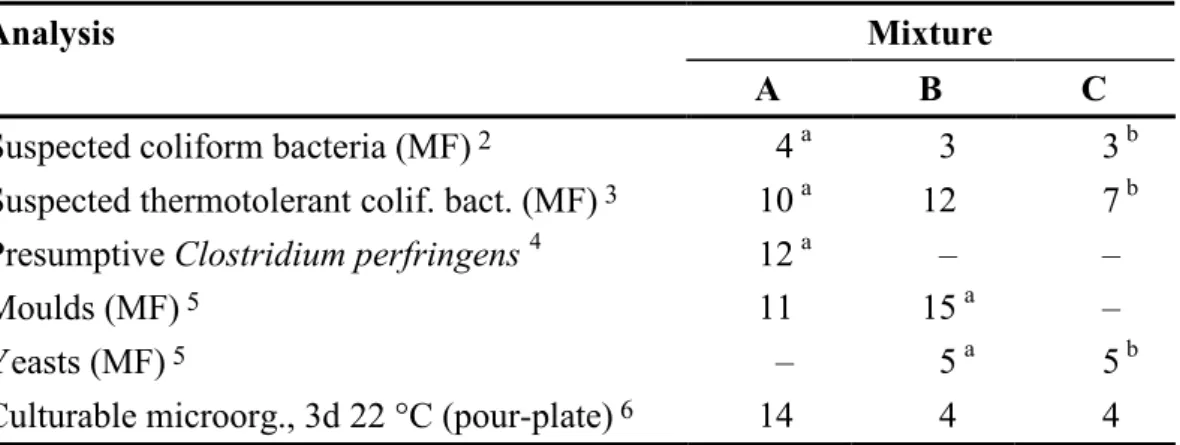
It is essential to have a homogeneous mixture and a uniform volume in all vials in order to allow comparison of all freeze-dried samples derived from one mixture. The volume was checked in at least 11 vials of each mixture and the biggest differences between vials were 5, 4 and 5 mg for mixture A, B and C, respectively. The highest accepted volume variation is 15 mg (3%). Table 2 presents the coefficients of variation (CV) of the results from duplicate analyses of 10 vials from each mixture. The results relate to the unit by volume at which the colonies were counted. The highest accepted CV normally is 25%. For very low colony counts a higher CV is accepted. However, no such analyses were present this time. Hence, according to the criteria, the three mixtures are homogenous. For a definition of low colony count and more about the calculations, see the scheme protocol (3)
Table 2 Coefficients of variation (%; square root transformed results 1) for various
microbial groups, in analyses performed in connection to the proficiency test
Analysis Mixture
A B C
Suspected coliform bacteria (MF) 2 4 a 3 3 b
Suspected thermotolerant colif. bact. (MF) 3 10 a 12 7 b
Presumptive Clostridium perfringens 4 12 a – –
Moulds (MF) 5 11 15 a –
Yeasts (MF) 5 – 5 a 5 b
Culturable microorg., 3d 22 °C (pour-plate) 6 14 4 4
1 n=10 mean values á 2 analyses of 100 ml for MF and 1 ml for pour-plate, if other is not stated; mixtures A, B and C analysed 9, 7 and 5 weeks ahead of the proficiency test, respectively
2 m-Endo Agar LES according to SS 028167 [a preliminary analysis of concentrations was also done on Lactose TTC Agar with Tergitol according to SS-EN ISO 9308-1:2000]
3 m-FC Agar, 44 °C according to SS 028167 [a preliminary analysis of concentrations was also done on Lactose TTC Agar with Tergitol according to SS-EN ISO 9308-1:2000]
4 Spores + Vegetative cells; Tryptose Sulphite Cycloserine Agar (TSC) 44 °C according to ISO/CD 6461-2:2002
5 Rose Bengal Agar containing both chlortetracycline and chloramphenicol (RBCC) according to SS 028179 6 Yeast extract Agar (YeA; yeast extract agar with tryptone) according to SS-EN ISO 6222:1999
a Results for 10 ml b Resuts for 5 ml – Not analysed
Laboratory results
General information regarding the results
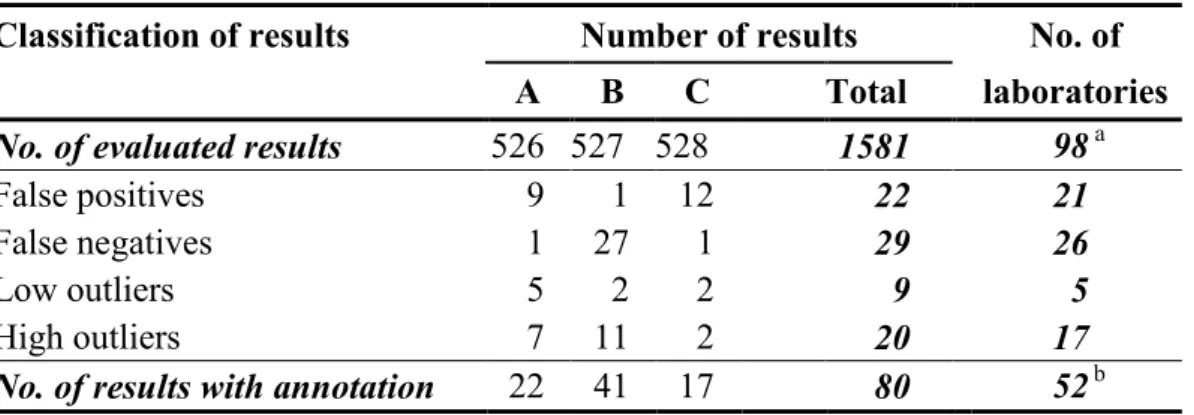
The histograms (Figure 1) show the actual distribution of the results. False positives are not presented in histograms but are compiled in Table 3 together with the other results with annotations. All reported laboratory results are listed in Annex A. Z-values for the all evaluated results are shown in Annex B and pictures of colony appearance on various media are presented in Annex C.
Most histograms have “tails” in either or both directions, due to values that do not belong to a normal distribution. Calculations are performed after square root transformations of the results which give better normal distributions and therefore decrease the significance of the “tails”. Very deviating values are present in most analyses and are identified as outliers (black bars) with the aid of Grubbs’ test according to a modification by Kelly (4). A level of 1% is used as risk to incorrectly assess a result as being an outlier. Although the method is objective, it is a prerequisite that the results are normally distributed in order to obtain correct outliers. In special situations, e.g. when many zero results are reported and in some borderline cases, a few subjective adjustments are made in order to set the right limits based on the knowledge of the mixture’s contents.
False negative results are presented with white bars in the histograms. False results and outliers are not included in the calculations. Calculations are more elaborately described in the scheme protocol (3).
The coefficient of variation (CV) is used to measure the dispersion of the laboratory results. If the dispersion is <10% it is regarded as very small, 10-20% as small, 20-30% as medium, 30-40% as large and >40% as very large.
Table 3 Number of analytical results with annotation in evaluated analyses
Classification of results Number of results No. of
A B C Total laboratories
No. of evaluated results 526 527 528 1581 98 a
False positives 9 1 12 22 21
False negatives 1 27 1 29 26
Low outliers 5 2 2 9 5
High outliers 7 11 2 20 17
No. of results with annotation 22 41 17 80 52 b
a Number of laboratories that reported analytical results
Livsmedelsverket, report no. 12/2012 9
Outcome of the mixtures
Mixture A
General information about the mixture
The composition of mixture A is presented in Table 1. The analyses for the detection of each microorganism are listed in Table 4, as well as the results average and the percentage of deviant results.
Table 4 Outcome of analyses for mixture A; F+ and F- are % of false positive and
false negative results, respectively. Outl < and Outl > are % of low and high outliers, respectively. Shaded analyses are not numerically assessed and the median is stated instead of mean.
Analysis Organisms cfu/
vol1 CV
2
(%) F+ F- Outl < Outl >
Susp. coliform bacteria (MF) E. coli
{S. marcescens} 170 —
Coliform bacteria (MF) E. coli
{S. marcescens} 196 27 - 0 0 0
Susp. thermotol. colif. bact. (MF) E. coli 120 —
E. coli (MF) E. coli 145 13 - 0 0 0
Coliform bact. (rapid method) E. coli
S. marcescens 406 15 - 0 3 2 E. coli (rapid method) E. coli 160 10 - 0 5 2 Presumptive C. perfringens (MF) C. perfringens 446 31 - 0 0 0
C. perfringens (MF) C. perfringens 327 38 - 3 0 0
Moulds (MF) Ph. glomerata 11 15 - 0 0 5
Yeast (MF) — 0 - 9 - - -
Culturable microorganisms
(total count) 22±2 °C, 3 days S. maltophilia S. marcescens E. coli
12 21 - 0 0 3
1 "colony forming units" per unit of volume – 1 ml for total count microorg., otherwise 100 ml
2 "Coefficient of Variation" – calculated from square root transformed results (see Annex A)
- numerical value impossible to obtain
— organism absent or numerical value has not been calculated ( ) the organism contributes with very few colonies
[ ] the organism is false positive in a presumptive analysis { } the result depends on the definition
Coliform bacteria, MF
- The results are quite well distributed but a second minor peak appears centred around values twice as high (Figure 1A). This distribution generated a medium CV for the overall results.
- When we performed analyses of the mixture A on m-Endo Agar LES and Lactose TTC Agar, colonies of S. marcescens could not be misinterpreted as colonies of coliform bacteria (Annex C). Therefore, the concentration of coliform bacteria in mixture A corresponds to the concentration of E. coli, 180 cfu/100 ml for our analysis (Table 1).
- Results included in the minor peak in the histogram (values >300 cfu/100 ml) are certainly due to counting S. marcescens colonies as coliform bacteria. The mean and variation for all results are given in Table 4.
- S. marcescens does not ferment lactose and therefore should not be considered as coliform bacterium according to the standard methods based on this feature. Hence, values included in the minor peak should be evaluated as high outliers when standard methods using for example m-Endo Agar LES and Lactose TTC Agar, are used. With method based on other detection’s mean and therefore
defining coliform bacteria in another way, like Chromocult Coliform Agar®,
colonies of S. marcescens can grow and be interpreted as coliform bacteria. See further in the section Outcome of the methods.
- In previous PT rounds with S. marcescens and E. coli in the same mixture, some high results were obtained similar to those in this round (9, 10)
196 ↓ 0 3 6 9 12 15 0 75 150 225 300 375 450 525 600 675 750 Coliform bacteria 35/36/37 °C (MF) Without remark Outlier False negative N o. o f r es ul ts
No. of colonies per 100 ml
Figure 1A Mixture A, Histogram of all analytical results. False negatives are
presented as white bars. Outliers, false negatives excluded, are represented by black bars. The x-axis scale is not adjusted to very high deviating results. They are marked with an asterisk. The mean value of the analysis is stated above the bars. Calculations have been made from square root transformed results, outliers and false negatives excluded.
Suspected thermotolerant coliform bacteria, MF
Livsmedelsverket, report no. 12/2012 11
- There are no outliers or false results for this analysis as it is not evaluated.
- The results correspond approximately to the major peak of the histogram for coliform bacteria (Figure 1A), that is the concentration of E. coli. However the results are from various medium at 44/44.5 °C, which gives often lower values than analyses performed at 36±2 °C.
120 (median) ↓ 0 3 6 9 12 15 0 25 50 75 100 125 150 175 200 225 250
Suspected thermotolerant coliform bacteria 44/44.5 °C (MF)
N o. o f r es ul ts
No. of colonies per 100 ml Figure 1B Mixture A, see figure 1A for explanation E. coli, MF
- The results are well distributed (Figure 1C) with a small dispersion.
145 ↓ 0 3 6 9 12 15 0 25 50 75 100 125 150 175 200 225 250 Escherichia coli (MF) N o. o f r es ul ts
No. of colonies per 100 ml Figure 1C Mixture A, see figure 1A for explanations
- The histogram includes values obtained on different media at 35/36/37 °C or 44/44.5 °C after confirmation. The results correspond in principle to the major peak in the histogram for coliform bacteria (Figure 1A).
Coliform bacteria, rapid method (MPN)
- The results are well distributed with a single peak (Figure 1D). The dispersion is small.
- Results correspond approximately to the minor peak in the histogram for coliform bacteria obtained with MF methods (Figure 1A) and include both the colonies of E. coli and S. marcescens.
406 ↓ 0 2 4 6 8 10 0 100 200 300 400 500 600 700 800 900 1000
Coliform bacteria (rapid, MPN)
N o. o f r es ul ts MPN-index per 100 ml *
Figure 1D Mixture A, see figure 1A for explanations
↓ 160 0 2 4 6 8 10 0 50 100 150 200 250 300 350 400 450 500
Escherichia coli (rapid, MPN)
N o. o f r es ul ts MPN-index per 100 ml Figure 1E Mixture A, see figure 1A for explanations
Livsmedelsverket, report no. 12/2012 13
E. coli, rapid method (MPN)
- The results were well distributed and the dispersion was somehow smaller than for the results obtained with MF methods (Figure 1E). The dispersion was very small to small.
- Results reflect the number of E. coli bacteria in the mixture with an average value slightly higher than the one obtained with the MF methods.
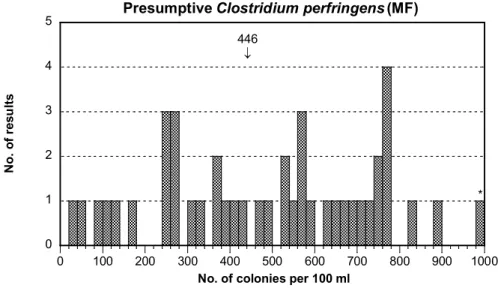
Presumptive and confirmed Clostridium perfringens, MF
- For both analyses the distributions of the results are really bad with large dispersions in both cases (Figure 1F and 1G).
- No outliers could be evaluated due to the large dispersion.
- The C. perfringens strain present in the mixture A grows well on TSC Agar even if the colonies can sometimes appear light-coloured. On the opposite, lower recovery often appears on medium like m-CP Agar (see the section Outcome of the methods for further discussion).
446 ↓ 0 1 2 3 4 5 0 100 200 300 400 500 600 700 800 900 1000
Presumptive Clostridium perfringens (MF)
N o. o f r es ul ts
No. of colonies per 100 ml
*
0 1 2 3 4 5 0 100 200 300 400 500 600 700 800 900 1000 Clostridium perfringens (MF) N o. o f r es ul ts
No. of colonies per 100 ml
327 ↓
Figure 1G Mixture A, see figure 1A for explanations Moulds and yeasts, MF
- Mould colonies were formed by Phoma glomerata. The distribution of the results is good with a small dispersion (Figure 1H).
- No yeasts were present in mixture A, however 9 out of 40 laboratories reported a quite high amount of yeast colonies which exclude the possibility of contamination from the air. By microscopy it appears evident that the reddish colonies don’t originate from yeast cells but bacterial cells. Biochemical identification revealed that it is the strain of Serratia marcescens that forms these colonies. Thus, the results from the 9 laboratories that reported yeast are therefore considered as false positive.
0 3 6 9 12 15 0 5 10 15 20 25 30 35 40 45 50 Moulds 25 °C (MF) N o. o f r es ul ts
No. of colonies per 100 ml
11 ↓
*
Livsmedelsverket, report no. 12/2012 15
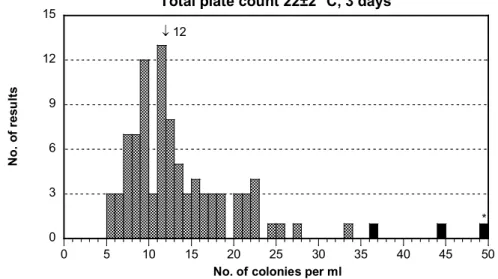
Culturable microorganisms 22 °C, 3 days
- The results were well distributed (Figure 1I). The dispersion was medium and not smaller due to the low number of colonies.
- The results included about equal colony numbers of coliform bacteria and
Stenotrophomonas maltophilia. The analysis was without problem.
↓ 12 0 3 6 9 12 15 0 5 10 15 20 25 30 35 40 45 50
Total plate count 22±2 °C, 3 days
N o. o f r es ul ts
No. of colonies per ml
*
Mixture B
General information about the mixture
The composition of mixture B is presented in Table 1. The analyses for the detection of each microorganism are listed in Table 5, as well as the results average and the percentage of deviant results.
Table 5 Outcome of each analysis for mixture B; see Table 4 for explanations.
Analysis Organisms cfu/
vol1 CV
2
(%) F+ F- Outl < Outl >
Susp. coliform bacteria (MF) E. coli
[A. hydrophila]
121 —
Coliform bacteria (MF) E. coli 19 30 - 4 0 5
Susp. thermotol. colif. bact. (MF) E. coli 10 —
E. coli (MF) E. coli 14 24 - 4 0 5
Coliform bact. (rapid method) E. coli 15 13 - 0 0 2
E. coli (rapid method) E. coli 15 13 - 0 0 0
Presumptive C. perfringens (MF) — 0 - 2 - - -
C. perfringens (MF) — 0 - 0 - - -
Mould (MF) Ph. fastigiata 291 42 - 10 0 0
Yeast (MF) I. orientalis 518 8 - 44 0 5
Culturable microorganisms
(total count) 22±2 °C, 3 days S. cohnii (A. hydrophila) (E. coli) 81 8 - 0 2 0 Coliform bacteria, MF 0 3 6 9 12 15 0 10 20 30 40 50 60 70 80 90 100 Coliform bacteria 35/36/37 °C (MF) N o. o f r es ul ts
No. of colonies per 100 ml
* 19
↓
Livsmedelsverket, report no. 12/2012 17
- The results are spread with a tail of higher values which generated a medium dispersion close to large (Figure 1J).
- Coliform bacteria are represented by a typical strain of E. coli in this mixture. - Nine laboratories reported identical results for the analysis of suspected and
confirmed coliform bacteria. In some cases the strain A. hydrophila seems to have been counted as a coliform bacterium because confirmation step was not performed or failed. In other cases the colonies of A. hydrophila were probably not taken into account even in the amount of suspected coliform bacteria. In most cases A. hydrophila were excluded after the confirmation step and therefore the median value decreased from 121 to 17 cfu/100 ml (Annex A). Suspected thermotolerant coliform bacteria, MF
- Most results are gathered but some unexpected high values were also reported, which gives somewhat a scatter of the overall outcome (Figure 1K).
- There are no outliers or false results for this analysis as it is not evaluated.
- The results include the amount of E. coli colonies on various media after incubation at 44/44.5 °C. This temperature leads often to lower values than the corresponding ones from 35/36/37 °C.
↓ 10 (median) 0 3 6 9 12 15 0 15 30 45 60 75 90 105 120 135 150
Suspected thermotolerant coliform bacteria 44/44.5 °C (MF)
Zero results N o. o f r es ul ts
No. of colonies per 100 ml Figure 1K Mixture B, see figure 1A for explanations E. coli, MF
- The results are a little bit spread with a tail of higher values (Figure 1L) and medium dispersion.
- The reason for these high values is not known, even if high results were seen also for coliform bacteria that probably were counted on the same plates. The amount of A. hydrophila colonies might have been included in the coliform
results. However this should not happen after the confirmation steps for analysis of E. coli. Some of the high results, therefore seem to come from the high results of suspected thermotolerant coliform bacteria.
0 3 6 9 12 15 0 10 20 30 40 50 60 70 80 90 100 Escherichia coli (MF) N o. o f r es ul ts
No. of colonies per 100 ml
* 14
↓
Figure 1L Mixture B, see figure 1A for explanations Coliform bacteria, rapid method (MPN)
- The distribution of results is good with a small dispersion (Figure 1M).
- Often the average values are somewhat higher with Colilert®-18/24
Quanti-Tray® than with MF methods but this time the opposite occurred. It can be
explained by the amount of A. hydrophila colonies that were included in the counting of the MF methods and there increased the average result.
0 3 6 9 12 15 0 5 10 15 20 25 30 35 40 45 50
Coliform bacteria (rapid, MPN)
N o. o f r es ul ts MPN-index per 100 ml * 15 ↓
Livsmedelsverket, report no. 12/2012 19
E. coli, rapid method (MPN)
- The distribution of the results is good with a small dispersion (Figure 1N). - The results were in principle identical to the results of coliform bacteria analysis
with rapid method. In general both parameters are measured with the same kit.
0 3 6 9 12 15 0 5 10 15 20 25 30 35 40 45 50
Escherichia coli (rapid, MPN)
N o. o f r es ul ts MPN-index per 100 ml 15 ↓
Figure 1N Mixture B, see figure 1A for explanations Presumptive and confirmed Clostridium perfringens, MF No C. perfringens were present in mixture B. Moulds and yeasts, MF
- The results for moulds are mainly divided in two groups: values <220 and >420 cfu/100 ml (3 results are in between) (Figure 1O). Therefore the dispersion is very large (42%).
- The results for yeasts are well distributed with a small dispersion, but 17 false negative results were reported (Figure 1P).
- The very large dispersion of the mould results is due to a misinterpretation of yeast colonies, including them in values above 300 or 400 cfu/100 ml for moulds and leading to negative results in the yeast analysis.
- The yeast Issatchenkia orientalis forms a kind of filaments (pseudohyphae) appearing similar to hyphae by microscopic observation, which can lead to a misinterpretation of a mould. However, the cells present also more typical yeast structures. I. orientalis is the asexual form of the yeast Candida kruseii.
0 2 4 6 8 10 0 100 200 300 400 500 600 700 800 900 1000 Moulds 25 °C (MF) N o. o f r es ul ts
No. of colonies per 100 ml
* 291 ↓ 0 4 8 12 16 20 0 100 200 300 400 500 600 700 800 900 1000 Yeasts 25 °C (MF) N o. o f r es ul ts
No. of colonies per 100 ml
* 518
↓
Figure 1O and 1P Mixture A, see figure 1A for explanations Culturable microorganisms, 22 °C, 3 days
- The results are well distributed with a very small dispersion (Figure 1Q).
- The colonies counted are mainly from S. cohnii cells but coliform bacteria can also grow and account for some colonies.
O
Livsmedelsverket, report no. 12/2012 21 0 4 8 12 16 20 0 20 40 60 80 100 120 140 160 180 200
Total plate count 22±2 °C, 3 days
N o. o f r es ul ts
No. of colonies per ml
81 ↓
Figure 1Q Mixture B, see figure 1A for explanations
Mixture C
General information about the mixture
The composition of mixture C is presented in Table 1. The analyses for the detection of each microorganism are listed in Table 6, as well as the results average and the percentage of deviant results.
Table 6 The outcome of each analysis in mixture C; see Table 4 for explanations.
Analysis Organisms cfu/
vol1 CV
2
(%) F+ F- Outl < Outl >
Susp. coliform bacteria (MF) K. pneumoniae
K. oxytoca
1245 —
Coliform bacteria (MF) K. pneumoniae
K. oxytoca 1253 10 - 1 0 0
Susp. thermotol. colif. bact. (MF) K. pneumoniae 415 —
E. coli (MF) — 0 - 9 - - -
Coliform bact. (rapid method) K. pneumoniae
K. oxytoca 1320 10 - 0 3 0
E. coli (rapid method) — 0 - 0 - - -
Presumptive C. perfringens (MF) [C. bifermentans] 1028 93 - 0 0 0
C. perfringens (MF) — 0 - 11 - - -
Mould (MF) — 0 - 3 - - -
Yeast (MF) C. glabrata 817 8 - 0 0 3
Culturable microorganisms
(total count) 22±2 °C, 3 days K. oxytoca C. glabrata K. pneumoniae
Coliform bacteria, MF
- The distribution of results was good with a very small dispersion (Figure 1R). - The coliform bacteria included in mixture C were K. pneumoniae and K.
oxytoca which form typical colonies on m-Endo Agar LES and LTTC Agar.
1253 ↓ 0 3 6 9 12 15 0 250 500 750 1000 1250 1500 1750 2000 2250 2500 Coliform bacteria 35/36/37 °C (MF) N o. o f r es ul ts
No. of colonies per 100 ml Figure 1R Mixture C, see figure 1A for explanations Suspected thermotolerant coliform bacteria, MF
42 results were reported for this analysis (Figure 1S). Colonies are from K.
pneumoniae which growth on m-FC agar or Lactose TTC Agar at 44/44.5 °C. The
explanation for the two zero values are unknown. This analysis is not evaluated.
415 (median) ↓ 0 2 4 6 8 10 0 150 300 450 600 750 900 1050 1200 1350 1500
Suspected thermotolerant coliform bacteria 44/44.5 °C (MF)
Zero results N o. o f r es ul ts
No. of colonies per 100 ml Figure 1S Mixture C, see figure 1A for explanations
Livsmedelsverket, report no. 12/2012 23
E. coli, MF
Mixture C did not contain any E. coli strain, however 7 false positive results were reported. Either confirmation steps were not performed on thermotolerant colonies, or confirmation was performed for oxidase and indol production only but on colonies grown at 35-37 °C. Sometimes, K. oxytoca which is oxidase negative and indole positive can generate a positive result for indole test in broth with tryptophan at 44 °C (5). Such colonies will therefore be misinterpreted as E. coli. If an additional confirmation step is performed, like the production of gas or a β-glucuronidase test (MUG), the false positive results will be avoided.
Coliform bacteria, rapid method (MPN)
- The distribution of results is good with a very small dispersion (Figure T) - The results are quite similar to those obtained with MF methods but slightly
higher. The same organisms are detected in both analyses, i.e. K. pneumoniae and K. oxytoca. 1320 ↓ 0 3 6 9 12 15 0 250 500 750 1000 1250 1500 1750 2000 2250 2500
Coliform bacteria (rapid, MPN)
N o. o f r es ul ts MPN-index per 100 ml Figure 1T Mixture C, see figure 1A for explanations E. coli, rapid method (MPN)
Presumptive and confirmed Clostridium perfringens, MF
- Many laboratories reported presumptive C. perfringens in mixture C. The distribution of the results is wide without obvious grouping (Figure 1U), which generates a very large dispersion (93%).
- For this reason no outliers could be identified but 13 zero values were reported. - Mixture C contained no C. perfringens but a strain of C. bifermentans that forms
more or less black colonies on TSC Agar. The zero values were mainly obtained with other types of media (see the section Outcome of the methods).
1028 ↓ 0 4 8 12 16 20 0 1000 2000 3000 4000 5000 6000 7000 8000 9000 1 104
Presumptive Clostridium perfringens (MF)
Zero results N o. o f r es ul ts
No. of colonies per 100 ml Figure 1U Mixture C, see figure 1A for explanations
817 ↓ 0 2 4 6 8 10 0 200 400 600 800 1000 1200 1400 1600 1800 2000 Yeasts 25 °C (MF) N o. o f r es ul ts
No. of colonies per 100 ml Figure 1V Mixture C, see figure 1A for explanations
Livsmedelsverket, report no. 12/2012 25
Moulds and yeasts, MF
- Only the yeast Candida glabrata was present in mixture C.
- The dispersion of the results is good with a very small dispersion (Figure 1V). Culturable microorganisms 22 °C, 3 days
- The results were well distributed with a small dispersion (Figure 1W).
- The colonies are mainly formed by the coliform bacteria K. pneumoniae and K.
oxytoca and the yeast C. glabrata.
0 6 12 18 24 30 0 5 10 15 20 25 30 35 40 45 50
Total plate count 22±2 °C, 3 days
N o. o f r es ul ts
No. of colonies per ml
* 16
↓
Outcome of the methods
Method information by use of internet
According to EN ISO/IEC 17043, for which the proficiency testing program organized by the National Food Agency is accredited since early 2012, the provider shall be able to group results according to the methods used. The method information is reported via our website www.slv.se/absint, after logging on.
General information regarding methods outcome
The number of results for the various methods is clear from the descriptive part of Annex A. Although method information is available for all numerical results, it is not always easy to interpret. For example, sometimes the medium used differs from what is stated in the standard. Results from such laboratories are usually not shown in this report. They will be omitted or placed in the group “Other”.
Method information from laboratories with outliers or false results for a particular analysis will not be included in the compilations. However, it is possible that some methods generate more deviating results than others and therefore might be mentioned in the text. Methods with 3 or fewer results will normally not be discussed in the comparisons.
No statistical tests are done in this report based on results grouped according to method parameters. Thus, significant differences cannot be discussed.
The method outcome of coliform bacteria and E. coli obtained with rapid methods as well of culturable microorganisms are not discussed for this PT round. Coliform bacteria and E. coli with membrane filtration methods (MF)
Alternative methods
In Norway, Finland, Sweden and some other European countries other membrane filtration methods (MF) for coliform bacteria can be used at statutory sampling, as alternatives to the reference method EN ISO 9308-1:2000 based on Lactose TTC Agar with Tergitol 7 (”LTTC Agar”). National methods in Norway, Finland and Sweden are based on m-Endo Agar LES (”LES endo agar”) and m-FC Agar, but are usually more or less modified. In Sweden and Finland, m-FC Agar must not be used for statutory sampling of drinking water. Rather E. coli should be identified by confirmation from LES Endo Agar plates incubated at 36±2 °C. In Sweden, E.
coli is confirmed by a negative oxidase test for coliform bacteria, a positive indole
test at 44 °C and a positive β-glucuronidase activity test. In Finland, an additional gas test at 44 C or β-glucuronidase activity test is recommended as complement to the indole test. To be interpreted as E. coli, colonies must there be indole positive as well as gas or β-glucuronidase positive. The β-glucuronidase test is a complement to the indol test in order to eliminate for example indole positive and, in confirmation broth, thermotolerant strains of Klebsiella oxytoca (5).
Livsmedelsverket, report no. 12/2012 27
Table 7 Numbers of results and their outcome, outliers excluded, with different
method standards for the analysis of coliform bacteria (A) and E. coli (B) with MF methods and incubation at 36±2 °C
Method standard Total Mixture
no. of A B C res. n Mv 1 n Mv 1 n Mv 1 A. Coliform bacteria 87 79 196 71 19 78 1253 XX-EN ISO 9308-1:2000 a 24 20 190 16 23 20 1141 SS 028167 b 25 23 161 22 16 22 1295 SFS 3016 c 27 26 253 24 18 26 1322 NS 4788 d 6 6 160 6 23 6 1219 Other 5 4 149 3 26 4 1203 B. Escherichia coli 52 49 155 44 15 45 0 XX-EN ISO 9308-1:2000 a 14 12 149 10 15 10 0 SS 028167 Modif. b, e 17 17 161 17 15 17 0 SFS 3016/4088 Modif.e, f, g 18 17 149 15 14 16 0 NS 4792 h 2 2 145 1 15 1 0 Other 1 1 236 1 18 1 0
1 Mean values based on square root transformation; cfu per 100 ml
a ISO/CEN Standard: Water quality — Detection and enumeration of Escherichia coli and
coliform bacteria — Part 1: Membrane filtration method, September 2000 (XX stands for the national translations, if any)
b Swedish Standard: Coliform Bacteria, Thermotolerant Coliform Bacteria and Escherichia coli in
Water — Determination with Membrane Filtration Method (MF), 2nd ed. 1996-03-13
c Finnish Standard: Membrane filter technique for the enumeration of total coliform bacteria in
water, 2001-05-21
d Norwegian Standard: Coliform Bacteria — Membrane filter method, 1st ed. May 1990
e E. coli are coliform bacteria from m-Endo Agar LES that are indole positive at 44 °C and also β
-glucuronidase positive
f Finnish Standard: Membrane filter technique for the enumeration of thermotolerant (faecal)
coliform bacteria in water, 2001-05-21
g E. coli are coliform bacteria from m-Endo Agar LES that are indole positive, alternatively gas &
indole positive or β-glucuronidase & indole positive at 44 °C
h Norwegian Standard: Thermotolerant coliform bacteria and presumptive E. coli — Membrane
filter method, 1st ed. May 1990
Apart from the reference method XX-EN ISO 9308-1:2000 (XX stands for the national versions), the older national standards used in Finland, Norway and Sweden are presented individually in Table 7 and 8. For E. coli, the terms SS 028167 Modif. and SFS 3016/4088 Modif. include modifications such as e.g. those that were stated above, with respect to Sweden and Finland.
Results
Regarding coliform bacteria, there is no general difference between methods for mixture C (Table 7A) which contained two typical coliform bacteria strains easy to interpret (Annex C). On the other hand, with mixture A, the results obtained using the Swedish or Norwegian standard methods were lower than those obtained when using Finnish standard method or the reference method XX-EN ISO 9308-1. This is certainly linked to the media actually used, the way to interpret colony appearance and possibly the time of incubation. S. marcescens forms atypical
(Annex C). On chromogenic media like Chromocult Coliform Agar®, S.
marcescens appears like coliform bacteria. Possibly, colonies may be interpreted as
colonies on media based on lactose fermentation after one day of incubation from Table 8 Numbers of results and their outcome with different method standards for
the analysis of suspected thermotolerant coliform bacteria (A; median of all results) and E. coli (B; mean
Method standard
outliers excluded) with MF methods and incubation at 44/44.5 °C
Total Mixture
no. of A B C
res. n Mv 1 n Mv 1 n Mv 1
A. Susp. thermotol. colif. bact. 60 44 120 44 10 44 415
XX-EN ISO 9308-1:2000 a 10 8 139 8 16 8 403 SS 028167 b 13 11 130 11 11 11 430 SFS 4088 c 19 13 120 13 10 13 450 NS 4792 d 8 7 109 7 8 7 400 Other 10 5 100 5 27 5 410 B. Escherichia coli 11 11 132 11 12 11 0 XX-EN ISO 9308-1:2000 a 2 2 123 2 13 2 0 SS 028167 b 1 1 140 1 14 1 0 SFS 4088 c 3 3 153 3 11 3 0 NS 4792 d 3 3 105 3 8 3 0 Other 2 2 152 2 21 2 0
1 Median or mean values based o square root transformation; cfu/100 ml.
a ISO/CEN Standard: Water quality — Detection and enumeration of Escherichia coli and
coliform bacteria — Part 1: Membrane filtration method, September 2000 (XX stands for the national translations, if any)
b Swedish Standard: Coliform Bacteria, Thermotolerant Coliform Bacteria and Escherichia coli in
Water — Determination with Membrane Filtration Method (MF), 2nd ed. 1996-03-13
c Finnish Standard: Membrane filter technique for the enumeration of thermotolerant (faecal)
coliform bacteria in water, 2001-05-21
d Norwegian Standard: Thermotolerant coliform bacteria and presumptive E. coli — Membrane
Livsmedelsverket, report no. 12/2012 29
coliform bacteria after two days of incubation on m-Endo Agar LES. The reason for the high values obtained with Finnish standard method is not clear.
Some method differences occurred also in mixture B. In this case, it is the used Norwegian standard method, as well as some other methods, together with the reference method XX-EN ISO 9308-1 that gave higher results than the Finnish and Swedish standard methods. Mixture B contained a strain of Aeromonas hydrophila which forms coliform-like colonies on media based on lactose fermentation. The result differences depend certainly on the way confirmation steps are performed. Colonies can easily be misinterpreted as from coliform bacteria if not enough colonies of A. hydrophila are tested for oxidase reaction.
Table 7B presents the results outcome for E. coli confirmed after primary incubation at 36±2 °C. Mixture A and B contained both an E. coli strain while mixture C did not contain any. No differences appeared according to the method used for either mixture.
Table 8 presents the results outcome for suspected thermotolerant coliform bacteria and confirmed E. coli from media incubated at 44/44.5 °C. For the analysis of suspected thermotolerant coliform bacteria the national methods were used as much as the method EN ISO 9308-1:2000. For E. coli the results are too few to draw any conclusion regarding differences (Table 8B). The results of suspected thermotolerant coliform bacteria reveal differences for all mixtures (Table 8A). In all cases the average value is on the lower side when Norwegian standard were used. Such trends cannot be seen for the other standard methods. The fact that Norwegian standard method gives often lower results is certainly due to an Table 9 Numbers of results, outliers excluded, with different method variants in
the analysis of coliform bacteria (A) and E. coli (B) with membrane filtration
A. Coliform bacteria MF Total Mixture
no. of A B C
res. n Mv 1 n Mv 1 n Mv 1
Medium 87 79 196 71 19 78 1253
m-Endo Agar/Broth LES 60 58 197 54 18 57 1295
”LTTC Agar” 2 18 16 205 13 19 16 1174 “Wrong information” 5 4 136 3 44 4 1013 Chromocult Agar 2 1 236 1 18 1 1182 Other 2 0 – 0 – 0 – Incubation temperature 87 77 196 71 19 78 35 °C 25 21 158 22 18 23 1253 1251 36 °C 19 15 250 14 19 17 1283 37 °C 41 39 201 34 20 37 1239 Other 2 2 120 1 32 1 1300
Table 9 continued
B. Escherichia coli MF Total Mixture
no. of A B C
res. n Mv 1 n Mv 1 n Mv 1
Medium 35/36/37 °C 3 52 49 155 44 15 45 0
m-Endo Agar/Broth LES 37 36 154 33 15 34 0
”LTTC Agar” 2 12 11 152 9 15 9 0
Wrong media vs. method 3 1 1 124 1 12 1 0
Chromocult Agar 2 1 236 1 18 1 0 Other 0 0 – 0 – 0 – Medium 44/44.5 °C 4 11 11 132 11 12 11 0 m-FC Agar/Broth 7 7 129 7 10 7 0 ”LTTC Agar 2 2 2 123 2 13 2 0 Other 2 2 152 2 21 2 0 Incubation temperature 81 77 145 69 14 70 0 From 35/36/37 °C 52 49 155 44 15 45 0 From 44/44.5 °C 12 12 130 12 12 12 0 From 36 or 44 °C 16 16 129 13 15 13 0 Unknown 1 0 – 0 – 0 –
1 Mean values calculated based on square root transformation
2 m-Lactose TTC (2,3,5-triphenyltetrazolium chloride) Agar + Tergitol 7 (heptadecylsulphate) according to EN ISO 9308-1:2000
3 Other media than m-Lactose TTC Agar given while referring to the standard XX.EN ISO 9308-1:2000 4 Results regarding confirmed E. coli; from method information for coliform bacteria
5 Results regarding confirmed E. coli; from method information for thermotolerant coliform bacteria – this is the reason why fewer results are present here for than for E. coli in total at 44/44.5 °C
incubation at 44.5 °C. The use of m-FC Agar medium and a temperature of 44.5 °C have especially shown to give low results, depending on the E. coli strain and perhaps also depending on the filter used. Inhibitors or selective agents have a bigger impact at high, and therefore more selective, temperature. Other factor of influence is the way confirmation steps are performed on suspected thermotolerant coliform bacteria. This can differ from one country to another and therefore be correlated to the used method.
Table 9A presents the results according to the media used for analyses. Small difference appears but not as evident as in Table 7A. This is certainly due to the fact that the differences are mainly caused by the confirmation steps (mixture B) or the interpretation of colonies (mixture A) and not directly by the medium used. The
only result with Chromocult coliform Agar®, which is high and included S.
marcescens as coliform bacterium, indicates that medium can play an important
Livsmedelsverket, report no. 12/2012 31
The low results obtained at 35 °C compared to 36 and 37 °C are apparent and reflect the fact that it is mainly Swedish laboratories that used this temperature.
It is difficult to conclude anything for E. coli concerning the use of different media as the results are similar or too few to allow any comparison (Table 9B). Nevertheless it indicates that lower values are obtained for E. coli analysis after incubation at 44/44.5 °C compared to 36±2 °C.
Clostridium perfringens with membrane filtration methods (MF) Various methods
The analysis of Clostridium perfringens is performed in different ways in different countries and laboratories. This is due to the fact that no international standard is stated as reference method in the European drinking water directive (1). The parameters to be analysed according to the directive are spores and vegetative cells of C. perfringens. When this decision was taken, there was no international standard for water analyses. Therefore, one method was explicitly stated in the drinking water directive, namely the usage of m-CP Agar at 44 °C. This method includes a confirmatory step with ammonia vapour that makes C. perfringens colonies turning red.
Since many countries were unfamiliar with that method and as there was an ongoing standardisation work, there were desires to use the method in the standardisation process. An approval of using the most current standard draft was given by the group concerned under the EU commission. At that time, the method was available as a Committee Draft (CD), ISO/CD 6461-2:2002-12-20. Certain modifications were decided upon later at ISO standardisation meetings and communicated in the PT instructions of the National Food Agency. The last year’s standardisation work has been started again in ISO and there is now a version in an even later stage, a Draft International Standard (DIS). This new standard proposition got the number ISO/DIS 14189 and should be finalized during 2013. In the main part it is similar to the CD version of 2002 with modifications but the confirmation step has been simplified: isolated, sub-cultured colonies should be tested for the acid phosphatase enzyme.
Another method that has been used is the older method for analysis of sulphite reducing anaerobic bacteria, EN ISO 26461-2:1993. It may have been used as it is, with or without heating of the sample, when it is comparable to the analysis of presumptive C. perfringens, or after a modification which makes it comparable to ISO/CD 6461-2:2002 by the introduction of a confirmation step for the identification of C. perfringens.
Results
In many cases it is unclear how exactly the methods were used. It is clear from Table 10 that the mean values for the laboratories that reported presumptive results are lower in mixtures A and C when m-CP Agar was used, in comparison to the two other methods. This is in agreement with the results reported in spring 2008
Table 10 Total number of method information answers and outcome of the results
(outliers excluded) with different methods in analysis of Clostridium perfringens in mixture A and C
Method/"Standard" Total Mixture
no. of A (pres. 1) A (conf. 1) C (pres. 1)
answ. n Mv 2 n Mv 2 n Mv 2
With stated method, total 56 43 446 34 327 44 1028
EN ISO 26461-2:1993 3 9 7 490 8 428 7 1487
ISO/CD 6461-2:2002 4 27 27 535 8 487 27 1347
EU directive (m-CP Agar) 5 13 6 177 12 200 6 202
DS 2256 6 2 1 127 2 166 1 0
Other 5 2 363 4 375 3 467
1 pres. = presumptive C. perfringens; conf. = confirmed C. perfringens
2 Mean values calculated based on square root transformation for 100 ml sample
3 Water quality — Detection and enumeration of sulphite-reducing anaerobes (clostridia), Part 2:
Method by membrane filtration (ISO 6461/2:1986)
4 Water quality — Detection and enumeration of Clostridium perfringens, Part 2: Method by MF
5 Council Directive 98/83/EC of 3 November 1998 (see reference 1)
6 Dansk Standard; Vandundersøgelse, Bestämmelse af Clostridium perfringens, 1 udg., Jan 1983
and 2011 (8, 11). Like in 2011, the same trend appears when looking at the confirmed results of mixture A. Even most other methods gave much lower results with the C. perfringens strain and the C. bifermentans strain that were included in mixture A and C, respectively.
When using m-CP Agar, there are no presumptive results really, but they ought to be identical to the confirmed results. This seems to be true for mixture A, although results have not always been given by the same laboratory for both categories. Therefore it is possible that the “confirmed value” is higher than the “presumptive value”.
In total 23 out of 56 laboratories gave results for both presumptive and confirmed C. perfringens analyses However, it is only partly the same laboratories that have reported both presumptive and confirmed results which implies that it is not totally possible to compare both analyses in mixture A.
Table 10 shows clearly that the ways laboratories used EN ISO 26461-2:1993 and ISO/CD 6461-2:2002 they obtained approximately similar results.
Table 11 presents the results obtained with different media independently of the method used. Here again, it is clear that lower values are obtained with the use of m-CP Agar for both mixture A and C.
All accepted analytical results were obtained after anaerobic incubation, mostly at 44 °C.
Livsmedelsverket, report no. 12/2012 33
Table 11 Total numbers of method information answers and outcome of the results
(outliers excluded) with different substrates and different incubation temperatures in analysis of Clostridium perfringens in mixture A and C
Method variant Total Mixture
no. of A (pres. 1) A (conf. 1) C (pres. 1)
answ. n Mv 2 n Mv 2 n Mv 2
Medium 56 43 446 34 327 44 1028
“PAB/TSC Agar” 44 °C 3 37 34 545 17 507 34 1520
“SFP Agar” 4 1 0 – 0 – 1 0
m-CP Agar 5 15 7 189 14 203 9 149
Iron Sulphate Agar 6 3 2 85 3 121 2 0
Other 0 0 – 0 – 0 –
1 pres. = presumptive C. perfringens; conf. = confirmed C. perfringens
2 Mean values calculated based on square root transformation
3 Perfringens Agar base / Tryptose Sulphite Cycloserine Agar; was here used with D-cycloserine.
4 SFP Agar contains Polymyxine & Kanamycine.
5 m-CP Agar contains D-cycloserine & Polymyxine.
6 No specific antibiotic is included in Iron Sulphate Agar.
Moulds and yeasts in water (MF)
Various methods
Out of 40 laboratories that gave method information, 34 used the Swedish standard SS 028192. Besides Sweden, this standard is used in Denmark, and Finland and Norway, but under the national designations SFS 5507 and NS 4716, respectively. Furthermore, 6 laboratories used their own method, food methods and one method from Standard Methods of Water and Wastewater (6).
Results
As in previous rounds when method information regarding the fungal analyses was collected, for example 2005 (7), many different media were used (Table 12). Even though most are suitable for this analysis, all are not.
DG 18 is a medium with low water activity and is developed for xerophilic fungi, i.e. fungi that grow on dry media. This medium is commonly used for food analyses. Results derived from DG 18 can therefore be expected to be somewhat lower than for most other media used when fungi that thrive in aquatic environments are included. Only one laboratory used this medium.
Malt Extract Agar is a common medium for micro-fungi analysis and is less inhibiting for rapidly growing fungi, such as Rhizopus sp. and Mucor sp., than the other used media. The inhibition level of the various media towards bacterial growth depends on whether suitable antibiotics are added. Some media contain Rose Bengal, a pigment with growth inhibiting properties and antibacterial
chemicals such as chlortetracycline, chloramphenicol or oxytetracycline. Moreover, DRBC Agar and DG 18 contain low concentration of dichloran which, in addition to Rose Bengal, restrains the growth of rapidly growing fungi, and hence, facilitates the interpretation of other fungi.
Table 12 Colony count on different agar media for micro fungi analysis of
mixtures A, B and C, outliers excluded. Recommended supplements in the different media are indicated within parentheses in the notes.
Medium Cooke1 RBC2 DRBC3 OGYE4 ME5 DG6 18 Other7
Mould Mixture A No. of lab. 12 10 8 2 3 1 1 Min 8 4 7 7 5 11 5 Median 12 12 12 11 13 11 5 Max 16 16 14 16 13 11 5 Mixture B No. of lab. 12 9 8 3 3 1 0 Min 100 36 73 20 120 530 Median 456 300 169 100 180 530 Max 810 670 523 300 1000 530 Yeast Mixture B No. of lab. 5 5 6 1 2 0 1 Min 391 482 360 465 440 580 Median 514 520 495 465 503 580 Max 600 590 700 465 570 580 Mixture C No. of lab. 12 9 10 3 3 1 1 Min 600 626 740 600 727 800 830 Median 746 760 835 768 780 800 830 Max 1132 1027 1100 970 800 800 830
1 Cooke Rose bengal Agar (chlortetracycline)
2 Rose bengal Agar (chloramphenicol)
3 Dichloran Rose bengal Agar (chloramphenicol) 4 Glucose Yeast extract Agar (oxytetracycline) 5 Malt extract Agar
6 Dichloran Glycerol (18%) Agar (chloramphenicol) 7 Sabouraud Agar (no supplement)
Livsmedelsverket, report no. 12/2012 35
Based on the national standards prescriptions, more supplements were added to the different media than the antibiotic recommended by manufacturers (see notes for Table 12). For example, Swedish laboratories use often both chlortetracycline and chloramphenicol according to the standard SS 028192.
The results from the various media as stated by the laboratories or after our interpretation based on product designation, regardless of which antibiotic are really used, is clear from Table 12. No outliers are included. The results are stated as median, lowest and highest values. For moulds, no differences appear for mixture A, but the results are lower for mixture B when DRBC, OGYE and ME Agar were used, compared to Cooke´s Rose Bengal Agar and RBC. The used of these medium did not lead to such difference for yeast analysis of mixture B or C. The total median values for the respective mixture is given in Annex A.
Table 13 Number of method answers (n) and average values of the results (Mv),
outliers excluded, for mould and yeast analyses with different methods variations.
Methods variations Tot Moulds A Moulds B Yeast B Yeast C
n n Mv1 n Mv1 n Mv1 n Mv1 Growth inhibitors Rose bengal 12 12 10 10 234 8 515 11 786 Dichloran 6 6 11 4 230 4 495 6 845 Antibiotics Only chlortetracycline 1 1 14 1 460 0 – 1 830 Only chloramphenicol 10 8 12 8 329 5 493 10 814 Chlortetra. + chloramph. 20 20 11 19 315 9 495 19 843 Oxytetracycline 4 3 10 4 109 2 462 4 781 Other 4 4 8 3 515 2 575 4 789 Incubation temperature <24 °C 6 5 9 3 286 3 552 6 861 24-26 °C 34 32 12 33 291 17 512 33 809 >26 °C 0 0 – 0 – 0 – 0 – Unknown 0 0 – 0 – 0 – 0 – Incubation time <5 days 0 0 – 0 – 0 – 0 – 5 days 5 4 9 3 223 3 511 5 812 6 days 0 0 – 0 – 0 – 0 – 7 days 35 33 11 33 298 17 519 34 817 >7 days 0 0 – 0 – 0 – 0 – Unknown 0 0 – 0 – 0 – 0 –
The results regarding various circumstances listed in Table 13 show clearly that the laboratories that used oxytetracycline, that is OGYE medium, got lower values for mould analysis of mixture B. Such trend did not appear for any of the other analyses.
Several laboratories added both chloramphenicol and chlortetracycline to the medium, often Cooke’s Rose Bengal, according to the standard SS 028192. However no evident differences could be noticed in Table 13 when only one of the antibiotic was added.
We suspect that many laboratories using media already containing Rose Bengal are not aware of it, which could explain the low number of laboratories that reported the use of this supplement.
Globally, the temperature and time of incubation did not strongly influence the results obtained. Looking at the mould analyses, even though few results were reported for 5 days of incubation, it seems there is a trend for the values to be slightly lower than for 7 days of incubation.
The outcome of deviating results – assessment
The results of all laboratories are listed in Annex A. A summary of the results of each laboratory – false results excluded – is illustrated by a box plot based on their z-scores (Figure 2). The smaller, and the more centred around zero the box of a laboratory is, the closer its results are to the general mean values calculated for all laboratory results.
The laboratories are not grouped or ranked based on their results. However, the assessment aims to clearly give information regarding the number of false results and outliers which are presented below the box plots. These results are also are highlighted in Annex A, where also the minimum and maximum accepted values for each analysis are stated in the summarizing rows at the end.
In cases where it is obvious, it is also stated if a laboratory has mixed up the analytical results. If mixtures have been mixed up, it is shown by crossing of their sample numbers in Annex A. No laboratory seems to have mixed up the results from individual analyses this time. Neither can it be suspected that laboratories have missed to give their results for the volumes asked for, namely 100 ml in all analyses except for culturable microorganisms where 1 ml is appropriate.
Z-values listed in Annex B are the base for the box plots but they are not commented or evaluated. They can be used by laboratories in their follow-up process.
Description of the result processing and recommendations on follow-up work are given in the scheme protocol (3). A PDF file of that document is available on the website www.slv.se/absint.