2017; 3(2): 119-126
Published by the Scandinavian Society for Person-Oriented Research Freely available at http://www.person-research.org
DOI: 10.17505/jpor.2017.10
119
The interpretation of single individuals’ measurements
1Lars R. Bergman
Stockholm University, Stockholm
Address Correspondence to: Lars R. Bergman, Department of Psychology, Stockholm University, 106 91 Stockholm, Sweden
Email address:
lrb@psychology.su.se
To cite this article:
Bergman, L. R. (2017). The interpretation of single individuals’ measurements. Journal for Person-Oriented Research, 3(2), 119-126. DOI: 10.17505/jpor.2017.10
1The article is partly based on Bergman (2010). The interpretation of single observational units´ measurements. In M. Carlsson, H. Nyquist, and M. Villani (Eds.). Official statistics: Methodology and applications in honour of Daniel Thorburn, Chapter 4, 37-49. Stockholm: Stockholm University, Department of Statistics. The chapter has been revised and some new material added to make the contents of the article more relevant to psychologists.
Abstract
This article concerns the interpretation and construction of measurements for single observational units, including the crea-tion of scales or indexes to improve the quality of the measurements. The focus is on the individual as the observacrea-tional unit in psychology, but to present a broader perspective related measurement issues in official statistics are also discussed. It is concluded that when individual measurements are to be interpreted, measurement precision must be given priority and taken into account in the research design. Unfortunately, most measures in psychology are not highly reliable, and examples are given demonstrating that such measures do not normally allow the researcher to make inferences about single individuals. Methods for testing questionnaires in a cognitive laboratory that have been developed within survey research can provide useful tools to increase both reliability and validity of single questions/items.
Keywords:
Measurement, individual, treatment, psychometrics
Measurement issues are of crucial importance in almost any area of psychology and also in other disciplines where measurements are used. In this article, the construction and interpretation of single observational units´ measurements are discussed. In psychology, this issue is especially im-portant when the individual is the observational unit of interest, for instance when a person-oriented approach is applied (Bergman & Magnusson, 1997). However, also in areas far removed from psychology, the task of optimally measuring single observational units can be quite important, whether these units are individuals or something else (e.g., geographical regions or companies). There is a degree of universality of such measurement considerations that makes them relevant also for psychologists. Therefore, this article takes its starting point from outside psychology, namely from the creation and interpretation of single observational units’ measurements in statistics, especially
official statistics. Against this background, the focus is then shifted to measurement issues in psychology that arise when a study involves the interpretation of single individu-als’ measurements.
In official statistics, the focus is often on the estimation of population parameters from data for a sample. For in-stance, the estimated percentages with “very good” self-reported health in different strata of the Swedish popu-lation are reported, based on the sampled individuals’ answers to the single question “How do you rate your gen-eral health?” (a response scale 1 – 5 is then often used where “1” is labeled “very good”; this question appears in many sociological and epidemiological studies; see, for example, Socialstyrelsen, 2004). Much research has been done to develop sampling designs and estimation methods and also to handle the effects of measurement errors of dif-ferent kinds. The interpretation of single units’
measure-120 ments is then normally not of primary interest. Sometimes in official statistics also another type of information aggre-gation is done where indexes are formed of several single questions or items which, taken separately, are not of pri-mary interest. For instance, an indicator of global subjec-tive well-being (SWB) is formed by summing the answers to the five items included in the Diener scale (Diener, 1994) and a number of countries are compared with regard to their average level of SWB.
The presentation will be restricted to the case where the individual is the unit of analysis and the article is divided into two main sections: (1) interpreting measurements for single individuals and (2) using individual measurements based on single variable information as contrasted to using measurements based on pooled information from many single variables (scales, indices).
Interpreting measurements for single
individuals
When data from statistical surveys are analyzed, the focus can sometimes be on measurements of one or a few individuals. For instance, coming back to the SWB example, one might want to do a detailed study of those reporting an exceptionally low level of global SWB and attempt to find associated individual factors (e.g., living conditions, life events, and so on). Or take an example from psychology: A clinical psychologist wants to make infer-ences about a patient’s level of alcohol problems based on the answers to the AUDIT instrument (Saunders, Aasland, Babor, de la Funte, & Grant, 1993). In both these examples, it is intuitively obvious that the reliability of the measure-ments needs to be higher than if the same measuremeasure-ments were used together with many other measurements for producing group statistics (e.g., to compute means for the whole sample, which would have a standard error much smaller than the individual error).
The individual is usually the unit of analysis in psycho- logy and measurements can be of many different types (e.g., test scores, psychophysical ratings, excretion of stress hormones, attitude ratings, and scores on personality tests). For the present purpose, only measurements obtained by self-reports will be considered, assumed to be approxi-mately interval scaled. They can be either used directly in their “raw form” to form variables in the study or they can be used for constructing a scale or an index. Usually, seve- ral items are used to build a scale. However, almost always errors of measurement are present and to take them into consideration some model of the errors is necessary.
The classical test theoretical model (CTTM) is a basic measurement model that is often used in psychology. In this model it is assumed that the obtained score is the sum of a true score and a normally distributed random error with an expected value of zero (Lord & Novick, 1968; for an example of using CTTM for test construction, see Sundström, 2008). In CTTM, the reliability of a measure
obtained for a sample is defined as the ratio between the true score variance and the observed variance, and methods exist for estimating the reliability (e.g., by computing a test-retest correlation). Of course, more sophisticated measurement models are increasingly used (e.g., item re-sponse theory models, see Baker & Kim, 2004) but CTTM will suffice for the purpose of discussing the interpretation of individual measurements.
In psychology, the focus is most often on summary sta-tistics, like mean differences between groups, correlations between variables, linear models and so on, and sometimes on making inferences to a population (although most fre-quently the samples are not random and sampling design is not much considered). A focus on interpreting single indi-viduals´ measurements is perhaps most common in the context of diagnosis in clinical psychology and in educa-tional/vocational selection and guidance. Obviously, it is then important to have a high degree of measurement pre-cision (i.e., a high reliability) to be able to interpret an vidual’s measurement and make a decision about that indi-vidual. Assuming CTTM, a confidence interval containing the individual´s true score can be constructed and, broadly speaking, the reliability has to be high for the measurement to be useful for that purpose (above 0.80). Precise measurements can be obtained for some measures (e.g., a comprehensive IQ test) but this is not the case for most measures used in psychology, for which the reliabilities often are in the range 0.70 - 0.80.
Within many fields of psychology, only moderately reliable measurements can be sufficient. This presumption may be justified if the scientific question can be answered by analyses producing group statistics or by a model of the data that holds for all individuals in the sample. Many statistical models (structural equation models, latent growth curve models, etc.) can also handle certain types of errors. However, when the focus is on interpreting single indi- viduals´ scores the situation is different, as was indicated above. The number of research fields in psychology where this individual focus is central is also increasing. In fact, at least three newer directions in psychology have evolved that emphasize the need for interpreting single individuals’ scores, and consequently demand that the measurements are highly reliable. They concern (1) the study of the single individual using statistical methods, (2) the study of average versus individual causality, and (3) the person-oriented approach for studying individual
develop-ment.
It is hazardous to make inferences about
indi-vidual development from group statistics
The first direction presented here concerns the renewed interest in studying the single individual´s development with statistical methods. It has led to an increased recogni-tion that only under strong assumprecogni-tions can inferences be made about individual development from standard group
121 statistics, calculated for samples of individuals. The studied process must then be assumed to be ergodic (Molenaar, 2004). Molenaar instead proposed a bottom-up approach where first a separate model is built for each individual, using data from many time points, and then the individual models are generalized. Of course, it is not a new thought that the individual is “lost in the statistics”, being forcefully pointed out many decades ago by, for instance, Cairns (1986), Carlson (1971), and Magnusson (1985).
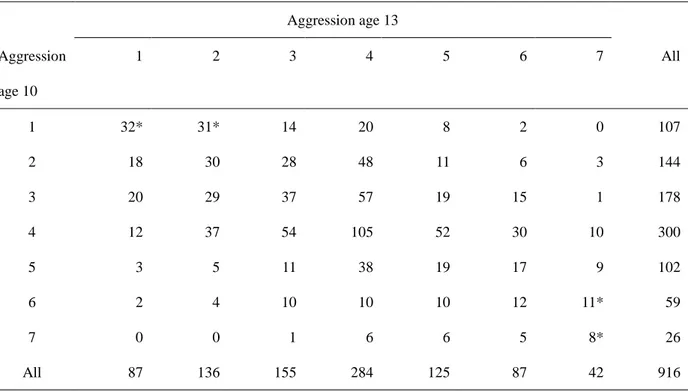
Consider now the simple example presented in Table 1 where longitudinal information is presented about teachers´ ratings of aggression from age 10 and 13 for a sample of 916 children. These 7-graded ratings are highly reliable and range from “1”, indicating very low aggression, to “7”, indicating very high aggression. The data were taken from the longitudinal research program Individual Development and adaptation (IDA; Magnusson, 1988).
Table 1. Cross-tabulation of aggression scores at age 10 and age 13 for 916 children.
Aggression age 13 Aggression age 10 1 2 3 4 5 6 7 All 1 32* 31* 14 20 8 2 0 107 2 18 30 28 48 11 6 3 144 3 20 29 37 57 19 15 1 178 4 12 37 54 105 52 30 10 300 5 3 5 11 38 19 17 9 102 6 2 4 10 10 10 12 11* 59 7 0 0 1 6 6 5 8* 26 All 87 136 155 284 125 87 42 916
Note. The ratings can be assumed to be highly reliable. Chi-square (36) = 245.3, p<0.001
*p<.05 when using adjusted standardized residuals to test for an over frequented cell after Bonferroni correction for 49 tests. Expected values of the four significant cells are 10.2, 15.9, 2.7, and 1.2, respectively.
The Pearson correlation is 0.43 between the age 10 and age 13 aggression ratings. Although researchers are aware of that this is a summary statement of the relationship, nev-ertheless it is quite common to almost solely rely on the correlation coefficient when interpreting the relationship, often stating something like, “There is a moderate stability of aggression in that high aggression at age 10 tends to go together with high aggression at age 13 and vice versa”. This interpretation may be adequate but that depends on the purpose. If it is to understand individual development, just a brief inspection of Table 1 shows that, for a substantial proportion of the sample, the statement above does not hold. For instance, for 11% of the children an above average rat-ing at age 10 is combined with a below average ratrat-ing at age 13, or vice versa; an additional 19% of the sample change their level of aggression from low (1 or 2) to
aver-age or from high (6, 7) to averaver-age, or vice versa; and only 27% of the children are completely stable.
Coming closer to the individual level, some interesting observations can be made from the cross-tabulation in Ta-ble 1. For instance, the strongest stabilities are in the ex-tremes, especially 1>1 and 7>7, and dramatic shifts in ag-gression are very rare. As an example, it may be of special interest to further study the two children whose ratings in-creased from 1 to 6. Their changes are very unlikely to have been caused by errors of measurement because the ratings are highly reliable. What happened in their families and school situation to produce this dramatic deterioration? First it was looked at standard demographical variables, like a change in the basic family composition, especially divorce, but there were no changes for the two children. Then it was looked at other school variables, like self and
122 peer rated popularity and school grades, still no pronounced changes. Finally, it was looked for if a hyperactivity syn-drome had emerged. This was the case because both chil-dren were at age 10 absolutely not hyperactive but at age 10 clearly were so. (Of course, this finding for n=2 is only hypothesis generating.)
To sum up, the findings from analyzing the aggression data exemplifies Molenar’s (2004) point that it is dangerous to rely on group statistics when the purpose is to make in-ferences about individual development. This is warranted only under special conditions.
Average versus individual causality
The second direction towards studying the individual concerns the issue of average versus individual causality. We are all aware of the difficulties in establishing causality in nonexperimental settings and also of the complexity of the causality concept in this case. Nevertheless, it seems reasonable to believe that a careful analysis of good non-experimental longitudinal data can make possible infer-ences about average causality. However, inferinfer-ences about
individual causality are another matter and tend to be much
more difficult, also in an experimental situation (Bergman, 2009). This is illustrated by the example given below.
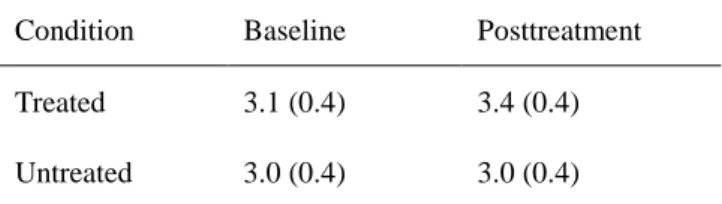
In a study of the effects of relaxation therapy for insom-nia, Means, Lichstein, Epperson, and Johnson (2000) ran-domly assigned 28 college students with insomnia to treat-ment with the remaining 27 students with insomnia forming the control group. Based on diaries kept by the subjects, the self-rated quality of sleep (QUAL) was measured before and after treatment on a scale from 1 to 5, where “5” is “excellent”. The average quality of sleep (sd) was reported as seen in Table 2.
Table 2. Comparison between means (SD) in self-rated
quality of sleep before and after treatment in the study by Means et al. (2000)
Condition Baseline Posttreatment
Treated 3.1 (0.4) 3.4 (0.4)
Untreated 3.0 (0.4) 3.0 (0.4)
The findings were analyzed using MANOVA (the ex-cerpt of results presented here is only a small part of what was analyzed) and the authors drew the conclusion that there was a significant effect of the treatment on QUAL. Their findings indicate that the effect size was close to one sd unit for QUAL among those with sleeping problems and they may have demonstrated average causality. But what about individual causality? Almost no information was given in the article that helps in forming an opinion of how many (and which) of the treated students that profited from the therapy and the issue is not discussed by the authors. No reliability estimate was provided for QUAL but a
liter-ature search suggests that the reliability of sleep diary data is usually intermediate, that is, in the 0.60 - 0.80 range. The moderate reliability makes it understandable that the au-thors, like in most therapy studies, restricted themselves to the issue of average causality. Using CTTM, a rough cal-culation of a 95% confidence interval for a person´s QUAL score indicates that it would be around ± 0.4, which is even somewhat larger than the average difference between base-line and posttreatment. This suggests that for most subjects the individual treatment effect (i.e., the change from base-line to posttreatment) cannot be well estimated (see Feldt, Steffen, & Gupta, 1985; Lord & Novick, 1968 for a discus-sion of different estimation methods). This is unfortunate because with precise measurements of QUAL and the other dependent variables in the study it would have been possi-ble to find those who did not profit from the therapy and obtain ideas about why this was the case and suggestions for how to improve the therapy.
There have been many studies of individual treatment effects but, in my opinion, they have usually been marred by a lack of reliability in the individual scores. For instance, in the seventies, Cronbach and Snow studied what they called aptitude-treatment interactions in educational set-tings and, rather discouragingly, they found it hard to estab-lish trustworthy interactions that replicated. Cronbach (1975, p 126), although advocating the importance of the endeavor, talked about “entering a hall of mirrors” pursuing this track. It might be that a major reason for the unclear findings was insufficient measurement reliability.
Methods for studying the reliability of individual treat-ment effects should be used more often, for instance by applying the Jacobson and Truax reliable change index (RCI) formula (Jacobson & Truax, 1991). However, in most cases the application of such methods can be expected to confirm what has been said above, namely that for most studied subjects no reliable individual change can be de-tected, unless the reliability of the dependent variable is high or the average treatment effect is very large.
The main conclusion drawn from the above example holds more generally: To study individual causality you normally need precise individual measurements.
The person-oriented approach
The third direction towards studying the individual is the modern person-oriented approach for studying individual development (Bergman & Magnusson, 1997; Bergman, Magnusson & El-Khouri, 2003). In this approach, the focus is on understanding individual development as a dynamic process with bidirectional influences, operating in continu-ous time and at different levels. It is believed that a crucial aspect of the system under study is its state, characterized by patterns of information in the variables that describe the system. Further, it is proposed that, mostly, only a limited number of such patterns exist which are in some way func-tional and therefore become typical. Hence, from this
per-123 spective it is not natural to treat the involved variables as separate entities in theoretical formulations and analyses. One should instead study the value patterns in the variables as undivided wholes and, for instance, search for typical such patterns.
If the person-oriented paradigm is accepted, it is obvious that reliance has to be placed on individual measurements, which must be reliable for the individual value patterns to be interpretable. It is also clear that standard group statistics will not inform about individual pattern development. However, the common reliance on methods for the classi-fication of observed value patterns into a number of classes or types presents in a different form the problem of sum-marizing individual development by group statistics. Only if the classes are homogeneous (all members in the class have similar value patterns) can individual class member-ship inform about individual patterns of development.
Measurements of individuals based on a
single original variable vs. based on a
scale or index
A frequent measurement issue in many sciences, includ-ing psychology, is how to best use the information con-tained in a number of single original variables that aim at measuring the same concept, either because (1) the varia-bles are very similar (e.g., five questions concern the sub-jects´ degree of satisfaction with their working life in gen-eral but they are differently worded) or (2) each single variable covers one aspect of the concept and together they cover the whole concept (e.g., a standardized test in mathe- matics may consist of several subtests, measuring know- ledge of arithmetic, geometry, algebra, and so on). In both cases, the information in the single variables (items) is fre-quently pooled to produce a new variable that summarizes the information contained in the items. The pooling can be done in different ways, for instance the values in the single variables (items) can be summed or subjected to factor analysis to produce a factor. This type of variable is labeled in different ways (e.g., it is called “a scale”, “a factor”, or “an index”). In Case (1), a primary reason for constructing a scale is to increase the reliability of the measurement and in Case (2) a primary reason for constructing the scale is to ensure that the scale covers all relevant aspects of the con-cept. Scales of these types are often used in the social sci-ences, especially in psychology where methods have been developed for item selection to scales and for weighing the included items. These methods include, for instance, factor analysis, item analysis using classical test theory or item response theory, and methods for studying differential item functioning. Much work has also been done on a more the-oretical level, for instance discussing issues of validation and scale level. This psychometric tradition has developed mostly independent of the corresponding work done within statistics and econometrics, and there the term “index” is often used for what in psychology would be called a
“scale” or a “factor”.
The use of scales is much more widespread in psycho- logy than in official statistics where more commonly results concerning single original variables are reported, as exem-plified in the introduction. This is natural because of the different character of the variables with “hard” variables being more common in official statistics but it is also caused by differences between these two disciplines in purposes and types of analysis. It is interesting to note that in psychology a single item is usually considered too unre-liable to form an independent or dependent variable in the analyses and most often psychometric methods are used to arrive at a scale. In official statistics you more frequently find published results reporting findings concerning single items, even in the case of “soft” variables. For instance, on the Swedish home page for the Swedish Survey of Living Conditions (SSLC) in November 2009, the only findings that were presented concerned the frequency and intensity of exercise, reported separately for a number of items measuring different types of exercise.
Behind the use of a question formulation and its response alternatives there is always some assumed model of the relationship between the concept of interest and the indica-tor used to measure it, which is given by the question used. In the above SSLC example, one question was formulated as follows: “I would now like to know how much exercise you get in your spare time. Which one of these response alternatives fits you best?” (my translation). There were five response alternatives with the lowest level of exercise being labeled “Get almost no exercise at all” and the high-est level of exercise labeled “Exercise regularly rather in-tensively at least two times a week”. The concept of interest might for many users be something like “the amount of exercise of a type that tends to increase aerobic physical fitness”. If this concept is treated as a latent variable (de-noted with F) and the indicator, based on the responses to the question is denoted with f, two conclusions are apparent: (1) There are many possible f:s that could be used to measure F and (2) the assumptions one can make about the relationship between f and F decide how findings based on f can be interpreted and how f can be used in the analyses. Consider the following three assumptions of the relation-ship between f and F:
1. f = F + e, where e is a random error, same function assumed for all individuals.
2. f = aF + b + e, where a and b are constants, same function assumed for all individuals.
3. f = aiF + bi + ei, where the subscript indicates indi-vidual i.
It is obvious that Assumption 1 is very strong and not likely to hold for the exercise example. This conclusion holds in most contexts. To give another example: For many decades, surveys have been carried out concerning the
124 Swedish population´s attitude for or against nuclear power and, within a given time period, the percentage reported to be positive to nuclear power varied substantially according to the institute that performed the survey due to minor dif-ferences in the formulation of the question and of the re-sponse alternatives (see e.g., Holmberg & Pettersson, 1980; Johansson, 2002).
Assumption 2 is less stringent and it can be sufficient for making comparisons between groups and time periods, which often is the primary purpose. (If only the relaxed Assumption 3 is made you have to consider individual dif-ferences in the response functions that easily get confused with random errors and the interpretation of the findings become complex; Saris & Gallhofer, 2007).
The line of reasoning presented above is simplified but it serves to illustrate that the assumptions you can make about the form of the relationship between the indicator and the concept should decide how the findings are interpreted and what analyses are appropriate. Of course, considerations of the model for the indicator-concept relationship could be disregarded and the researcher could instead just carefully present what has been measured, leaving such considera-tions entirely to the consumer of the report. However, if the measurement properties of the indicator have not been carefully discussed in the report (e.g., in relation to other possible indicators) the consumer often has difficulties in interpreting the findings. In the SSLC example, such con-siderations were not presented in the report the home page was linked to.
As pointed out above, in most cases within psychology where a concept is to be captured by measurements, psy-chometric methods are used to develop a scale based on the responses to many items. This is done to increase the relia-bility but also to extract the common core of them in the form of a scale by triangulation of the information in the items. However, for both good and bad reasons, there seems to be a certain reluctance within official statistics to rely on psychometrically constructed scales. Although the standard psychometric approach in many contexts is sound, it has often led to that in psychology comparatively less emphasis is given to a thorough analysis of the information contents of the single item isolated from the information contents of the other items. This is in contrast to what is the case within, for instance, good survey research practice. There single questions are often carefully tested, for in-stance using cognitive laboratory procedures (see e.g., Bergman, 1994 for an overview). Such a test is usually highly informative and leads to an improved questionnaire where a number of “bad” questions have been weeded out or reformulated to remove ambiguities in wordings, and the test increases the chances that the concepts targeted by the questionnaire designer match the way the respondents in-terpret the questions.
Discussion
In some fields of psychology, it is essential that single individuals’ measurements can be interpreted so that infer-ences can be made about, for instance, individual develop-ment. This is in contrast to official statistics where the focus rarely is on interpreting single units’ measurements but rather on providing estimates of population parameters like percentages in different categories, means or correla-tions. These are the dominant forms of statistical reporting. Nevertheless, the importance of paying more attention to single units’ measurements also in official statistics may be underestimated, see Bergman (2010).
It has been argued that to obtain findings interpretable at the individual level, precise measurements are necessary. In contrast, when the focus is on interpretation at a group level, presenting findings in the form of group statistics are usually sufficient. In this case, statistical models can under certain assumptions handle substantial errors of measure-ment in the studied variables; errors that would make such variables unusable for studying the individual. In fact, most variables in current use in psychology are not sufficiently reliable to allow for the study of the individual, as exempli-fied in this article. To provide a view from outside psy-chology of the importance of precise measurements, Bergman and Vargha (2013) presented the following simile, taken from astronomy:
Some 500 years ago a good model emerged of the or-bits of the planets in our solar system, explaining the movements in time of each single planet. The data used to develop this model were precise measure-ments of different kinds. Suppose these data had con-tained errors of measurement of the size we common-ly have in psychology. Then a crude estimation of the standard error of measurement of a planet´s distance to the sun in AU units is of the magnitude 3 AU (cor-responding to a reliability of about 0.90). In this case the relative distances of the four inner planets to the sun would be completely blurred since their distances range from 0.4 AU to 1.5 AU. It is then highly unlike-ly that the modern model of the orbits would have emerged.
Admittedly, the cited simile is somewhat halting but it provides an additional example of the quagmire a research-er encountresearch-ers if he/she tries to construct a model explaining single observational units´ behavior using unprecise measurements.
In many types of statistical analyses, the handling of out-liers is problematic. Are they valid values or have they been caused by errors of measurement? The answer to this ques-tion can be important for deciding whether an outlier should be included or excluded from an analysis. Precise individual measurements are helpful in this decision pro-cess.
125 Measurement issues cross discipline borders and are to a fair degree almost universal. Hence, measurement tech-nique research should also sometimes be multi-disciplinary, including collaboration between, for instance, psychome-tricians, statisticians, economepsychome-tricians, cognitive scientists, and chemotricians. In addition to probable synergy effects, this would also lead to an exchange of valuable measure-ment techniques between disciplines. For instance, it was pointed out that psychometricians might find useful the cognitive laboratory methods for testing questions that have been developed in survey research. Within that field, methods have also been developed for testing question formulations by the use of split-ballot experiments that could be used more in psychology (Shuman & Presser, 1981). From a Swedish viewpoint, it is interesting to note that there is a research unit at the Department of Applied Educational Science, Umeå University that specializes in methods for educational measurement and that can serve as a clearing house for related measurement issues in the be-havioral sciences.
To sum up, in contexts where individual measurements are to be interpreted, high measurement precision must be given priority and taken into account in the research design. Of course, this comes at a price. Most standard measures in psychology are not very reliable and new measures with high reliabilities may be quite difficult to construct. It might lead to that only a reduced number of variables can be included and a smaller sample size studied than would have been feasible if only group analyses were the purpose. It is also a scientific loss if the researcher cannot use estab-lished instruments for which a body of research findings already exists. Nevertheless, increasing measurement pre-cision deserves to be given a higher priority than is the case today.
References
Baker, F. B. & Kim, S. H. (2004). Item response theory:
Parameter estimation techniques. New York: Marcel
Dekker.
Bergman, L. R. (1994). Pretesting procedures at Statistics Sweden’s measurement, evaluation, and development laboratory. Journal of Official Statistics, Vol 11. No. 3, 309-323.
Bergman, L. R. (2009). Mediation and causality at the indi-vidual level. Integrative Psychological Behavior, 43, 248-252.
Bergman, L. R. (2010). The interpretation of single obser-vational units’ measurements. In M. Carlsson, H. Nyquist, and M. Villani (Eds.). Official statistics: Methodology
and applications in honour of Daniel Thorburn, Chapter
4, 37-49. Stockholm: Stockholm University, Department of Statistics.
Bergman, L. R. & Magnusson, D. (1997). A person- oriented approach in research on developmental psycho-pathology. Development and Psychopathology, 9,
291-319.
Bergman, L.R., Magnusson, D., & El-Khouri, B.M. (2003).
Studying individual development in an interindividual context: A person-oriented approach. Vol. 4 in the series
Paths through life (D. Magnusson, Ed.). Mahwah, NJ: Erlbaum.
Bergman, L. R. & Vargha, A. (2013). Matching method to problem: A developmental Science perspective.
Europe-an Journal of Developmental Psychology, 10 (1), 9-28.
Cairns, R. B. (1986). Phenomena lost: Issues in the study of development. In J. Valsiner (Ed.), The individual subject
and scientific psychology (pp. 79-112). New York, NY:
Plenum Press.
Carlson, R. (1971). Where is the person in personality re-search? Psychological Bulletin, 5, 203-219.
Cronbach, L. (1975). Beyond the two disciplines of scien-tific psychology. American Psychologist, 30, No. 2, 116-127.
Department of Educational Measurement (2009). Presenta-tion on home page. http://www8.umu.se/edmeas/presen- tation/index_eng.html
Diener, E. (1994). Assessing subjective well-being: Pro-gress and opportunities. Social Indicators Research, 31, 103-157.
Feldt, L. S., Steffen, M., Gupta, N. C. (1985). A comparison of five methods for estimating the standard error of measurement at specific score levels. Applied
Psycho-logical Measurement, 9, No. 4, 351-361.
Holmberg, S. & Pettersson, O. (1980). Within the margin of
error: A book about surveys of political attitudes. / Inom felmarginalen. En bok om politiska opinionsundersök-ningar. / Stockholm: Publica.
Jacobson, N. S. & Truax, P. (1991). Clinical significance: a statistical approach to defining meaningful change in psychotherapy research. Journal of Consulting and
Clinical Psychology, 59, 12-19.
Johansson, F. (2002). Attitudes to nuclear power – different
ways to measure. /Kärnkraftsattityder – Olika sätt att mäta./. Statsvetenskapliga institutionen, Göteborgs
uni-versitet.
Lord & Novick (1968). Statistical Theories of Mental Test
Scores, p. 66-68. Reading Massachusetts:
Addi-son-Wesley.
Magnusson, D. (1985). Implications of an interactional paradigm for research on human development.
Interna-tional Journal of Behavioral Development, 8, 115-137.
Magnusson. D. (1988). Individual development from an
interactional perspective. Hillsdale, NJ: Erlbaum.
Means, M. K., Lichstein, K. L., Epperson, M. T., & John-son, T. (2000). Relaxation therapy for insomnia: night- time and day time effects. Behaviour Research and
Therapy, 38, 665-678.
Molenaar, P.C.M. (2004). A manifesto on Psychology as idiographic science: Bringing the person back to scien-tific psychology, this time forever. Measurement, 2 (4), 201-218.
126 Schuman, H. & Presser, S. (1981). Questions and answers
in attitude surveys. New York: Academic Press.
Saris, W.E. and Gallhofer, I. N. (2007). Design, evaluation,
and analysis of questionnaires for survey research. Wiley:
Hobroken, NJ.
Socialstyrelsen (2004). The living conditions of the elderly
1988-2002 / Äldres levnadsförhållanden 1988-2002/.
Socialstyrelsen 2004-123-23.
Saunders, J. B., Aasland, O. G., Babor, T. F., de la Funte, J. R., & Grant, M. (1993). Development of the Alcohol Use Disorders Identification Test (AUDIT): WHO Collabora-tive project on early detection of persons with harmful alcohol consumption-II. Addiction, 88, 791-804
Sundström, A. (2008). Construct validation and psycho-metric evaluation of the self-efficacy scale for driver competence. European Journal of Psychological Assess-
ment. Vol. 24, 3, 198-206.
von Eye, A. & Bergman, L. R. (2003). Research strategies in developmental psychopathology: Dimensional identity and the person-oriented approach. Development and