EE 1382
ANALYSIS OF THE PERFORMANCE OF THE CYCLONE CLASSIFIERS AT THE CLIMAX MINE
scuES
Goi.rif-v ^ ‘U ° L °r Mines
■ COl-OEADo
by
ProQuest N um ber: 10781084
All rights reserved
INFORMATION TO ALL USERS
The qu ality of this repro d u ctio n is d e p e n d e n t upon the q u ality of the copy subm itted.
In the unlikely e v e n t that the a u th o r did not send a c o m p le te m anuscript and there are missing pages, these will be note d . Also, if m aterial had to be rem oved,
a n o te will in d ica te the deletion.
uest
ProQuest 10781084Published by ProQuest LLC(2018). C op yrig ht of the Dissertation is held by the Author.
All rights reserved.
This work is protected against unauthorized copying under Title 17, United States C o d e M icroform Edition © ProQuest LLC.
ProQuest LLC.
789 East Eisenhower Parkway P.O. Box 1346
EE 1382
An Engineering Report submitted to the Faculty and the Board of Trustees of the Colorado School of Mines in partial fulfilment of the requirements for the degree of Master of Engineering. Signed: c A J . A . C . Prabhakar Golden, Colorado Date; JZ f r 1971 ^ t e r m m l a k^ Jrn COLO M ^ 1,m Approved:. W.R. Bull Report Advisor Golden, Colorado Pats; J W t o c
,Z?
1971 Paul G. Herold Head of Department Metallurgical Engineeringii
ABSTRACT
The tailings from the molybdenite flotation section of the ore treatment plant at the Cimax mine contains eco nomic quantities of wolframite, particularly in the finer size fractions; these tailings are classified by hydrocyclo -nes, with the objective of recovering as much wolframite as possible in the fine product. The performance of the hydrocyclones was investigated by analyzing the results of numerous tests. Empirical performance equations were developed, some of which agreed well with existing equations developed elsewhere* The 15-inch diameter cyclones were found to be superior to 10-inch for the required duty, and the maximum recovery was found to be about 1+0% in about 50%
ER 1382
TABLE OF CONTENTS
Page
ABSTRACT... iii
LIST OF FIGURES ... vii *
LIST OF TABLES ... ix
ACKNOWLEDGEMENTS... ... '... x
INTRODUCTION... 1
Statement of the problem...* 2
Solution of the problem... 2
SURVEY OF LITERATURE... k Design of the cyclone... 4
The movement of fluid elements and solid particles within the cyclones •••••••••••... k Operating variables of cyclone. ... «..•••••••••• 13
The assessment of classification of operation... Ik The cyclone throughput. ... 13
Water distribution in the cyclone... 16
The actual performance curve... 16
The corrected efficiency curve.. 16
The d^Q (corrected) value ... 19
The reduced efficiency curve... 19
EQUIPMENT AND SAMPLING PROCEDURE... 23
Equipment... ••••23
Type of feed... 23
Sampling procedure•••••... ••••••••••.•••••.••.29
EH 1382
Page
Analysis of samples # ... •..•^••31
Data acquisition. ... ...32
EXPERIMENTAL RESULTS OF 15-INCH CYCLONE... 3k The operational characteristics of cyclone... .35
The capacity of the cyclone... ••••••••.. 35
The distribution of v/ater in the cyclone... kO The solids separation characteristics of the cyclone The assessment of classification operation... 1^0 The effect of variables on the corrected d j q value... .48
Defining the reduced efficiency curve 30
The weight and WO^ distributions in the cyclone... 30
EXPERIMENTAL RESULTS OF 10-INCH CYCLONE...33
The capacity of the cyclone... 35
The v/ater distributions in the cyclone... ••••• 36
The corrected efficiency curves... 36
The reduced efficiency curve... ... 39
The solids and WO^ distributions... 39
DISCUSSION... 67
Equations of the 13“inch cyclone... . 67
Equations of the 10-inch cyclone... ••••••••• 75
Solids and WO* separation in the 13“ and 10-inch cyclones ... 75
CONCLUSIONS... . 79
APPENDICES... 82
APPENDIX A: Program to analyse cyclone performance.. 83
Sample print-out... 88
ER 1382
Page Instructions for using the program... 90
APPEI\TPIX B: Mass flow rates in cyclone feed and
overflow (15-inch cyclone)... 91 APPENDIX C: Mass flow rates in cyclone feed and
overflow (10-inch cyclone)... 92
APPENDIX D: The cyclone throughput equation - actual
and calculated values (15“inch cyclone) 93 APPENDIX E: The water distribution equation - actual
and calculated values (15-inch cyclone) 9k
APPENDIX F: The solids distribution equation - actual
and calculated values (15-inch cyclone)... 93
APPENDIX G: The WO^ distribution equation - actual
and calculated values (15-inch cyclone) 96
APPENDIX H: The cyclone throughput equation - actual
and calculated values (10-inch cyclone)... 97
APPENDIX I: The water distribution equation - actual
and calculated values (10-inch cyclone)... 98
BIBLIOGRAPHY... 81
EE 1382
LIST OF FIGURES
*
Page Figure
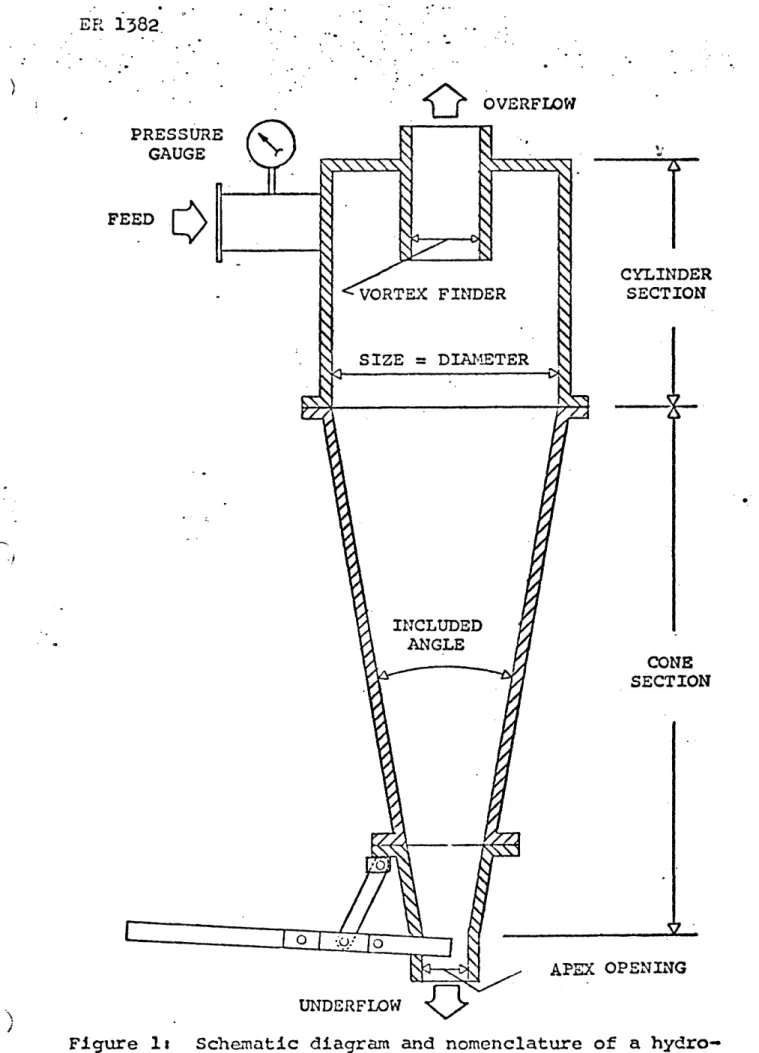
1. Schematic diangram and nomenclature of a hydrocyclone 5
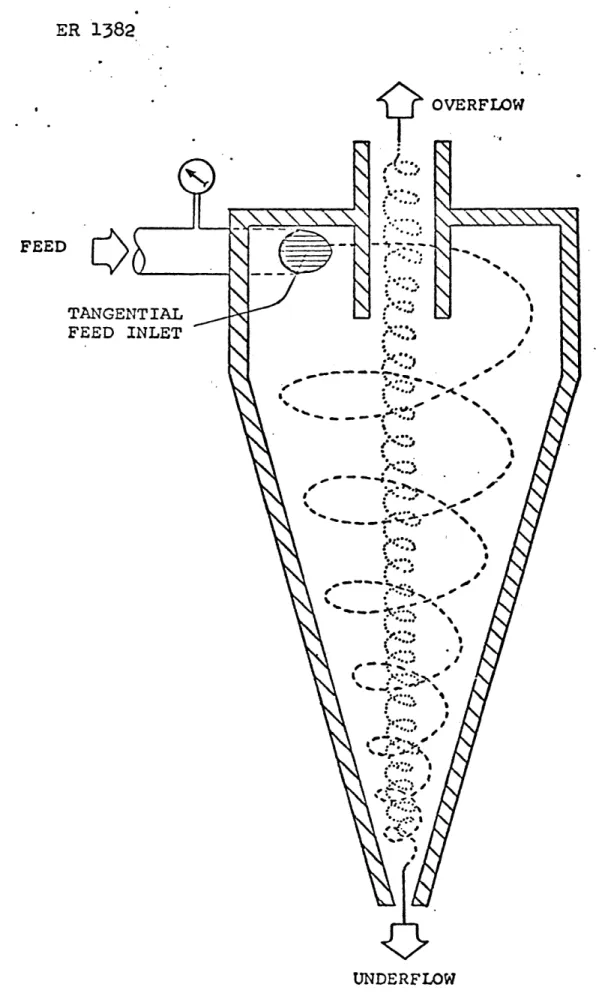
2. The spiral flow pattern in a cyclone.... ... 6
3. (a) Primary flow pattern... ... . 9
(b) Secondary flow pattern... 19
,4-. The performance curves of a cyclone... ... . 18
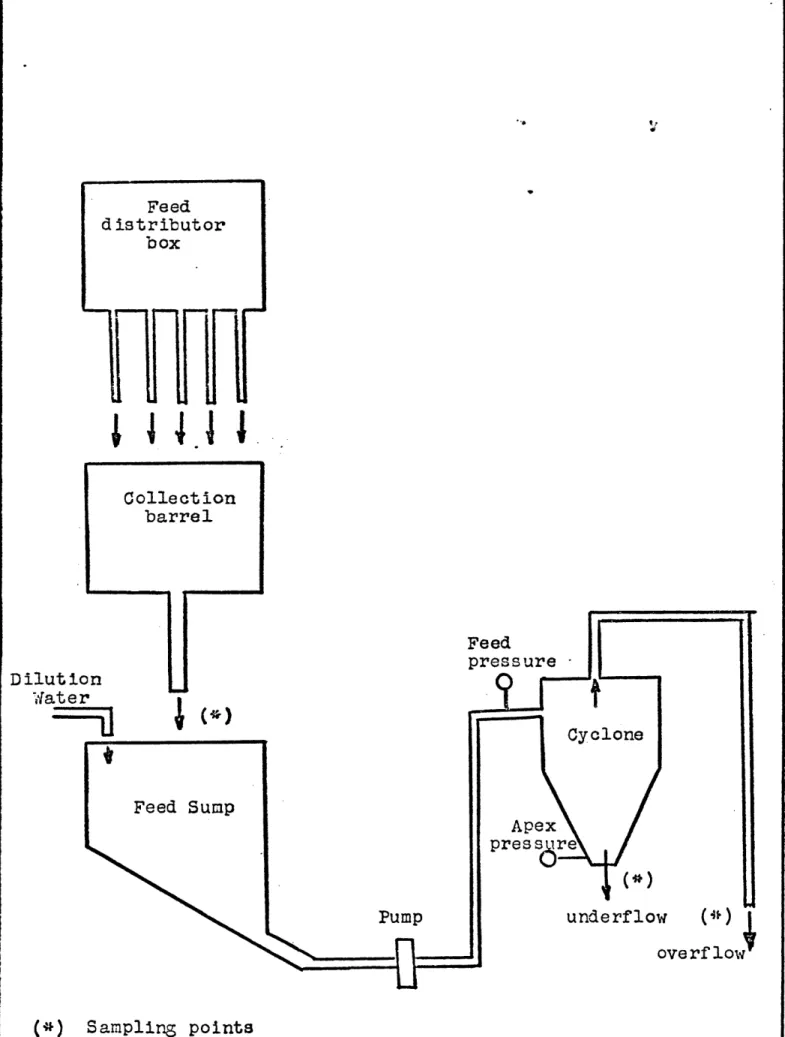
3. The reduced efficiency curve of a cyclone •••••• 21 6. Schematic diagram of the testing set-up... 26
7. Outline of the organization of test work, ... 27
8. Apex opening as a function of applied pressure. 30 9. Cyclone throughput as a function of feed pressure.... 36
10. Cyclone throughput as a function of feed pressure.... 37
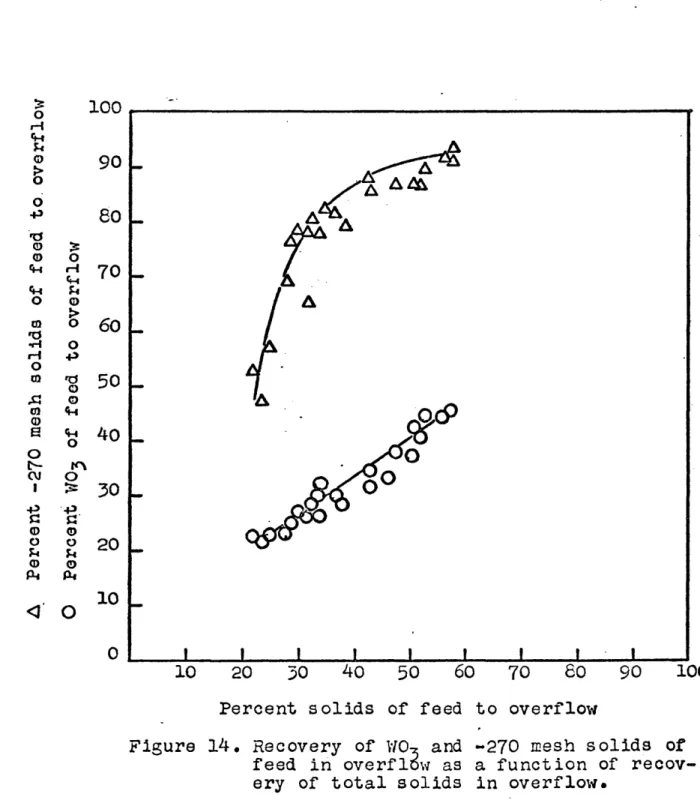
11. Mass flow rate of water in the overflow as a function of mass flow rate of water in the feed... 4-1 12. The corrected efficiency curves for the tests A-7,19, 20, and 27... • • • •... 4-3" 13. The reduced efficiency curve for the tests A-7, 15, 19, 20, and 27... *f9 14-. Recovery of WO^ and -270 mesh solids of feed in the overflow as a function of recovery of total solids in the overflow... 31
13. The cyclone throughput as function of feed pressure.. 57
16. Mass flow rate of v/ater in the overflow as a function of mass flow rate of v/ater in the feed... 58
17. The corrected efficiency curves for the tests B-2, 6, and 16... 60
18. The reduced efficiency curves for the tests B-2, 6, 10, and 16... 61
ER 1382
Figure Page
19. Measured Vs. Calculated cyclone throughput... 68
t« 20. Actual Vs. Calculated v/ater flow rate in the overf low. •••••... 70
21. Actual Vs. Calculated solids flow rate in the overflow... 71
22. Actual Vs, Calculated percent WO^ to overflow... 72
23. Actual Vs. Calculated log d ( c o r r e c t e d ) ...
23. (a) Actual Vs. Calculated d^Q (corrected)...
ER 1382
LIST OF TABLES
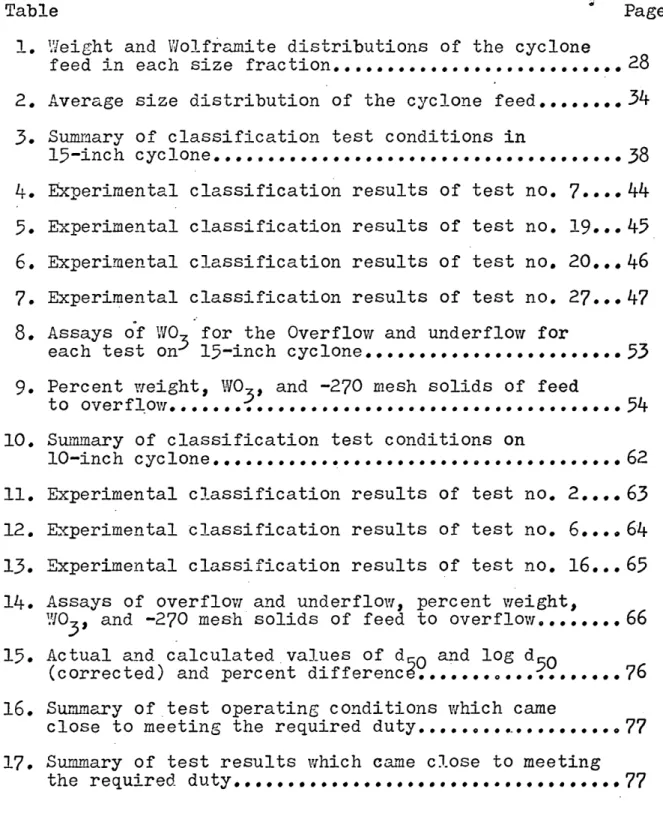
Table * Page
1. Weight and Wolframite distributions of the cyclone
feed in each size fraction ... 28
2. Average size distribution of the cyclone feed... 34-3. Summary of classification test conditions in
15“inch cyclone... .38
4-. Experimental classification results of test no. 7....4-4-5. Experimental classification results of test no. 19.# .4-5 6. Experimental classification results of test no. 20... 4-6 7. Experimental classification results of test no. 27... 4-7
8. Assays of WO^ for the Overflow and underflow for
each test on^ 15-inch cyclone... 53 9. Percent weight, WO^, and -270 mesh solids of feed
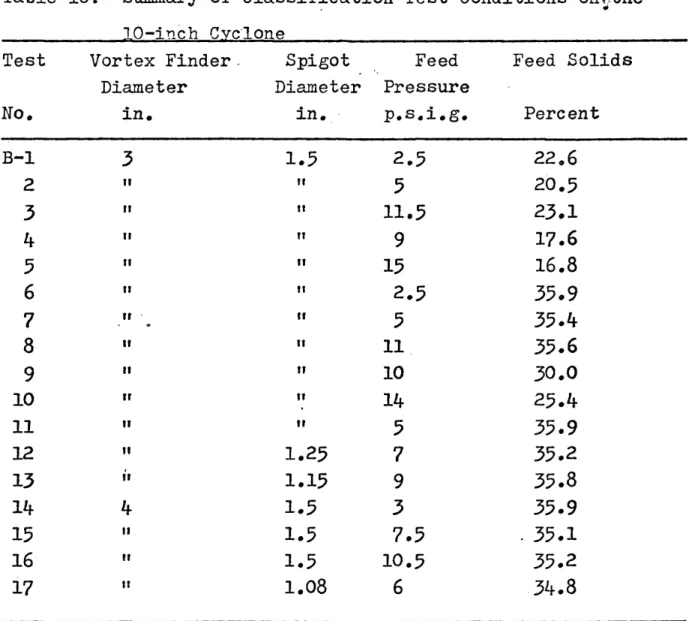
to overflow... ... ...54-10. Summary of classification test conditions on
10-inch cyclone ... 62
11. Experimental classification results of test no. 2..,. 63
12. Experimental classification results of test no. 6.... 64-13. Experimental classification results of test no. 16... 65 14-. Assays of overflow and underflow, percent weight,
Y/0^, and -270 mesh solids of feed to overflow... 66 15. Actual and calculated values of d ™ and log d.,-Q
(corrected) and percent difference...?... 76 16. Summary of test operating conditions which came
close to meeting the required duty ... 77 17. Summary of test results which came close to meeting
ER 1382
ACKNOWLEDGEMENTS
The author wishes to express his sincere gratitude to the following agencies
-To Professor W.R. Bull, Department of Metallurgical
Engineering, Colorado School of Mines, for his invaluable assistance and guidance, throughout the course of this investigation•
To the Climax Molybdenum Company for providing the experi -mental data and also the facility to analyse the data on the computer terminal.
To the Board of World Missions, L.C.A., for providing the financial support and encouragement necessary to carry out this investigation.
EE-1382
1
INTRODUCTION
Hydrocyclones, or cyclones as generally referred to in this report, were introduced to the mineral processing industry by the Dutch State Mines, Limburg, and have since then gained widespread use as size-separating units. In recent years cyclones have almost replaced other classifica tion devices in grinding circuits. The duty of a classifier is to separate particles of various sizes, shapes, and speci fic gravities in a fluid medium, which is usually v/ater in the case of the cyclone. The aim of classification is a predetermined separation of the feed material into a coarse and a fine fraction. The particle size at which the material is divided is known as the separating size. However, classi
fication does not separate the material at some sharply
defined boundary; there is always present in the coarse fraction, some part of the fine fraction and vice versa. The degree of sharpness therefore, depends on the relative amounts of mis placed particles, in each of the classified products.
Cyclones are now widely used in the mineral industry, not because they are necessarily more efficient than their
forerunners, but because they have high capacity, occipy small floor space, have no moving parts and, above all, have low capital, operational and maintenance costs.
ER 1382
2
Statement of the Problem
The feed to the by-product plant at the Climax Molybdenum Company operation at Climax, Colorado (i.e. the rougher flota tion tailing) contains economic quantities of fine wolframite. The ore treatment extension programme required the application of cyclones to classify the by-products feed. The metallur gical design developed by the company required that the
cyclones should achieve the following specified duties:
1. Treat feed size in the range of +35 to -JfOO mesh solids 2. The overflow product should recover 80 percent
or more of the minus 270 mesh solids in the
feed so as to recover as much wolframite (WO^) as possible.
3# The overflow product should recover as much
as 30 percent solids of the feed with negligible amounts of coarse material (i.e. +63 mesh solids) Solution of the Problem
The problem was attacked by running a series of tests
on the 10-inch and 13“inch cyclones and then analyzing the results by means of the computer in order to present the data in the
form of graphs and empirical equations, and to evaluate the parameters of the cyclone that would set guide lines for any future plant operation or test work, .
Before the design problem is discussed in a greater detail, it would be proper to make a brief survey of the literature
ER 1382
on cyclones which would familiarize the reader with a descrip tion and the operational characteristics of the cyclone.
ER 1382
SURVEY OF LITERATURE
Design of the Cvclone
All cyclones, regardless of the application, have the following basic features:
1. A cylindrical section 2. A conical section 3. A feed port
A vortex finder 3. An apex
The usual arrangement of these is indicated in Figure 1. The feed, which is a mixture of solid particles and water,' is introduced tangentially into the upper part of the cylindrical section and becomes subject to the influence of a dual spiral flow pattern as shown in Figure 2. The coarser and heavier particles of the feed follow the outer spiral leading to the apex and are discharged as an underflow product. The finer and lighter particles go to the inner spiral, which leads to the vortex finder, and are discharged as overflow product. The Movement of Fluid Elements and Solid Particles within The Cvclone
The fluid is introduced tangentially to the cylindrical section under pressure, and leaves the cyclone along the
central axis at right angles to the direction of entry. The rotational motion of the feed slurry within the cyclone causes the solid particles to orient themselves along the fluid
ER 1382.
OVERFLOW PRESSURE GAUGE FEED CYLINDER SECTION VORTEX FINDER SIZE INCLUDED ANGLE CONE SECTION APEX OPENING UNDERFLOWFigure li Schematic diagram and nomenclature of a hydro- cyclone#
ER 1382
OVERFLOW FEED TANGENTIAL FEED INLET UNDERFLOWER 1382
stream on the basis of their size and specific gravity. In analysing the fluid phase, it has been found that here are three components of velocity at any point in the cyclone:
1. The tangential velocity component v. 2. The radial velocity component u.
3. The vertical or axial velocity component w.
Much experimental work has been done on measuring these velocity components ^ ^ but, because of experimental diffi culties, a comprehensive hydrodynamic study of the cyclone has not been made. Also, most of the work was conducted under non operating conditions (no underflow or overflow and no solids in the feed) in model cyclones which differed in design from the type illustrated above. However, some generalizations have been drawn, and are summarized below:
(i) Below the bottom of the vortex finder, fluid envelopes of constant tangential velocity exist, which are coaxial with the cyclone.
(ii) The tangential velocity v increases with the decrease in the radius r, up to a certain limit. As the radius is further decreased, the tangential velocity increases with
ER 1328
vrn= Constant
(
1)
From the point of maximum velocity inward, the decrease in velocity is proportional to change in radius, or
vr = Constant
(
2)
(iii) An air column free of any solids, exists at the center, along the vertical axis of the cyclone.
(iv) At parallel levels well below the bottom of the vortex finder, the radial velocity decreases and becomes zero at the air column. (i.e., in the vicinity of the air-water interface)
There are no good data describing the radial velocity
(2 3
)
but some observers v have suggested that u has the following relationship.
Where 0 is the half angle of the cone.
As the radius decreases, u also decreases and becomes zero in regions near the air column. At least to a first approximation, an increase in the total flow rate through a given cyclone will result in a proportional increase in all three velocity components at all points within the
cyclone. The flow patterns are similar for a wide range of flow rates.
The composite fluid flow in a cyclone is poctorially described in Figure 3. It can be observed that there are two kinds of flow:
Primary Flow Pattern
Secondary Flow Pattern
ER 1328
(1) Primary flow, and (2) secondary flow.
The primary flow consists of two spirals as shown in Figure 3(a), the outer spiral consisting of coarser and
heavier particles, leading to the underflow discharge orifice and the inner spiral consisting of finer and lighter
particles, leading to the overflow discharge orifice. The secondary flow, on the other hand, consists mainly of inter mediate size particles concentrating initially in the lower zones of the secondary flow. As the concentration of these particles increases, the upper zones of the secondary flow also form, as-shown in Figure 3(b).
The effect of solids content of the feed of the fluid flow is not known, but it is generally agreed that up to about 20 percent solids the fluid flow is not significantly affected. To what extent solid particles disrupt the
idealized fluid flow patterns and exactly what fluid flow patterns exist above 20 percent solids is not known.
In industry today, cyclones are, most used as size- separating devices. Therefore, the discussion of the move ment of the suspended particles will be based on classifi cation cyclones.
At any point within the cyclone, particles are subjected to two opposing forces.
ER 1328
11
Centrifugal force = XXd^/6 (p - <r-) v^/ (*f) ir
Drag force = 3 XT n u d (if Stokefs (3) law applies)
where,
d = particle diameter
v = tangential velocity of liquid p = particle specific gravity o— = liquid specific gravity
r = radius from cyclone axis n = fluid viscosity
u = radial (inward) velocity
The centrifugal force forces the particles outward and the drag force forces the particles inward because it is a function of the inward radial velocity. This also takes into account the resistance to motion. The gravitational effect can be neglected because the particles are so small as to have very small vertical settling velocities.
The relative amounts of the two opposing forces depend upon values of all the variables in equations (Zf) and (3)«* Hov/ever, under equilibrium conditions, the magnitude of the centrifugal and drag forces are dependant upon the particle diameter (assuming that all the particles have identical specific gravity). For larger particles, the centrifugal forces are dominant and the particles migrate to the cyclone walls. Smaller particles have high drag and low centrifugal momentum and are forced to the center of the cyclone. Thus, this constitutes the mode of separation.
ER 1328
12
A pulp containing the particles with a size distribution is forced under pressure through the inlet port of the cyclone. The particles above a certain diameter move towards the
cyclone walls under the action of the centrifugal force, to a zone of reduced pressure where they flow downwards and are discharged through the apex. The particles with diameter too small to have sufficient centrifugal acceleration to overcome the drag forces migrate towards the vortex in the center of the cyclone, also a region of reduced pressure. Those small particles, therefore, discharge through the
vortex finder, which extends into the cylindrical section to minimize short circuiting of the pulp.
Particles of intermediate size (those with diameters such that the drag and centrifugal forces are nearly equal) are circulated in the lower zone of the secondary flow shown in Figure 3(b). Those particles remain in this zone until displaced by other intermediare-size particles or until they become entrained in either the apex or vortex products. The secondary flow zone effectively becomes a dense medium if there is a high content of intermediate-size particles, and causes some tendency for these particles to report as overflow product. Though the behaviour of solid particles within the cyclone has been studied from a research point of view, it has not been possible to qualify the effect of all these variables with
precision, and the overall performance still can not be predicted from theoretical or semi-theoretical considerations.
ER 1382
Operating Variables of Cvclone
Many data have already been collected in the past which
*
should permit a complete assessment. Despite this, there exists a confusion or difficulty in selecting a cyclone for a given duty and in judging whether or not a cyclone is
working satisfactorily. The cause of this difficulty seems to be the many variables which can influence classification in a cyclone.
The operating variables of the cyclone are as follows: 1. Vortex diameter
2. Apex diameter 3# Feed pressure
k* Feed rate
5. Feed pulp density
6. Specific gravity of feed solids 7. Feed size distributions.
A cyclone may be controlled through a variety of adjust
ments of these variables to meet or approach the requirements of a given separation. The experimental data collected on different size cyclones would ordinarily help the operator to make the right choice of these variables so that, by running a few preliminary tests, he would be guided in establishing the right operating conditions. This would not be, of course, the ideal way of determining the operating conditions.
During the past few years, large amounts of data have been collected and researchers have tried to establish the
ER 1382
parameters that could be calculated from the test data, and which could give a quantitative description of cyclone
classification performance. As a result, a few important
parameters have been evaluated and a mathematical model (3,6,7,8) has already been proposed for industrial size cyclones,
using v/hich is now possible to define and predict the cyclone classification performance, with a certain degree of accuracy.
The Assessment of the Classification Operation
When a continuous size distribution of homogeneous solid particles is introduced with the feed liquid to a
conventional cyclone operating under steady state conditions, a fraction of the liquid together with the faster settling solids is discharged through the apex as underflow product, The remainder of the liquid together with slower settling solids is discharged through the vortex finder as overflow
/ o \
or fine product. Lynch and Rao v proposed a mathematical model of cyclones, as a result of extensive test work
carried out on the 20-inch diameter cyclone at the Mount Isa Mines, Ltd., Mount Isa, Australia. The model consisted of a series of empirical equations which define the operating characteristics of cyclones. The model also incorporated what are known as the "performance and efficiency curves" of
the cyclone. This model presented a method of evaluating the classification performance of the cyclone and relating the operating variables to certain important parameters of
ER 1382
X
the cyclone which are summarized below: 1. The cyclone throughput
’ «i 2. The water distribution in the cyclone
3* The actual size-separation performance curve 4. The corrected efficiency curve
3# The d^Q (corrected) value 6. The reduced efficiency curve.
The Cvclone Throughput
The cyclone throughput, measured in gallons per minute of feed pulp is one of the important parameters giving the volu metric capacity of the cyclone. The maximum capacity of a given cyclone is predetermined depending on the size of the cyclone.
(8)
It has been found experimentally ' 'over a v/ide range of operating conditions that cyclone throughput is a function of the vortex diameter, the feed pressure, and the water
content of the feed, given by,
Q = K 1(P)’5. (V)1'?(PV/FD) ,125 (6) where, Q = Cyclone throughput in gallons per minute
P = Feed pressure in pounds per square inch V = Vortex diameter in inches
PWFD = Percent water in the feed K = Constant
This relationship holds good only if the vortex diameter is appreciably larger than that of the apex, which is a con dition invariably observed in normal use.
ER 1382
The Water Distribution in the Cyclone
The water in the feed pulp is distributed in the cyclone
*
between the overflow and underflow. A linear relationship exists between the water in the feed to the cyclone and the water to the overflow, and for a constant mass flow rate of water in the feed, the mass flow rate of water to the over flow is primarily a function of apex diameter. Lynch and Raov 'found experimentally that,
WOF = 1.1 (WFD) - 10(A) + K2 (7) Where
WOF = Water to the overflow in tons per hour WFD = Water in the feed in tons per hour A = Apex diameter in inches
K2 = A constant
The Actual Performance Curve
The performance of a classification operation may be represented by a performance curve, as shown in Figure 4-, which relates percent of the particles in the feed of a
given size that report to the coarse product to the particle size in microns.
EH 1382
17
The Corrected Efficiency Curve
It has been assumed ^hat ^he soii£ particles which ♦
appear in the underflow consist of two components:
1. A representative proportion of the pulp bypasses the classification process, and goes directly to the coarse
/
product or underflow. This proportion is assumed to be equal to the ratio of the water flow rate in the total underflow to the total water in the feed. There is little physical evidence to support this assumption, but it has led to the formulation of an empirical model that is useful in practice, as will be seen.
2. The particles which report to the underflow as a result of classification.
When the amount of feed solids that bypass to the
underflow in each size fraction is deducted from the actual underflow solids in each size fraction, the amount of solids which report to the underflow as a result of classification is obtained.
0 0 1 S R H Q 2 •H > © u O O in in © rH © O O © tSJ ■H © © r-i O •H +3 aj A* o o o o o o o o o o \ 3 0 c ^ v o i n - i t f ^ a i H MoxjJ9pun oq. ^
18
F i g u r e 4* T h e p e r f o r m a n c e c u r v e s of a cy cl o n eER 1382
The corrected efficiency curve as represented in Figure is plotted on the same basis as the actual
rer-'J '
formance curve, but taking into account only those particles in the underflow that appear there as a result of the classi fication process and only those particles in the feed that undergo classification, i.e., the material bypassed is excluded from the feed and the underflow products.
The Corrected d^~ Value ---
30
*dj-Q value, which is the aperture size at which half of the particles in the feed which are actually classified appear in the overflow, may be derived from the corrected efficiency curve; this is an important single parameter in the quantitative description of cyclone performance, as will be seen below.
The Reduced Efficiency Curve
The corrected efficiency curve applies to only one condition of cyclone operation. However, a general curve which describes the classification of an ore in a cyclone may be derived from the corrected efficiency curve, by ’ replacing the actual size scale on the abscissa by a reduced scale given by:
Actual Aperture Size Corrected dcrv Value
30
and replotting the curve. This new curve is known as the reduced efficiency curve. It has been shown that this
ER 1382
basic performance curve illustrated in Figure is obtained for a wide range of operating conditions.
/ O \
Lynch and Rao v 'found experimentally, over a wide range of operating conditions the corrected d^Q value is a function of the feed pressure, vortex diameter, water to the overflow, and the apex diameter, given by,
log d^Q (corrected) =10“7+ 2^6 “ 3.5 32 + K3 ^ Where
P = feed pressure in p.s.i.g A = Apex diameter in inches V = Vortex diameter in inches
WOF = Water to the overflow in tons/hr and,
Kj = a constant
Lynch and Raov 'have also defined the reduced efficiency curve by an empirical equation given by
ex«
y = ~x .100 (9)
(ex<*+ e=* -2) Where
y = percent solids of feed reporting to the underflow due to classification. x = particle size/d^Q (corrected)
c< = cyclone design constant.
Only one value of alpha corresponds to the experimental reduced efficiency curve. This value can be determined graphically or by the use of a computer program.
1 0 0
ER 1332
21 o o o o o o o o o o o \ o o t ^ - v o in -3- t n c v i i - 4ttoijjopun o% %•*%& P9^o©jjqo
1* 0 lo g s c a l e d / d ^ o ( c o r r e c t e d ) F i g u r e 5. T h e r e d u c e d e f f i c i e n c y c u r v e of a cy cl o n e
ER 1382
Thus the equations 6, 7» 8, and 9 developed by Lynch /o\
and Racr , though basically empirical, provide guide lines V for evaluating and predicting cyclone performance* Before discuss the way in which the Lynch model could be applied the following comments may be made concerning the model:
1. It has not been confirmed whether or not the model could be applied to cyclones of different diameters varying from 3 to 36 Inches*
2. The study of the cyclone performance was made with silica alone as the feed solid*
3* The effect of specific gravity differences in the feed solids on the classification,
performance of the cyclone has not been studied*
k. The values of so-called "cyclone constants", and K^, obtainable from Equations 6 and 7, though
significant, are sensitive and not particularly accurate, and while determining these constants, weight should be given to the magnitude of error that could enter during the test runs used to establish the values of these constants on a given cyclone*
3* Moreover, the value of constant from Equation 8 is particularly sensitive because the equation in volves a log term. Since the corrected d^Q value is important for each test as well as in deter
mining the reduced efficiency curve, the difference in the actual and calculated d^Q values cannot be overlooked.
ER 1382
In order to apply the model to any particular cyclone operation the following procedure is adopted:
«•
1. Run a group of classification tests on the cyclone. 2. Apply Equations 6, 7, and 8 to determine the
values of the three cyclone operational constants (K , K2 and K^).
3. Determine the value of alpha (cx)
4 . Use the values of these constants to predict (a) The cyclone throughput (gpm).
(b) The water flow rate in the overflow (tons per hour)
(c) The corrected d^Q value, and
(d) The percent feed solids reporting the overflow due to classification.
3. Calculate the recovery of any desired mesh, solids in the overflow.
6. Calculate the mass flow rates of water and solids in the overflow and underflow streams. So far, we have discussed elements of cyclone operation, performance and the nature of research work conducted to predict the cyclone performance. It is appropriate at this stage to familiarize the reader with the objectives of the present investigation on the 13“ and 10-inch
cyclones and the nature of relationships that are to be developed from the data on the two cyclones.
ER 1382
2*fThe objectives of the test work was to develop performance equations for:
1. The recovery of feed solids in the overflow® 2. The recovery of WO^ in overflow.
3. The cyclone throughput.
It may also be mentioned at this stage that the present investigation is not an attempt to confirm or develop the
Lynch and Rao model, nor to fit the present data to the model, because the equations that are primarily to be developed from the data are not similar to those of the Lynch and Rao model. Some data, however, are suitable for checking the model, and this has been done where possible.
ER 1382
EQUIPMENT AND SAMPLING PROCEDURE
Equipment
The equipment for running the tests on the 13** and 10-inch cyclone is illustrated in Figure 6. The setup for the 13** and 10-inch are identical. The feed distri butor box of 100 gallons capacity was used to mix as well as to distribute uniformly the feed into a collection bar rel of the same capacity. The feed sump tank had a sloping bottom, which facilitated the flow of slurry to the feed pump, which in turn fed the cyclone. The feed pulp density was adjusted by adding the required amount of water at the feed sump tank as shown. Figure 7 represents the organi sation of the test work.
Tvne of Feed
The by-products plant feed at the Climax operation con tained economic quantities of wolframite, along with gangue material, mostly pyrite and silica in varying proportions. The average specific gravity of the feed was about 2.7; the average size-and-assay analysis of the feed samples is given in Table 1.
ER 13b2 26 Feed distributor box Collection barrel Feed pressure Dilution Water Cyclone Feed Sump Apex \ pressure underflow Pump overflow (#) Sampling points
3R 1382
27
15- inch cyclone Vortex 4-inch Vortex 6- inch Apex i 1.59”-2 Apex l.^-a"Samples were taken at different settings of feed pressure and percent solids of feed pulp.
10-inch cyclone Vortex 3- inch Vortex 4-inch Apex 1.15 "-1.5 Apex 1.08"-1.5
ER 1382
28
Table 1.
Weight and Wolframite distributions of the cyclone feed
in each size fraction V
Size ^Weight Dist Assay (%) W0-, Dist
Mesh inct.
wo3
Ind.+35 5.6 .015 1.9 35X4-8 8.6 .011 2.2 4-8X65 11.0 .013 3.4 65X100 12.4 .023 7.0 100x130 10.0 .035
8.4
130X200 10.7 .0 47 12.0 200X270 5.4 .075 9.9 270X4-008.4
.061 12.3 -4-00 27.9 .064 42.9 100.0 100.0E 1382
29
Sampling Procedure
The sampling procedure for the 15“ and 10- inch cyclone was similar, as described below. The cyclone was fitted with an inflatable donut type of apex, the diameter of which was regulated by pneumatic pressure valve. Fig. 8 shows the relation of apex diameter in inches to the applied pressure.
1. The circuit was first checked to ensure that it was at steady state. This was done by checking the percent
solids of the slurry of feed, underflow and overflow by means of a Marcy scale, until each gave a constant or near constant reading.
2. The feed slurry was run into a 50“gallon drum to determine the flow rate in gallons per minute.
3. Knowing the pulp density of feed from (1), the
required amount of dilution water was added to lower the per cent solids of the feed to a desired value. The dilution water was measured by timing the flow into a 50“gallon drum or by flow-meter.
4. The apex diameter was then set by regulating the
ER 1382 30 VO in cvi H H CM bO 02 P . © 3 02 © © Z* p . X © p . <4
seqo u f uip j[9q.0m,B fp xodV
% F i g u r e 8# A p e x o p e n i n g as a f u n c t i o n of a p p l i e d pr es s u r e
ER 1382
be noted that when the data for the apex sizes were taken, no flow was going through the cyclone in order to make the apex accessible. The feed pressure was noted.
3. The flow rates of the overflow and underflow were determined in sequence, by timing the flows of the slurries into 30“gallon drums.
6. Samples of the feed, underflow and overflow were taken in sequence, with a sample cutter.
7. Representative portions of the samples were then used to determine the size distributions and gross wol framite distributions.
Analysis of Samrles
Size analysis was performed on all the samples of feed, underflow and overflow. The following procedure was adopted
for obtaining the size analyses.
1. Samples of feed, underflow and overflow were taken in sequence with a sample cutter. These samples were then weighed, filtered and dried. Each dry sample was then weighed.
2. Each sample was then blended, and a representative sample was taken for size analysis. The remaining portion of the sample was then split, one-half for assay of WO^ and the other half retained for any future use.
ER 1382
3. The representative sample retained for size analysis was then analyzed by a method of wet and dry screening.* The wet screening was conducted first on a ifOO-mesh screen. The plus ^OO-mesh solids were then dried and weighed. The dry sample was then dry screened, using a nest of standard Tyler sieves (mesh 33 > 4-8, 63, 100, 150, 200, 270, JfOO) in a Ro-Tap sieve shaker.
Zf. The solids retained on each sieve we re then weighed and recorded.
5. The portion of sample retained for assay was pulverized to 200-mesh and assayed, and the amount of WO^ in the sample determined.
Data Acquisition
A computer program was devised to calculate and tabu late all necessary operating conditions and metallurgical results. A listing of the program is shown in Appendix A.
The important input data were:
1. The size distribution of the solids contained in the feed, underflow and overflow.
2. Sieve size in mesh and in equivalent microns corresponding to the sieve analysis.
3# The feed, overflow and underflow pulp flow rates in gallons per minute.
ER 1382
33
3* The percent solids of the feed, underflow and overflow, by weight.
The important output data from this computer program were: 1. Screen size analyses in tons per hour'of solids in
the measured feed, calculated feed, overflow, and underflow.
2. Total flow rates in tons per hour of the feed, overflow, and underflow.
3. Pulp flow rate in tons per hour of feed, overflow, and underflow.
Jf. Water flow rate in tons per hour in the feed, overflow, and underflow streams.
3. Percent solids of feed, overflow, and underflow slurries.
6. Percent of material in each size fraction in the feed to U'flow 7. Percent of material in each size fraction in the feed
reporting to the underflow due to classification. 8. d^Q (corrected) size in microns - i.e., the particle
size of solids reporting 30 percent by weight to over flow and 30 percent by weight to underflow, as a result of classification (i.e., excluding the bypassed material). 9. Percent solids and WO^ reporting to the overflow and
ER 1382
3kEXPERIMENTAL RESULTS OF 15—INCH CYCLONE
The size distribution of the feed solids to 15”inch as well as 10-inch cyclones was reasonably constant in all the tests. However, to be consistent throughout the calcula tions, feed size distribution v/as determined from the over flow and underflow size distributions.
The average size distribution of the feed is repre sented in Table 2.
Table 2: Average Size Distribution of the Feed
Mesh Aperture Size Microns
Weight Percent Retained +35 Zf20 3.6 35X48 297 8.6 48X65 210 11.0 65X100 lk9 12. k 100X150 105 10.0 150X200 73 10.7 200X270 33 5 A 270X400 37 8.k -400 18 27.9
ER 1382
The operating conditions for the tests run on the 15“inch cyclone (A-Series) are summarized in Table 3*
* ■ The experimental results of the 13~inch cyclone will be discussed in two sections: (1) the operational character istics of the cyclone, and (2) the solids separation
characteristics of the cyclone.
The Operational Characteristics of the Cvclone The experimental results of this section are subdivided, into two sections: (1) the capacity of the cyclone, (2) the distribution of water in the cyclone.
The Capacity of the Cyclone
The capacity of the cyclone is expressed in terms of gallons per minute of the feed pulp which, under given operating conditions, is the sum of flow rates of the over flow and underflow in gallons per minute: The feed flow rates in gallons per minute, for each test summarized in Appendix B.
In order to investigate the capacity of the cyclone, the feed flow rates in gallons per minute were plotted
against their respective feed pressures in pounds per sq. in. Figure 9 shows that an increase in the feed pressure or diameter of the vortex resulted in an increase of the capacity of the cyclone. Figure 10 indicates that at a given feed pressure and vortex diameter, an increase in the v/ater content of the feed resulted in an increase in the capacity of the cyclone.
ER 1382 % 36 Vortex diameter O 4- inch 6-inch 10 0
Feed pressure (p.s.i.g)
Figure 9* Cyclone throughput as a function of feed
pressure-the effect of change in pressure-the vortex diameter of cyclone* Percent solids of feed pulp** 3C-33
ER 1382
37 Average $ water (bt wt.)O
70.0
A67.5
10 100 %Feed pressure (p*s.i.g)
Figure 10* Cyclone throughput as a function of feed pressure -the effect of change in -the percent water of -the feed Vortex diameter- 4 inches
ER 1382
38
Table 3• Summary of Classification Test Conditions on 15“
S
inch Cyclone.
Test Vortex Finder Spigot Diameter Diameter
No. In. In.
A-l 4 2 3 32.2 2 V 2 6 37.0 3 4 2 11 28.0 4 4 2 3 30.9 5 4 2 5 31.3 6 4 2 7 30.8 7 4 2 9 30.6 8 4 2 11 28.8 9 4 . 2 5 33.8 10 4 2 9 35.3 11 4 2 10 32. 4 12 4 2 12 30.6 13 4 2 13.5 29.2 14 4 1.75 7 25.6 13 4 1.6 6.5 24.6 16 6 2 3.5 33.0 17 6 2 6 32.9 18 6 2 10 34.5 19 6 1.51 9 37*9 20 6 1.4 12 31.3
Feed Feed Solids Pressure
ER 1382
39
Table 3: (Continued)
Feed Feed Solids Pressure p.s.i.g. Percent A-21 6 1.75 15 34.5 22 6 1.4 20 23.3 23 6 1.55 17 30.8 24 6 . " 1.4 15 31.4 25 6 1.45 16 30.4 26 6 1.45 13 31.7 27 6 1.51 16 27.9 28 6 1.4 16 28.3 29 6 1.42 16 29.8
Test Vortex Finder Spigot Diameter Diameter
ER 1382
The Distribution of Water In the Cyclone
V The water in the feed pulp is distributed in the
cyclone between the overflow and underflow. The mass flow rates of water in the feed and overflow streams are sum marized in Appendix B.
Figure 11 shows that the tonnage of water reporting to the overflow is a linear function of water in the feed. It is also clear from the figure that the mass flow rate of
water to the overflow depends on the diameter of the apex.
(0\
The observations made by Lynch and Bao^ ' on the nature of water distribution in the cyclone followed similar flow patterns y/hich agree with the present test v/ork on the 15"inch cyclone.
The Solids Separation Characteristics of the Cyclone
The test results of this section are divided into four categories: (1) the assessment of the classification per formance of the cyclone, (2) the effect of the variables on the corrected d^Q value in microns, (3) the definition of the reduced efficiency curve and, (k) the weight and WO^ distributions in the cyclone.
The Assessment of the Classification Performance
As a result of a classification test on the cyclone, the size distributions and mass flow rates of the overflow and underflow were known. From this data, the percent solids in each size fraction of the feed reporting to the
ER 1382 41 (jq /s u o q .) MotJJSAo ©qq. ax «zeq.Bfi F i g u r e 1 1 * M a s s f l o w r a t e of w a t e r In th e ove rfl ow as a f u n c t i o n of m a s s f l o w r a t e of wate r in t h e f e e d t
ER 1382
proportion of feed particles are carried into the underflow by the water reporting to the underflow. Accordingly, the
*
amount of feed solids that report to the underflow due to ac tual classification is calculated for each size fraction, for the purpose of obtaining the corrected efficiency curve and the corrected d^Q value, as described earlier in the report. The mass flow rates of feed and underflow in each size fraction and the percent feed solids reporting to the under flow due to classification, for the tests 7, 19, 20, and 27 are summarized in Tables Zf, 3, 6, and 7. In order to show the variation in the corrected d^Q value, obtained under different operating conditions in these tests, the corrected efficiency curves have been plotted on the same graph, represented by Figure 12.
The corrected d^Q values in microns interpolated from the corrected efficiency curves represent the feed size at which 30 percent of the solids report to the underflow and the other 30 percent report to the overflow.
The corrected efficiency curve is not very useful for design purposes because it is specific to one condition of cyclone operation. However, if the same corrected effici ency curve is replotted with the feed size (x-axis) is represented as size divided by the corrected d^Q value, the reduced efficiency curve is obtained. It has been
OO T
SR 1382
43do,
•H r-I •rl P *3 r—I CM LH 00 in o t*-CM CM O o o CM CM■s
oj O CM o\ i-1 t-I 09 -P 09 © -P CD & -P fH O <M 03 CD > 3 O o G CD •H O ■H CD *3 CD +3 O 0 u u o o 0 .G E-i CM H 0 U 3 bO fc«ro O 0 0o CQ •H rH •H «M • CO •H ■' > (0 PQ •d O co\ 0 rH d Pm 0 <H rH ^ Pm U O O 0 o •P xs rH rH d d d ^ 0 P=> d pq o •p \ Ph o o o 0 -P CO ft ON -4* i—1 a- • 0,-v • II CQ X3 o ♦H 0 /—\ c—V CO -H PQ <1! +> __' ^ • H W <4 CO O IQ • CD -s rH CQ ft I &H o Pm d • o rH - rH Eh II pM O Pm o CQ +> o 0 Xi rH -p CQ 0 *H *H CO JH CO ^ (1) CD •H 43 PQ « -P X} 10 • • d © 10 ft a © d • o Pm «H EH 1 •H «H O PQ •P O v_/ ii d PQ o cs *H o O w •H rH • •H -P Pm ft o CO O • CQ d & Eh ctf rH Pm CO xs •W o rH CO 0 PL, PQ d d 0 • +> Pm Eh a CD a C0 •H d U © o CD CQ Ph ft •H O •X CO •H © U • • d -4 -P u 0 © rH ft X i ,Q <u 10 d 0 EH s vo 00 -4 -4* CA O Lf\ rH O IN OO -4 1 • • • • • • o o o CO -4 On vO -4* -4 o o o oo ON 0O LA c\J rH rH rH 1—1 OO OJ • ir\ O • OO VO • CA OJ • ON O • c a OJ • OJ O • O O o o LA o CA VD IN -4* o rH Oi—1 orH ON ON ON VO c a rvl rH -4 IN CA IN VO —4—U -4 ON CN VO OO O IN CO* PA IN VD LA • • • • • • • • • 1 1—1 rH OJ rH rH i—1 O O O -4* IN CA -4* LA OJ ON cA CO O VO CO O i—1 VO vo CO oo VO CA • • • • • • • • • • rH rH OJ OJ rH rH o O O LA -4 IN CA VO -4 OJ VO LA rH VO VO OO O OJ OO A- vo CA OJ OO • • • • • • • • • • rH rH OJ OJ i—1 i—i o O O O -4* IN rA rH -4" o -4* IN- ON VO VO OO O LA ON ON O ON IN rH • • • • • • • • • • i—1 rH OJ OJ rH rH rH O o VO o IN- o ON LA lA -4" IN IN OJ ON rH -4 O IN LA -4 CA CA -4 OJ OJ rH rH 1 CO d o u o a «H LA Xl <1) 4-> O 0 J-l O o o IA Xi O O O O LA O CO LA O LA o IN OJ o O -4 vO rH rH OJ OJ CA -4 O LA \ \ \ \ \ \ \ \ -4 CA LA OO LA O o O O LA 1 + CA -4 VO o LA o IN OJ rH rH OJ OJ CA
T a b l e 5* E x p e r i m e n t a l C l a s s i f i c a t i o n R e s u l t s of T e s t N o , 1 9 M a s s F r a c t i o n of W a t e r to U ’F l o w (A ) = , 2 3 1 6 W?. © 'd O ON ca © o Lf\ ON CO* Lf\ ON 1 1 •rH *H rH • • • • • CQ Cm • O o oo o - CA o- LA £ o o ON CTn oo co* rH T3 O © PQ rH rH © rH © \ © «M © Pm Pm Pi © rHv-' O -p rd O H O o\ 4“ cv O 4" ITS ir\ © !z> © rH • • • • • • • o O o OO oo OO C\i LTN OJ o Pi o -p PQ O o o\ ON OO Lf\ CO* OJ OJ © -P o \ i—1 rH PH <4 O pq © ^ ca •h © CQ *H <-* W ;5 nH •v-/' O © PH I rH CQ • Pm © & i o - rH II O Pm pq © T3 ca © •H H CQ • <a} *H UJ -d W *1 © © PH © © *pq Pm rH &a ti O pq O W rH • Pm PH £> Eh W h3 • © PH © • Pm EH © ca •H CQ © Pi P* ■P u © Pi <4 o pq © P o o *H A CQ © OJ OJ vo 4* o LTN ON rH vo O- oi vo o- OO rH O -* • • • • 9 • • rH OJ . OJ OJ rH OJ OJ ON ON ON vo CA VO A- OJ VO ON OJ rH OO o • • 9 • • • 9 • • rH OJ OJ OJ rH OJ rH . rH VO
OJ OJ la ITS ON co* CO* co*
VO O - ON -4* OJ la LTN LA VO • • • • • • • • • rH OJ OJ CO* OJ rH rH OJ OJ oo o oo Lf\ o A-VO A- ON Lf\ LA ON CA co* oo • • • • • • * • • rH OJ OJ to* OJ OJ rH OJ A-o o ON LA ■4* co* OJ ON rH 4* O A- LTN -4* OJ OJ i—1 rH [>- O- CA CO* I O O O O o oo ir\ O lA O O- o o 4* VO rH «H OJ OJ 4* o ITS \ \ \ \ \ 4* co* IP* oo LA O o o o 1 + CO* 4* VO O LA o a -rH rH OJ OJ © P5 O Pi o OJ oo T5 © -P o © Pi Pi o o o ITv TJ
T a b l e 6: E x p e r i m e n t a l C l a s s i f i c a t i o n R e s u l t s of T e s t N o . 2 0 kS -4 O -4* i—1 £ o rH Pm o 4-> u 0 -p d Cm O CJ O •iH -P o d U Pm 0 CQ d S 0 IS! •H £ c/3 O rH 73 Pm 0 0 SH pM © 73 -P £ S3 © o o U -p 0 ph o 73 O 0 rH •H • «M^-n •H PQ 0 \ 0 Pm d ^ rH o o o rH rH • d-^ 2 pq p \ o o ■dj v—/ PQ © 73 ES3 0 •H *H 03 «h • «=q r l K ' - ' ^ 0 *1 O 0 PH rH d • O Pm rH Eh il - O Pm X> ' '-' PQ 73 0 0 N *H •H P W <J 03 *H • ^ 0 PH I 73 0 • © d Eh PQ © «H ii Pm O PQ «2 • o W 1—1 • Pm PH O t=> EH • W 73 • © PH PQ © • Pm EH 0 $3 © O £4 U o 03 0 U P3 -P U 0 X PH 0 *4 © O O its A + o O oo -4 oo OO OO O O oo O O ON i—I rH VO CO VO-4* ON LTN -4 iH ON VQ A lf\ LT\ OO OO ON 00 -4A O VO A CM LA VO LTN OO A -4 O O LA VO o A rH \ O o rH O O c\J \ O A rH O O-OJ \ O O CM A O--4 i—I ojrH ON NY A oo O OO -4 OJ ON Cs- A OJ A OJ O • • • • • • • • 1 iH OJ OJ OJ rH ON A ON c^- O- ON -4 ON IY Cv ON A ON vo A OJ • • • • • • • • • rH OJ OJ OJ OJ i—1 OJ oo ON A O VO OJ VO O OJ CO ON O- OJ o VO o A -4 i—i • e • • • • • • • 1—1 OJ A A rH rH i—i ON A -4 A ON CN-ON C^- OJ -4 ON a4 ON ON A • • • • • • • • • i—1 OJ A A OJ A rH OJ ON o o- O ON A -4 A y o-OJ ON i—1 -4 O IY A A A -4 OJ oj rH i—1 1 O O -4 \ O l>-OJ o 0 -4 1 CQ o u o •H B oo o rH II 73 © -P O 0 U u o o o A 73
47
73 rH © © • tSJ p oo O O- OJ ON OO fA o •H p w • • • • • • • • • C/Q •H \ OO ir\ OO LfN ON rH KN VO £ © Ip ON ON OO VO KN OJ i—1 73 O © © rH 05 © «M P O C=i P O O © P P 73 P • PI P c5^ ON o N"\ o o LfN VO OO © £3 P cq • • • • • " * • • • OJ O p \ oo LTN ON CO -4* oo O r°k CN-co Pi o o o ON ON oo VO -4" OJ OJ P O- © Eh <4 M->» O•C
Q
p: o II Pi o- © 73 o OJ /-\ CQ © PQ P <4 P P •8
• CO «H o P o OO 1—1 LfN ON O -4* voco
►“7* #=—< ^ © 1 o- N"\ o- LfN P OJ i—1 o.
• o O © • • • • • • • • • OJ -P 1—1 rH Gj o . p OJ OJ OJ P • OJ CQ P=i P4iH II p © - O & E-» £3t
=
3
w'
—*
II o . . o •p 73 73 © © PQ © CQ Pi N P • 4-> 4-> © •H «H<
O rH p CQ P OJ O oo OJ ON ON O oo © P* ctf © 1 o- ir\ o oo O 1—1 o- vo p Pi CQ =5 73 © • • • • • • • • •U
© © 05 PQ p oj f^k ro\ r^N 1—1 OJ ONO
«H © rH ii O O P=i O w p! '—/ O P! O •H o LfN -P P 73 cS P o o ■5 • *H 05 O W Pi i—1 • -4* ON CV. CO -4* tN- ON oo oo P f=i Ip o« o oo LTN ON oo -4* ON ffN NY [>-© •» • • • • • • • « ■ * •c
a
© £3 EH p OJ OJ OJ Pa
© i—i CCS o s rH • cti 73 W VO i—1 p . I>- VO -4* OJ VO -P © • CO £>- K>k OJ OJ -4* ON oo ON PJ © Pi pq • • • • • • • • • © fp • p OJ l*Y -cf r°k P OJ ON 2 EH , *H Pi © Pi © X © PI W N o o O- o ON LfN -4' N^k O- t>-P P« OJ ON p -4_ O LfN cO fOk CO o -4* OJ OJ p i—i 1 • • P © S Pi © £j rH p r© Pi o o O O O 05 © OO LTN o LfN O o- O O EH PiA
C
Q
LTN -4" VO p i—1 OJ OJ -4* O \ \ \ \ \ \ -4* © + LfN oo LfN O o o O 1 CO\ VO o LfN o [>-p i—1 OJ OJER 1382
C
8)
shown that this basic efficiency curve is obtained £pr a
*
wide range of operating conditions which is confirmed by this test work.
For the benefit of the reader, five actual tests, No. 7, 15, 19, 20, and 27, were chosen. Figure 13 represents the reduced efficiency curve for the five tests which were run under different operating conditions.
The Effect of Variables on the Corrected d^Q Value
The corrected d^Q value, as defined earlier, is the aperture size at which half of particles feed which are
actually classified, appear in the underflow and the other half in the overflow. If the reduced efficiency curve of a cyclone separation is applicable to all conditions of operation of the cyclone, then any expression defining the magnitude of d^Q (corrected) for an operation can be used as a single parameter to define the corrected efficiency and hence the entire classification performance. An attempt was made to derive a general expression of the forms
log dc0 (corrected) ='K^.(V) ± K^.CP) ±Kg(W0F) ±K„(A)+Kg Where
V = Vortex diameter in inches
V/OF = Water to the overflow in tons per hour P = Feed pressure in p.s.i.g.
A = Apex diameter in inches,
K^, K^, Kg, Krj = Coefficients and, Kg = Constant
1 0 0 ER 1382 49
4
VO in ov o rH «H OJ in OJ rH O rH O O m o GO VOO inO o o\ o • 0 0 1 > ' o aj >»* • o o G OJ © iH » o o\ tI rH . 4-» * q> in rH TJ -t (D • O t--4* 3 L a> h 09 d •P^S 0 IQ Cl ^3 O H e-«e< <* m rH © F« 3 K> «rlEH 1382
.335* .0087| .006, .211, and 3.31 respectively, but the index of determination was low, as will be seen in the "Discussion11.
Defining the Deduced Efficiency Curve:
(Q)
Lynch and Rao^ defined the reduced efficiency curve by an exponential equation given by:
7 = eX<* -1 • 100 (9)
exoc + e<*_ 2
Where
y = percent solids of feed reporting to the under
flow due to classification, in each size fraction, x = particle size/d(corrected)
= cyclone design constant.
A value of alpha (°0 = in equation 9 resulted in a curve corresponding to the observed reduced efficiency
curve which is shown in Figure 13.
The Weight and WO-^ Distributions in the Cyclone
The objective of this test work, as mentioned earlier was to determine the operating conditions necessary to re cover as much as 30 percent of the feed solids as overflow solids and as much WO-j as possible> Since much of the WO^ was in the finer sizes as determined by the average assay on the by-products feed, it was desired that a maximum recovery of the finer sizes (solids finer than 270 mesh) may have to be made in order to increase the WO^ recovery in the overflow.
P e r c e n t -2 7 0 m e s h s o l i d s of f e e d t o . o v e r f l o w
ER 1382
51 100r
'S 50 u no 20 30 40 50 60 70 80 Percent solids of feed to overflow100
Figure 14. Recovery of V/0-* and -270 mesh solids of feed in overflow as a function of recov ery of total solids in overflow.
ER 1382
Figure 14 shows the trend according to which the
percent Y/O^ to the overflow increases with tonnage or weight of solids to the overflow. The figure also shows the re coveries of the -270 mesh solids in the overflow. Table 8 summarizes the WO^ assays of the underflow and underflow samples for each test. Table 9 shows the percent tonnage, percent WO^, and recovery of -270 mesh solids of the feed reporting to overflow for each test on the 15“inch cyclone.
ER 1382
Table 8
Assays of WO^. for the overflow and underflow for each test on 15-inch cyclone.
Test No. WCE Assay {%) WO^ Assay (%)
(A-) Underflow Overflow
L 1 .0405 .0420 2 .0470 .0360 3 .0305 .0425 4 .0425 .039 * 6 .045 .035 7 .034 .036 8 .031 .035 9 .044 .033 10 .038 .042 11 .061 .042 12 .032 .042 13 .048 .041 14 .0395 .036 15 .0425 .0365 16 .0435 .0385 17 .0483 .0365 18 .0355 .0345 19 .038 .033 20 .053 .033 21 .054 • .033 22 .048 .034 23 .053 .036 24 .056 .034 *26 .034 . .035 27 .049 .031 28 .030 .036 29 0.05 .029