The effect of Broadband spread on growth in GDP
Master thesis in Economics
Author: Sebastian Kindbom
Tutors: Johan Klaesson
Master Thesis in economics
Title: The effect of broadband spread on growth in GDP Author: Sebastian Kindbom
Personal
number: 860306-5973 Tutors: Johan Klaesson
Johan P Larsson Date: 2012- 06- 11
Subject terms: GDP, economic growth, information and communications technology, broadband
Abstract
This paper investigates whether there is a correlation between broadband use and econom-ic growth by using an endogenous growth model along with previous studies of broadband use and theories for its spread an equation was developed accordingly.
The estimation was done using data from the World Bank and ITU for the years 2002-2008, with minor imbalance in the dataset. Moreover, the estimation was done using two-way fixed effects and heteroskedasticity and autocorrelation robust errors, given tests for heteroskedasticity and autocorrelation in the regressions. The result from the regressions showed that broadband spread has a significant effect on GDP growth, while the signifi-cance of the coefficients for human capital do vary with education stage.
In the analysis of the subject it was also shown that there are more underlying matters to be dealt with to give a fair estimation and conclusion, such as the difference between markets and difference in speed of broadband which may could have given slightly different results. Also that the range of time for broadband is relatively short, a longer range could have giv-en a better estimate. Furthermore, the analysis shone light on that there are both weakness-es by spread of broadband as exacerbation of poverty and strengths as possibility to savings in healthcare and increase spread of education via broadband. In addition to this there is possibly reversed causality and the fact that all ICT technology are general purpose tech-nologies has the impact that one should see the results with somewhat scepticism.
In conclusion, the positive effect from broadband spread on economic growth is stated-with an addition, that more data and taking account of broadband differences globally would be needed in a future research to fully establish the effect, as well as mentioned limi-tations to result should be taken into account.
Acknowledgements
I would like to thank my tutors Johan Klaesson and Johan Larsson in their assistance and coaching in my work with this thesis. I would also like to thank my family, my girlfriend and classmates for encouragement, wisdom and support throughout the time it has taken
Table of Contents
1
Introduction ... 1
1.1 Purpose and research question ... 3
1.2 Literature review ... 4
2
Theory ... 5
2.1 The Solow Growth model ... 5
2.2 Representation of technology ... 6
2.3 Importance of education in the use of technology ... 7
2.4 Spread of broadband ... 9
2.5 Summation of theory ... 11
3
Empirical analysis ... 12
3.1 Data collection ... 12
3.2 Methodology ... 12
3.3 Defining variables and motivation for usage. ... 12
3.4 Descriptive statistics ... 13
3.5 Model specification ... 14
3.6 Results from investigating broadband effects. ... 15
3.7 Limitations in the results and in dataset ... 18
4
Analysis ... 20
5
Conclusion ... 26
6
Appendix ... 28
6.1 Graphs ... 28
1 Introduction
What has emerged with broadband within the society is to a large extent the possibilities for networking, trade and direct advertising throughout the networks. The implication of this for business is the reduced necessity of physical presence for business meetings of dif-ferent kinds, which reduces travelling costs and hours of inproductivity in travelling. Though granted, when business take part in the manufacturing sector, it might be more relevant with physical precense to inspect a product.
Furthermore, studies have shown that as broadband facilitates a workstation at home in-stead of being in an office, leads to a higher efficiency for the worker at home compared to the one being in an office. This has a major advantage in larger metropolitan areas where congestion is highly likely to appear, as transportation in general could be reduced by 10-20%. (Fuhr, Pociask, 2007, p6) It is also a profiting situation for business as it reduces the need for costly officebuildings as well as lower cost of stress from the congestion, which may lead to healthier personell. Thus three actors benefits from a situation where employ-ees can work from home, the employer, the employee and the commuter who could possi-bly spend less time in traffic if less people need to commute to an office. To bring forth another aspect that benefits from the decrease in commuting is the environment, whereas it could reduce the CO2 released by the transportation.
Another use of of broadband may be the increased trade, both in tangibles and intangibles. Sites such as Amazon or eBay, may not be the result of broadband but internet in general. Despite this there may be a reason to include these sites anyway, with increased technology the products sold may be displayed before purchase in a manner that was not possible, giv-ing the customer an increased levelfor reassurance that the product might be what the cus-tomer is looking for.The critique against this argument is that not every product can be displayed with for instance a movie or a sound-clip, neither is the possibility for every company to develop such commercials as they are costly in production with the skills that requires skilled technicians for a high end result that would convince the customer. The American Consumer Institute(ACI) still though projects that the growth of business to consumer(B2C) will increase from 6% to 10% of retail trade between 2006 and 2011 (Fuhr, Pociask, 2007, p6), though it is entirely dependent on the spread of broadband in the gen-eral population.
As for intangibles, or more precisely what used to be considered tangibles, music and mov-ies on the internet has been given quite a boost after broadband was introduced, both in le-gal form and illele-gal form. Forms of businesses and forums that have promoted these prod-ucts are iTunes, Spotify, myspace and Hulu to name a few. The use of downloading com-plete records directly from a site have an ambiguous economic impact, the positive aspects may include higher income to the recording company and the artist as the distribution costs declines from not shipping physical goods. Also, the customer may gain from this as in general this may cut out cost from an intermediary company. The other side of this coin is the loss of job opportunities, as for instance most record stores will go into bankruptcy and a minor effect on shipping companies. Moreover, the result of the e-materializiation(physical products turned into digital products) has the advantage of not needing the physical space, meaning that warehouses and retailers would need less space for selling their products. Also the e-materialization could reduce shelfspace in offices for
tronic services, which means less cost in storage, purchasing of paper and waste mainte-nance. This does not necessarily stop at offices, but also newspapers have tended to use this as well, to create newspapers on the web, which do have the same positive effect as in offices.Therefore the is a secondary benefit to environment, since the waste produced by the economy could be reduced to new low-level. But as stated before, this is highly affected by the availability to the technology, thus the spread of broadband is taken to be a major part in the line of arguments in this paper.
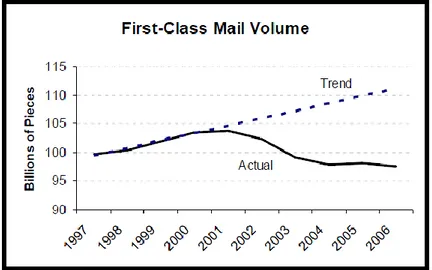
An illustration from ACI regarding the use of paper for mail shows that internet by itself has changed the amount of paper used for mail purposes, where there is a declining trend from 2000-2001 to 2008. In a similar fashion one could predict that plastic used for making cds, dvds etc. would be likely to take on a similar trend, as the speed allows for larger digital objects to be sent in a time-window that makes it lucrative.
Figure 1 Showing decrease in the use of mail due to electronic mail, (Fuhr, Pociask, 2007, p 33)
Piracy on the internet may also have an effect on growth, directly from business in soft-ware-production, music and movie loosing profits and indirectly from the costs of legal pursuits of internet piracy. Thus, there are components that reduces small parts of eco-nomic growth.
Moreover, benefits would could occur to the society from programs in e-Government and e-Health whereas the spread of broadband would expand possibilities to allow remote loca-tions to have a better respons possibility and improved sense of democracy in for instance being more influential to decisions. E-health programs could provide more services to those locations where people with expert knowledge could for instance guide procedures or give opinions on matters without needing to move either any of the involved between locations.
Based on that for any of these benefits to occur, there has to be a spread of broadband, the spread in itself makes it interesting to investigate. If it affects economic growth and if, how the spread then affects it.
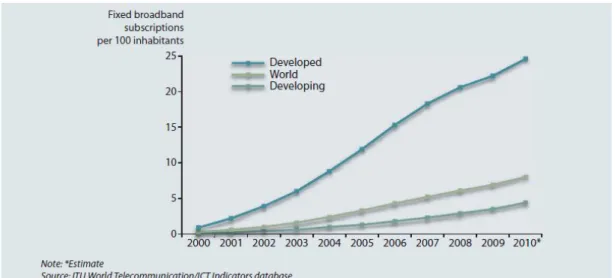
To give a crude illustration of the broadband development, one can see that since 2000 and on there have been increases in the spread, that are in some cases quite substantial. This is another reason why it is interesting, because it is an contemporary technology in
develop-broadband spread growths between developed countries and developing countries is quite large, which will to some extent be discussed in the analysis.
Figure 2 Showing development of fixed broadband between 2000 and 2010, ITU, The world in 2010: ICT facts and figures, p 6
Based on previous reasoning in the introduction to the thesis, one could state the question, do broadband truly contribute to the economy as a tool of expanding markets, improving information systems and benefit the infrastructure and environment? By extending the question into an economics territory and narrowing it slightly further one could ask it such as, does it benefit the economic growth as a means of increasing productivity within a country? The investigation therefore moves into the territory of questioning whether a piece of technology could possibly be significant to the production within a country and why would it be it and what possible factors would contradict or verify this answer in the quest for a truthfull answer. By investigating factors of economic growth and how broad-band may relate to these and how it would affect economic growth, one could derive an indication of how to evaluate broadband in terms of whether one should include it in the economic growth policies in relation to other factors of economic growth. Furthermore, as it is a contemporary developing piece of technology, the studies of it tend in relation to economics tend to be scarce whereas the more general studies of ICT technique in relation to economics are more common.
1.1 Purpose and research question
The purpose of this paper is to investigate the connection between broadband use and growth of GDP per capita. Moreover, as the purpose of this thesis is to investigate the cor-relation between broadband and economic growth, there is also a need to investigate the factors promoting broadband use as well as the factors resulting from use of broadband to establish a logical causality. Hence, the investigation of causality between the economic fac-tors is a part of the purpose in this thesis, as it will first be dealt with from a theoretical point of view, secondly it will be numerically confirmed or rejected by the use of econo-metric models.
From what is stated in the purpose of the thesis one can deduce a research question: Is there a significant correlation between growth in GPD and the use of broadband?
1.2 Literature review
Koutroumpis (2009) found that for a critical mass of broadband there would be increasing returns to investment due to network phenomenon. By using 4 equations he calculated the growth in GDP contributed by broadband, the level of penetration of the technology which resulted in critical masses of broadband. This later was run as a regression, where the higher the critical mass was, the higher the percentage contributed to growth was. Thus, there are increasing returns to investment in broadband technology.
Kolko (2010), researched the effect of broadband use on local economic growth and relat-ed effects in California. He found a positive relationship and possible causality between broadband and economic growth, but the data did not definitely indicate the relationship. Though there was no significant relationship between employment rate and broadband, nor were average pay per employee, taking work home, home-based work or telecommut-ing correlated to broadband from what Kolko could find. As for the median household in-come there was even a negative relationship. The causes that Kolko lists for each variable was that business were eager to expand to broadband areas and working age population was also eager to move to an area with broadband. Though, in general people are mobile or willing to commute to work and the premium for know-how around broadband was very little on the salaries. Further, most broadband connections in the areas Kolko investigated were too slow to enable homebased work in any form as companies demanded a higher rate for work to be possible.
Gillet et al (2006)found in a research using zip code data over the USA that broadband in-creased the employment rate by 1%. Similarily to Kolko, Gillet et al did not find a signifi-cant relationship between wages and broadband. In addition, they found that in general business and especially IT firms expanded after the time of broadband deployment in an area. In contrast to this, they also found that small enterprises suffered after broadband was established in an area where there were less small enterprises after the introduction of broadband.
Thus, the literature present pertaining to broadband’s effect on economic growth does not show a clear trajectory of the way that it would affect it, as some do say that it does not af-fect while others refer to a positive efaf-fect. Therefore it may be necessary to point out the expectations of a broadband variable may not be possible to predict in the econometric modeling.
2 Theory
2.1 The Solow Growth model
For the purpose of describing the matter at hand, it would be a proper beginning to explain one of the first theories around economic growth connected to the technological change. The Solow growth model describes what contributes to economic growth by splitting up the growth in the significant parts output (Y), capital(K), labor(L) and technological pro-gress (A) or what is also called the Solow residual in some studies.
Y=A(t) f(K,L,) (1)
As one differentiates the production function to show the change in production it gives: ̇ ̇
̇
̇
(2)
which
is equal to ̇ ̇w
k̇
+ w
l̇
(3)
given thatwk=
wl=
(4a, 4b)Where denotes the derivative of Y with respect to time, as do the other “dotted” varia-bles. By letting Y/L=y, K/L=k and wL=1-wK gives
̇ ̇
w
k̇
(5)
which is the case when technical change is neutral. (Solow, 1957, p313)
What Solow found in 1957 while using this function for data from 1909-1949, was that technological change was in general constant with exception for the time around the great depression. According to Solow’s findings technological change was also independent of the economic growth. A critique against Solow would be to not define A more narrowly or use another variable for technological progress alone, since in his equation A does not only represent technological progress, but also includes knowledge and other factors that may have an effect on the production called the Solow residual. Thus this equation for a growth model only suggests the initial ideas for relationships between growth in output and capital, labor and technological progress along with disturbances around it. For the purpose of this paper, only the initial relationships are of relevance for a theoretical basis.
What contribution one may find from Solow’s model to this paper is the initial output growth correlation to disturbances from technology, along with capital and labor. Thus as a reminder for the empirical analysis, the model ought to include capital and unemployment as control variables. The control is evident from the previous equation, where one has to attempt to prevent the technology’s significance in a model to be influenced by capital or unemployment as these will likely have a significance in explaining changes in output.
From the Solow growth model, what is called New Growth Theory by Romer 2006 is de-veloped, which extends the more general growth theory to include research and develop-ment and human capital into the model.
2.2 Representation of technology
For any appearance of new technology there is a certain amount of factors for the technol-ogy’s existence and spread through society. May it be the education of the general popula-tion as discussed later, or the creapopula-tion of the technology by itself explained somewhat by the new growth theory.
According to Romer’s new growth theory at basic perspective, the total production within a country is devided into two main sectors, first the goods and general service producing sector, then the knowledge producing sector. This generates an addition to the Solow growth model introduced previous section in forms of aK and aL which denotes fractions of
input capital and labor devoted to R&D. In equation (6) one may see how this mathemati-cally is formulated, where similarily to the Solow growth model, the output of the economy (Y) is equal to the factors capital and labor. The addition to the model comes in terms of how the production of knowledge and technology withdraws certain part of the production from both capital and labor, the mentioned aK and aL, where the remainder for production
to output of the economy are (1- aK) and (1- aL).
( ) ( ) ( ) ( )( ) ( ) (6)
R&D sector produces the knowledge (A) which has three distict characteristics, it is non-rival, non-excludable and its return to scale is not limited to be constant, but may be both diminishing or increasing given the nature of knowledge creation. In the R&D sector, the production of new knowledge and therefore technology is shown by equation (7). In equa-tion (7) the difference in A is a funcequa-tion of a shift parameter B, the share of capital aKK which has elasticity β, aLL which has elasticity γ and at last the previous knowledge in form
of A with its elasticity .
The ambiguous returns to scale are based on what is referred to as the replicative argument. In comparison to other productions where dubling inputs at constant returns to scale would double the output, producing the same knowledge again does not add up to the output. At the same time the joint resources of capital and human capital may interact and produce more output than input rendering in increasing returns to scale. Thus the returns to scale may be based more on previous knowledge and the human capital that creates new knowledge and range between diminishing to increasing returns to scale.
̇( ) ( ) ( ) ( ) ( ) B>0, β≥0, γ≥0 (7) (Romer, 2006, p 102)
An interesting feature regarding the process and the distribution of the technology for the advances within technology, is the more accessible it becomes, the less technology pro-gresses. This is based on the concentration of labor with a specific skillset will rise as a technology with a very high density in one area, but low in the other geographical areas will attract labor with the specific skillset. "Initially, inventions increase the return to skills (by increasing the return to ability), but as technology becomes more accessible, the return to skills declines” (Galor, Tsidden, 1997, p 19). This implies that returns to education
(en-hancement of a skillset) is higher when technology has not been made available to labor with more general skillsets. Therefore, skill-intensive production will always promote edu-cation as it constantly raises the return which leads to an increased demand for eduedu-cation for the given area of expertise, conditioned on that the technology is not accessible to all skillsets. Furthermore, one may add the question whether this argument would imply that the technical convergence between advanced countries and less advanced countries would be the same as the economical convergence or if would be slower to non-existent. If it would be similar to the convergence of economical growth, it would be possible to see less developed countries catching up with advanced countries. Thus a technology introduced at t=t1 by a few countries would be spread to other countries at t=t1+a and have a similar
dis-tribution as the forunners at t=t1+b. If the convergence is unequal to that of economical
growth, the event mentioned regarding the state at t=t1+b would not be visible as the
distri-bution of technology would never become equal. One theoretical answer to this is “larger and richer regions have substantial static and dynamic advantages. The uptake process will begin sooner in these regions, the network will grow faster and the process of cumulative causation relating ICT to social and economic development will be more intenseve.” (Jen-sen-Butler et al, 2003, p 48) This theory also suggests that there is a greater likelihood for a technical divergence rather than a convergence, due to the network possibilities in denser metropolitan areas and the assumption that networking is more likely to be based on first-hand physical contact rather than internet contact. The limitations in this argument is the magnitude of the area discussed, this argument is so far mainly based on regions rather than countries also it is only a theoretical argument, not an empirical proofed research which makes it rather weak.
2.3 Importance of education in the use of technology
Based on the Solow growth model, the human capital theory complements the model by inducing human capital into the production function as follows in equation 8. The produc-tion funcproduc-tion has similar features to that of the Solow growth model with respect to output and capital, but it adds the extension of H(t), human capital. Therefore the production function would be as follows, the output would be a function of capital, human capital and technology.
( ) ( ) ( ) ( ) (8)
While human capital H(t) “is the total amount of productive services supplied by workers” (Romer, 2006, p 134). The human capital H at point t is stated as the labor force L at t, times the years of education G(E) per worker as shown in equation (9).
( ) ( ) ( ) (9)
In theory it should also capture experience as a function of learning-by-doing, but as that will be near impossible to show in a global dataset, it will be left out. An assumption which will be removed from this theory is that “each worker obtains the same amount of educa-tion, E.” This is because the more education a worker obtains, the better the skillset and the higher the human capital. In addition, primary school would give the individual the basic skillsets of reading, writing mathematics et.c. while secondary education and tertiary education would enhance these skills and form new skillsets.
Labor grows at nL(t) = ̇(t) and technology grows in this case at gA(t) = ̇(t) , sY(t)= ̇( )and are taken as exogenously growing variables, in contrast to H(t), which is treated as an endogenous variable. (Romer, 2006, p. 133-135)
The human capital theory suggest that it is the total stock of human capital that matters for growth rate of output and technology in a closed economy (Romer, 1989 , p 29). One rea-son is the production of scientists and related occupations, which are dependent on the the level of human capital introduced and formed in the economy. The higher the level of hu-man capital becomes, the more an advanced technology is possible to be used by the labor force. This is may confirm the argument regarding the distribution of technology, that technological advanced regions or countries may have a higher propensity to use advanced technology closer to the time of invention than less advanced countries. Therefore one could see two patters forming out of this observation, 1) technologically and more educat-ed countries will see a positive circle, whereas less advanceducat-ed countries will see a vicious cir-cle in technological progress since they will be less encouraged to invest in it. 2) By this theory, the income and possibly the growth gap between rich countries and poor countries would grow larger, which could lead to increased poverty and diminished welfare at a glob-al perspective. By inducing trade to the argument, in the countries with low human capitglob-al growth, the incentives to acquire skills are reduced. The long run dynamics are then clear: the small economy falls ever farther behind the rest of the world in terms of human capital. (Stokey, 1991, p 605) With free trade the incentives to invest in human capital changes, when production technology is introduced.
The need of human capital, specifically education depends on the type of technology adopted in a firm. If the technology implemented in a firm is only a manufacturing tech-nology with low need for skilled labor, the effect of human capital is low. Though when implementing more advanced technologies in manufacturing or management processes, human capital has a higher effect in production. What has been seen in implementations of advanced technology is that more skilled and higher paid workers are in general employed both before the technology has been implemented and afterwards. One explanation for the pre-employment of skilled labor to technology may be to instruct workers and to fulfill the proper preparation for installment of technology. Along with the pattern discussed, there have also been patterns of significantly increased wages for the workforce dealing with computer technology in industries, which could be taken as a sign of higher returns to a specified education or skillset in the industry. This is consistent with theory of labor supply, that more narrow fields of skillsets can use the leverage of specification to demand higher wages.
What should be noted from the human capital model is the negative impact on the labor force from a share of the labor supply increasing their education level instead of producing goods or services. This argument points therefore points out that there is a limited trade-off between standards in knowledge and economic growth. Even though the labor might become more effective, it may not always be in favour to the production in total if too much labor is missing from production.
Furthmore,” as microeconomic reforms have helped ICT adoption, and that ICT diffusion is interacting with organisational and innovation factors in generating a positive impact on productivity” (Colecchia, Schreyer, 2001, p 19), one should elaborate this fact along with the human capital aspect as the effect of networking or social capital. Social capital may be considered as the time or action investment of one individual to another to maintain the re-lation between them or an organization. As both internet per se and broadband facilitates
this one could argue that the cost of investment into social capital becomes lower with these technologies. For any economic purpose social capital may be seen as a foundation for making an organization or even just a group of investors to cooperate, either by a level of trust or the communication establishing knowledge of future gains. Thus the human capital model, ought to capture this at theory, empirically it is possible to find social capital at local network levels, but even at that point it is an abstract form of capital. It should be noted that empirical analysis of neighborhoods in the USA has come to the conclusion that it enhances contacts and communication for local issues as well as maintain communica-tion even though the geographics changes.
2.4 Spread of broadband
For broadband to have an effect on GDP, a requirement would be that the broadband has enough spread (or penetration) in the population for giving the aggregate effect on the ICT market and for the spill-over effects to occur. Also, the spread is necessary for any other kind of communication as the more people who has the technology, the more effect it will have. This can be thought of having a similar pattern to a law of chemical reactions, the larger the area of interaction between two agents is, the larger the reaction caused by them will be. In economic terms, it would be translated to, the more consumers who would have access to a service, the larger the reaction would be due to the specific service.
Findings by Grosso, (2006) suggests that GDP was the largest contributor to broadband penetration in Grossos paper, other variables used by Grosso were Herfindahl-Hirschman Index, an unbundling local loop dummy, fixed internet penetration and previous year’s penetration. This paper focuses solemnly of the market mechanisms, where HHI is and in-dex of market shares of companies on a market and local loop was used to capture ease of entrance to the market. Therefore the national income has a part of increasing the spread of broadband, which may make the relationship symbiotic, being that they support each other at some point, or the possibility that the causality for growth may be reversed.
Wallsteen 2005, also discusses the importance of unbundling the broadband, while adding another component, rights of way. Wallsteen found that “rights of way” and “unbundling” were the two larger components in broadband penetration in the USA, while tax incentives by states was not significant. Rights of way in this case is a law regarding the right to use land for development in order encourage access to rural areas. The point from these two arguments is that the physical investment and process is contingent on the ability to an ac-tor or acac-tors on the market to acquire land from either government or population and how it is set to use. The unbundling regulation seen in the usa should theoretically force the ac-tor first to the land to build, else the acac-tor would effectively have to lease the property to the competition. The question though remains as to what prices the leases had to been supplied, if there are any regulations to those and how the competition could react to it. Despite that Wallsteen found the unbundling property in the USA to be a significant factor to increase the spread of broadband, it is mentioned that “broadband penetration in Cana-da is about 60% higher than in the U.S., and that CanaCana-da has less onerous unbundling re-quirements for telephone companies and virtually no network sharing for competitive net-work suppliers.” (Wallsteen, 2005, p 8) Therefore one may question if the unbundling regu-lation is due to the U.S. legal system or any other reason that makes it typical for the US and atypical for other countries.
The spread may become more common in clustered firms where as “optimising the pro-duction-processes performance by redefining the relationships with customers and suppli-ers. In fact, shared databases, integrated information systems, and Internet-based applica-tions supporting the marketing and logistic activities greatly improve the efficacy and effi-ciency of the key supply chain business processes” (Carbonara,2005 , p 221). Though the scenarios for how it will develop is still somewhat unclear, whether traditional relationships and communication will stay stable or if a less social culture will develop within the cluster in favor for technology. For this reason the spread may be affected by clustered firms and how a strategic development in the spread may occur, in order to get the best effect, it seems likely that the spread would occur to the it intensive industries to begin with and then if plausible stretch to low-tech industries.
The logical spread of broadband from a customer point of view, begins with having an in-ternet connection at a slower rate as customers are unlikely to make the direct jump from no Internet use to broadband Internet access. Though as this describes the situation in a
rural community, one could expect the situation in an urban community to be slightly dif-ferent, the public access points in an urban community could be slightly different whereas contact with broadband could be introduced at institutions such as schools, libraries as well as companies. The motive for spreading broadband into rural areas by ICT companies, population density was more important than income in driving broadband deployment (Cromartie et al, 2009 , p 29), rendering in an income inelastic supply. If this is the case in more than just the USA, it means that the limitation to spread is defined as the number of dwellings clustered together. Also it brings to the thought that some rural areas are not go-ing to be receivgo-ing any broadband availability unless government puts down infrastructure investment to ICT in the area as the providers would be reluctant to perform this action. The incentives for the government to invest into the broadband in these areas, could be the possilibity to induce e-Government and e-Health programs to the area. E-governance can be seen as a catalyst for change by demonstrating and taking the lead for other sectors to develop the local capacity for ICTs. (Sealy, 2003, p 353) Pointing out that a community far from the hub of a state can be helped to flourish if the government helps out the build-ing of ICT to create stronger bonds between them. The way e-Governance may create bonds is that the voices of the community can communicate easier with the government, which enhances democracy by communication in the region. E-Health systems have similar population benefits as the e-Governance, whereas waiting times and transportation may be cut out from the costs in the system as long as the patients are somewhat educated in the how-to of ICT technology. There are though set-backs with e-Health since the use of ICTs has the potential to exacerbate inequalities (Gilbert et al, 2008 ,p.923) due to affordability to population in poverty and their possibility to invest to gain acces to ICT technology. Due to this reason, one could oppose the previous statement that the income may not be a driving force for the spread of broadband. As affordability to invest in any device (PC, lap-top or cellphone) diminishes, this should in some way set the limit to where income dic-tates the spread of broadband even if an organization would provide the infrastructure leading to the population. By this argument it provides to some extent a limitation for how far an organization would go to provide the infrastructure and how it should be provided. In order to fully exploit the possibilities for technology to improve how it can affect trade within countries and through this also the economic growth, it is necessary to build up the technology within the society. Innovation based growth is needed for countries which can-not compete with cheap labor, but have to come up with new or improved products to
technology, the more possibilities one would create within any country giving possibilities to lower unemployment and increasing economic growth in the given country. Therefore, if one would increase the broadband spread within a country, a theoretical inference would be that one would increase the possibilities to promote growth from this technology.“Slow growth is mainly the result of failure to exploit the technological opportunities inherent in new and fast-growing technologies. This is not mainly a question of failing to be competi-tive in, say, the production of computers or other products embodying ICT, but embed-ding the new technology in society at large.” (Fagerberg, 2000 , p 16)
2.5 Summation of theory
Technology and human capital are taken as endogenous variables, while capital and labor are seen as exogenous variables. While capital, labor and human capital do refer to relative-ly standard components to growth theory and in empirical anarelative-lysis, technology as seen here does only limit itself to the spread of broadband and not the semi-residual connotation it has had in early growth theory. This may certainly have both advantages and disadvantages, for instance that broadband spread may take on a higher importance by strictly being a re-placement to technology in the growth equation. On the other hand it may be one of the few viable options for discovering the impact.
3 Empirical analysis
3.1 Data collection
The data is collected from World Bank statistics and statistics from the International Tele-communications Union (ITU), where the latter is an agency in the United Nations which surveys all forms of telecommunication in the world. Based on the availability of data re-garding specifically broadband, the data submitted for a regression will most likely be from 2001 until 2009 as prior to 2001 there were very few countries with broadband at all which will lead to a biased regression. The data for ICT will be collected from the ITU and data for economic growth, education and other data that is not directly ICT related is collected from the World Bank.
.
3.2 Methodology
As a large numbers of the countries in the world do not have access to broadband technol-ogy, it would be a technical fallacy to include these countries into the model as the risk for bias in the regression from missing values would affect it to a large extent. Therefore, any country with lack of data on broadband spread for more than 6 years is excluded from the data set. In addition to this reduction of the dataset also the variables for human capital have been counted per country as to minimize the effect of missing values in the regres-sions. The dataset is thus unbalanced, since some countries lack input for other variables than fixed broadband subscription for the full period of time as shown in the descriptive statistics and in the appendix regarding missing values.
3.3 Defining variables and motivation for usage.
Variable Type Expected sign
GDP per capita Dependent Fixed
broad-band subscrip-tions
Independent Positive
Capital Independent Positive Edu1, primary
education
Independent Positive Edu2,
second-ary education Independent Positive Edu3, tertiary
GDP per capita - the annual GDP in a country, with aggregates based on year of 2000’s value divided by the population at the time.
Education - education is counted as percentage of gdp per capita spent per student in three sectors of the educational program, primary, secondary and tertiary. Where primary is elementary school, secondary high school and tertiary university or college. It also includes the expenditure to both public and private education. As this is given in percentages of GDP per capita initially, it was necessary to multiply it by the GDP per capita values giving a monetary input to education. In the empirical study the different types of education will be stated as Edu1, Edu2 and Edu3 to point out the different types of education. The moti-vation for using the three stages of education is based on the argument presented at the end of page 8 regarding that higher education creates more refined skillsets and should thus affect the economy slightly differently.
Capital – annual addition of capital in the economy in terms of additions to tangible assets as well as inventories in the economy. The capital formation is based on US dollars fixed at year 2000’s value. In order to retrieve a good measurement against the other variables this variable has been divided by the population of the country at t to render capital per capita. Spread of Broadband – counted as fixed broadband-subscriptions per 100 people. What should be noted is that it is subscriptions and not total sum of users, which changes the de-sired interpretation of the result compared to a “real individual spread”. But as the real spread is impossible to discover and only possible to estimate by an amount of hidden numbers, the subscription spread is the most easily attainable at the moment and to some extent the most realistic data on spread. Furthermore, it should be noted that this variable may have population overlaps since both individuals and institutions in society have sub-scriptions to broadband, by institutions it is meant companies, schools and government agencies may have broadband in many countries. Thus, some individuals may be subject to taking a share in several broadband subscriptions as they may receive it both at home and at work or similar occupation. This fact creates a standard deviation around the true mean of spread, whereas in some countries it could mean that the a person who has access at both home and at work due to education and wealth whilst being an exception to society regarding this status, can in fact create a bias in the data. The term fixed broadband refers to the type of broadband measured, that it is spread by wires in contrast to mobile broad-band which is spread by antennas.
3.4 Descriptive statistics
By investigating the descriptive statistics given in the appendix, one may see several differ-ences and noteworthy facts regarding the statistics. To comment the distribution of the variables one may see that there is excess kurtosis in several of the variables and the skew-ness of the distribution shows that the distribution within the variables tend to not be in the shape of a normal distribution. In all of the variables presented there is skewness and kurtosis, specifically almost all the variables as one may see from figure 12 to 17 in the ap-pendix are leptokurtic and are positively skewed when comparing them to the normal curve in the histograms. This may affect the results as the variables used tend to not follow the normal curve, therefore test-statistics using normality assumptions could be affected. As a result of this the statistics used may not be seen as reliable as if the variables had followed a normal distribution. Also, a further notice to compliment the skewness and kurtosis, one may see that the medians and means for the variables differ from each other where the median is lower than the mean for all variables.
As if one would look at the count of the missing values in table 8 in the appendix, one may see that for the case of GDP per capita and Fixed broadband, the count of valid values is high enough to doubtly affect the regression statistics. While on the other hand, the Capital variable, Edu1 and Edu2 do have higher grade of missing values, where as count of ,missing values are at 31, 30 and 32 respectively and in the case of Edu3 the count of miss-ing values is at 64 out of totally 322 observations. This accounts for that there is an imbal-ance in the dataset.
3.5 Model specification
Based on the theory presented, the regression would have components from each part of the theory. The overall construction is based on the classical Solow growth theory, using output and capital as stated in Solow’s equation, but the labor is here changed to the hu-man capital model and the broadband is included similarily as the technological difference. From the human capital model, investment into education per capita is added at three steps, primary, secondary and tertiary education.
The theory has thus given the basic production function with inclusion of broadband
Where subscript i and t denotes country and year in the equation.
By taking the logarithm of each variable the production function becomes the growth equation of GDP, which gives:
( ) ( ) ( ) ( ) One of the implications of using panel data is that the pooled Ordinary Least Squares (OLS) model may not be consistent or it may be biased as the heterogeneity may likely be present within the dataset. Therefore were all three models run firstly with pooled OLS in order to run a panel diagnostics test to confirm an appropriate coefficient estimation model choosing between pooled OLS, the fixed effects model [the fixed effects in this case(the case of the test) is only pertinent to the one way groups fixed effects, not the two way group and time effects] and the random effects model. The panel diagnostics consist of three tests; test for differing group intercepts for distinguishing between OLS and fixed ef-fects, Breusch-Pagan test for distinguishing between OLS and random effects and at last a Hausman test for distinguishing between random effects and fixed effects. Strictly through all the three models the panel diagnostics showed a favour of the fixed effects model since, the test for differing group intercepts gave a very low p-value in all models pointing to use fixed effects, the Breusch-Pagan test had as well very low p-values directing to use random effects. At last the Hausman test distinguished between using random effects or fixed, pointing to that fixed effects were to be used as the p-value was very low counting against the null hypothesis that the random effects would be correct. These tests are included in the secondary appendix labelled panel diagnostics for each regression. Based on the tests made the estimation has been done with fixed effects. Moreover, to control for time im-pacts between the years, time dummy varibables have been used, therefore modifying the fixed effects model to a two way fixed effects model. The significance of this has also been tested for as the joint significance test for the time dummy variables show that the null hy-pothesis of all dummy variables are equal to 0 is rejected.
Thus the change to the original model is as one adds αit to the original model which is the capturing of omitted effects correcting, “the assumption that the omitted effects in the model are correlated with the included variables” (Greene, 2008, p193). What would hap-pen if this was not done is that the error term would correlate with the variables, resulting in that the error term would not be indepent and identically distributed (IID) as the vari-ance would else consist of where ui is the individual unobserved effects and
vit is the remaining disturbance
What should be noted is that the fixed effects do not fix any specific variable in anyway, it does only correct for differences between groups by capturing it in the alpha parameter, which is estimated in each regression. In the context of this thesis, groups are defined as countries.
The final regression thus has a form as: Log( ) ( ) ( ) ( )
3.6 Results from investigating broadband effects.
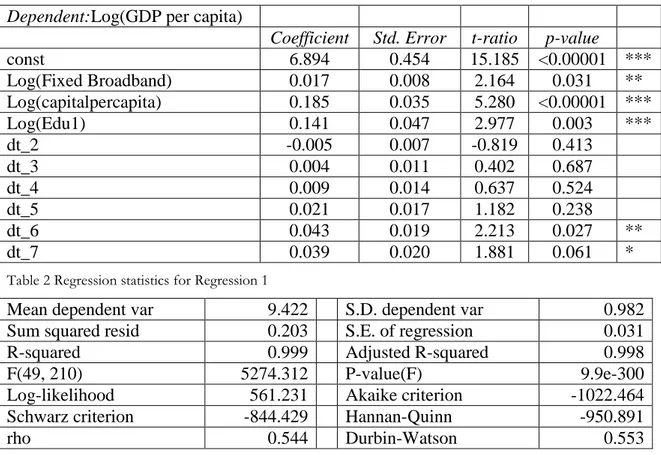
Regression 1 uses primary education labelled Edu1Table 1 Regression 1
Dependent:Log(GDP per capita)
Coefficient Std. Error t-ratio p-value
const 6.894 0.454 15.185 <0.00001 *** Log(Fixed Broadband) 0.017 0.008 2.164 0.031 ** Log(capitalpercapita) 0.185 0.035 5.280 <0.00001 *** Log(Edu1) 0.141 0.047 2.977 0.003 *** dt_2 -0.005 0.007 -0.819 0.413 dt_3 0.004 0.011 0.402 0.687 dt_4 0.009 0.014 0.637 0.524 dt_5 0.021 0.017 1.182 0.238 dt_6 0.043 0.019 2.213 0.027 ** dt_7 0.039 0.020 1.881 0.061 *
Table 2 Regression statistics for Regression 1
Mean dependent var 9.422 S.D. dependent var 0.982
Sum squared resid 0.203 S.E. of regression 0.031
R-squared 0.999 Adjusted R-squared 0.998
F(49, 210) 5274.312 P-value(F) 9.9e-300
Log-likelihood 561.231 Akaike criterion -1022.464
Schwarz criterion -844.429 Hannan-Quinn -950.891
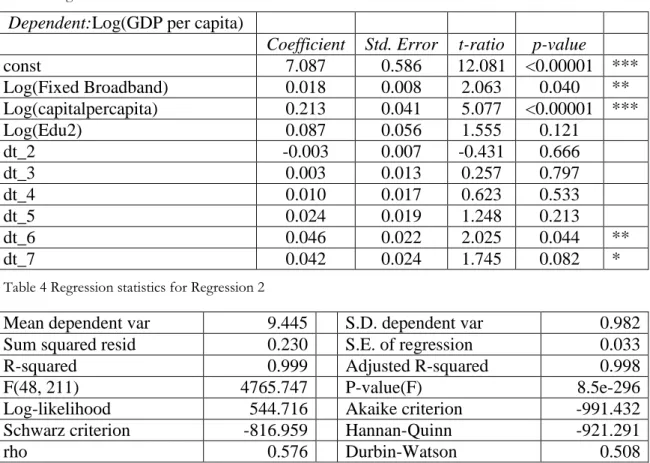
Regression 2 uses secondary education labelled Edu2 Table 3 Regression 2
Dependent:Log(GDP per capita)
Coefficient Std. Error t-ratio p-value
const 7.087 0.586 12.081 <0.00001 *** Log(Fixed Broadband) 0.018 0.008 2.063 0.040 ** Log(capitalpercapita) 0.213 0.041 5.077 <0.00001 *** Log(Edu2) 0.087 0.056 1.555 0.121 dt_2 -0.003 0.007 -0.431 0.666 dt_3 0.003 0.013 0.257 0.797 dt_4 0.010 0.017 0.623 0.533 dt_5 0.024 0.019 1.248 0.213 dt_6 0.046 0.022 2.025 0.044 ** dt_7 0.042 0.024 1.745 0.082 *
Table 4 Regression statistics for Regression 2
Regression 3 uses tertiary education labelled Edu3 Table 5 Regression 3
Dependent:Log(GDP per capita)
Coefficient Std. Error t-ratio p-value
const 6.974 0.654 10.654 <0.00001 *** Log(Fixed Broadband) 0.020 0.008 2.372 0.018 ** Log(capitalpercapita) 0.256 0.060 4.206 0.000 *** Log(Edu3) 0.060 0.039 1.528 0.128 dt_2 0.001 0.006 0.162 0.871 dt_3 0.009 0.012 0.765 0.444 dt_4 0.016 0.015 1.073 0.284 dt_5 0.022 0.018 1.231 0.219 dt_6 0.042 0.022 1.906 0.058 * dt_7 0.043 0.022 1.930 0.054 *
Table 6 Regression statistics for Regression 3
Mean dependent var 9.445 S.D. dependent var 0.982
Sum squared resid 0.230 S.E. of regression 0.033
R-squared 0.999 Adjusted R-squared 0.998
F(48, 211) 4765.747 P-value(F) 8.5e-296
Log-likelihood 544.716 Akaike criterion -991.432
Schwarz criterion -816.959 Hannan-Quinn -921.291
rho 0.576 Durbin-Watson 0.508
In the first regression an one percent increase in; capital would increase growth in GDP by 0.185%, broadband would increase growth in GDP by 0.017%, primary education would increase growth in GDP by 0.141%. Regarding significance, all of the explanatory variables are significant. The fit of the variables to the model show that in explaining variance, it ex-plains 99% of the variance in growth in GDP.
In similarity to regression 1, the capital and broadband variable are significant, while the secondary education variable is not. If one would make an increase by 1%; in capital, growth in GDP would increase by 0.213%, in broadband growth in GDP would increase by 0.018% and in secondary education it would have been an increase by 0.087%. Regard-ing the models power to explain variance it is at 99% , similarily to regression 1.
As in regression 2, only capital and broadband were significant while tertiary education was insignificant. The effect of an 1% increase in; capital gives a 0.256 % increase in growth of GDP, broadband gives a 0.020% increase in growth of GDP, tertiary education would have increased growth in GDP by 0.060%. In the third regression the explanatory power of the model is at 99% explanation of variance in growth of GDP.
Regarding the test statistics run in each regression for each of the fixed effects, group and time, they showed that fixing the effects did have a significance in the regressions. The test for differing alphas rejected the null hypothesis in each regression regarding if the alphas were significantly different from each other or not. Also the joint significance test for the time dummies proofed that at least one was significantly different from 0 which can also be seen in the coefficient statistics. Thus the two-way fixed effects model could be seen as a true model of estimation and an pooled OLS would have been inconsistent and along with a one way fixed effects it would also suffer from omission bias (Baltagi, 2008 , p 36). By inspecting the qq-plots of the residuals in the appendix one may see some similar fea-tures of the residuals in the regression that over all the residuals fit closely to the 45-degree line except for in the first percentiles of the plots where the residuals seem to be fitting be-low what is to be expected from the residuals. There are also streaks of a likely secondary function closely to the median of the qq-plots, though the streaks are fitting closely to the 45-degree line. Therefore the residuals seem to be well fitted overall in all three regressions. Though, as a limitation to the examination of the residuals, no histograms have been avail-able after using fixed effects as a model of estimation, which could have been more usefull than qq-plots in the regressionwise examination of the residuals.
R-squared 0.998 Adjusted R-squared 0.998
F(46, 193) 3767.407 P-value(F) 4.2e-262
Log-likelihood 494.178 Akaike criterion -894.356
Schwarz criterion -730.7660 Hannan-Quinn -828.441
3.7 Limitations in the results and in dataset
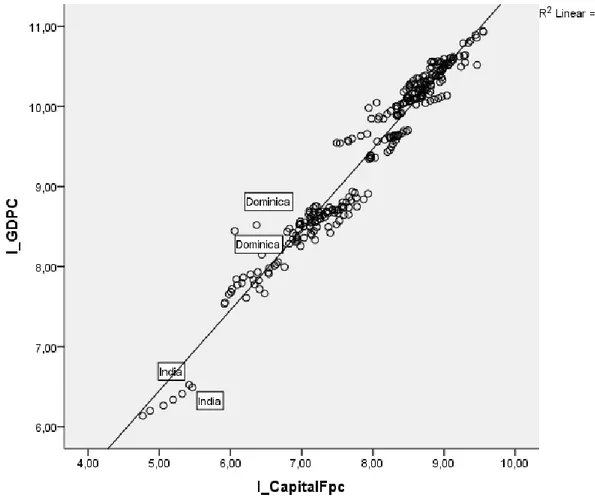
One flaw that should be pointed out is that the dataset although fixed, is unbalanced, it does not contain the same amount of observations for all groups and variables, which may cause some disturbance to the result. Mainly the unbalance would lay in the variables for education or possibly rarely in capital as the values for broadband spread and gdp growth have been the priorities of having a complete set of values for any country and year. By reviewing a plot of Log(capital) against log(GDP) from figure 2 in the appendix one can see that for this variable there are very few possibilities to detect an outlier and the fitline going through the plot has a high fit-value of 0.95. it seems to be a well fitted in general and no need of removal of observations.
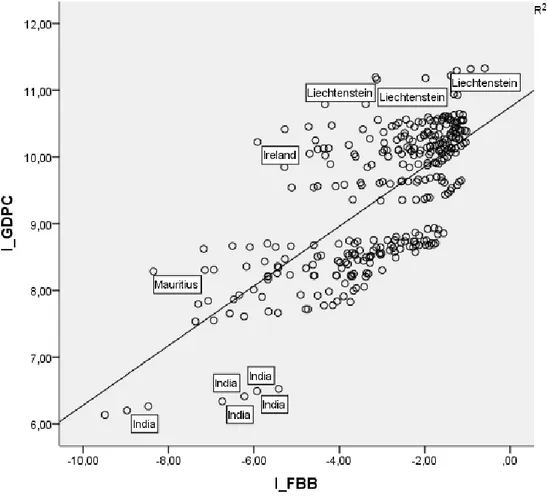
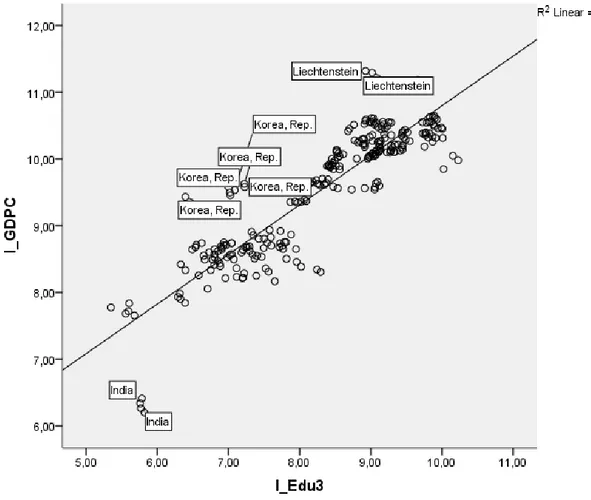
On the other hand in observing the plot of Log(broadband ) against Log(GDP) in figure 3 one can see several patterns. For instance at the bottom one may follow India as well as at the top Liechtenstein, where one may see a trend pattern, most likely from time series. Also it is possible to detect two other trends in terms of viewing the scatter as two major clusters and India at the bottom. If one looks closely one can detect that the clusters are located on either side of the line which would create different constants and possibly also estimates. Thus this variable by itself may be the very reason to why the statistics showed that the fixed effects model was the correct model. The pattern stemming from time series may be corrected by the time effects in terms of dummy-variables for each year except 2002. The second pattern regarding the two loosely figured clusters may be the reason to why there is a significant one way fixed effects, since it captures unobserved differences in this case the differences in the broadband variable and adjusts for individual constants αi. This should
theoretically shift the distances in residuals from this variable to give a closer fit of residu-als.
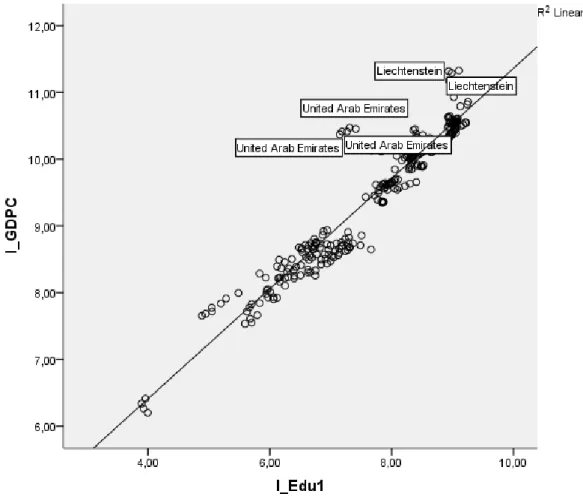
As for an outlier analysis in primary education growth against GDP it is hard to point out any clearcut outliers as most of the observations lie closely to the fit line. Only Liechten-stein and the United Arab Emirates may be considered outliers in some opinions, but it is doubtful if removal of either would affect the econometry.
As for the plot of secondary education it has a similar pattern to the plot of primary educa-tion against growth in GDP. There is some spread of the observaeduca-tions on each side of the line, the only countries coming close to possibly be considered outliers would be the Unit-ed Arab Emirates and India though neither are far from the fit line.
In the plot for tertiary education growth visavis growth in GDP the situation is slightly dif-ferent as the variance around the fit line is substantially larger and one could point out In-dia to be a clear outlier along with Liechtenstein and probably Korea Republic as their ob-servations are grouped noticeably far from the rest of the obob-servations and fit line.
For any regression with more than 100 observations and including three variables the lower limit from the Durbin-Watson table is 1.61 and the upper limit is 1.74, for seven variables the lower limit is 1.5279 and the upper 1.8262. Comparing the Durbin Watson values of the regressions to the statistical table show that all three of the regressions do test positive for autocorrelation with a rho between 0.54 and 0.60. As the absolute value of rho is defi-nitely smaller than 1 the effect of the autocorrelation will hopefully be limited.
Regarding multicollinearity, by examining the collinearity matrix in the appendix one can see that there are severe multicollinearity problems between capital and any of the
educa-variables, although not as severe. Therefore the results of the regression should be seen with causion based on the possible outcomes of multicollinearity such as the fact that coef-ficients may be strongly affected by the observations.
As the data is a panel type, the heteroskedastic behavior that might appear in the data would be in between groups, or countries in this case. Thus by running a modified Wald test for differing individual variances, it was detected that heteroskedasticity is indeed pre-sent in the dataset as the null hypothesis of all individual variances being equal was rejected. To remedy the heteroskedasticity, the heteroskedastic and autocorrelation consistent (HAC) estimation was used, which differs from the White robust standard errors (het-eroskedasticity consistent covariance matrix estimation, HCCME) estimation as it accounts for autoregressive heteroskedasticity. The standard errors did increase, leading to the rejec-tion of the estimates for Log(Edu2) and Log(Edu3) after the HAC robust standard errors where introduced.
4 Analysis
In all of the three regressions one can point out that most of the explanatory variables are significant, there are some small differences in between the regressions which one may compare. It is statistically confirmed here that by inducing fixed broadband subscriptions as a percentage coverage per person instead of using the more general A(t) one can see that technology does make a difference in the production function, as well as in the growth equation. Also it gives a statistical confirmation of that specific technologies may be subject to improve the economic welfare. If comparing this version of the production function to the original one can see that the major contribution comes from capital independently of the amount of human capital. Though as an interesting fact, the contribution from capital differs as one changes the type of human capital in the input. As the level of education be-comes higher, the contribution from human capital has a steady decline, where as the op-posite happens to capital, at least by judging from the beta-parameters in each regression. From regression 1 to 3 the estimated parameter for capital are 0.185, 0.213 and 0.256 com-pared to the estimates for education 0.141, 0.087 and 0.060 which do present opposite trends to each other. There is also an increasing trend for the estimated parameter for broadbands spread although the difference may not be as large as for the other variables, 0.017, 0.018 and 0.020. To say that the differences in broadband and the effect thereof may be directly caused by differences in human capital may be erroneous, though it may be a possibility.
If one compares the results in between each the variables, for each regression one can see that largest contribution to economic growth is capital, followed by human capital and at last the spread of broadband in the population. Therefore one may draw the conclusion of what factor matters the most, capital, followed by human capital and at last technology. This brings forth the priority to what one should satisfy first as well to a basic economic growth, thus it could explain why for instance less developed countries may have lower standards of the technology as shown later. The resources in the economy to stimulate economic growth are better put in the capital or human capital than in broadband technol-ogy even though there would be possibilities to improve human capital by using broadband technology.
By continuing the spread of broadband, there are still possibilities to increase the economic growth in most part of the world. Where one would be able to see the highest possibility to increase growth, would be most of the less developed countries, but on the other hand one would most likely see the causality in this that just because they have a low income per cap-ita this is an infrastructural improvement that is not likely to occur before other more nec-essary improvements. An interesting fact around this is according to ITU the broad-bandtype that increases the most in African countries is the mobile type of broadband which would mean less needs for physical infrastructure in and between metropolitan areas. This could reduce the cost in terms of the physical capital as well as the cost of mainte-nance and cost of installing the physical infrastructure.
Also, possible hidden effects are for instance the technology being a tool to academic jobs, where as human capital will be the major factor to the job getting done, while broadband could have the effect of enforcing the effect of human capital. Furthermore, the service sector in the economy benefits largely from the broadband technology by improving com-munications or giving means of operation for certain companies. To draw this argument further, if more people would be educated about the possibilities for use of broadband in
their business there exist a chance that it could increase the demand for broadband. This would in turn increase the spread and the economy with it.
The problematic aspect with doing a change in spread analysis, is that at the end, change would become negatively related or insignificant as the spread has been saturated, where the changes would not occur at any larger extent in the same type of broadband, similarily as to in a cumulative distribution, one would in the end not see any larger changes. There-fore this is one of the major limitations along with availability to continuous data on the global scale regarding several of the variables. With more observations one could derive re-gional differences as well as retrieving a higher likelihood of coming closer to a true esti-mation of the beta-coefficient. Gillet discusses this obstruction as well seeing that the level and number of observations are not as in depth as what is desirable. One of the theoretical solutions to the problem was “if data were available to identify the local cable franchise and/or ILEC in 1998, and this data predicted well the availability of broadband by 1999, such a variable could provide a control for early broadband availability that is not itself also related to economic growth.” (Gillet et al, 2006, p 16) This could have been a solution if it was not as problematic as it is, thus the true early base for broadband is not likely to be found, resulting in that it is very hard to predict what the original change to the economy was for approximately the first five-year-period.
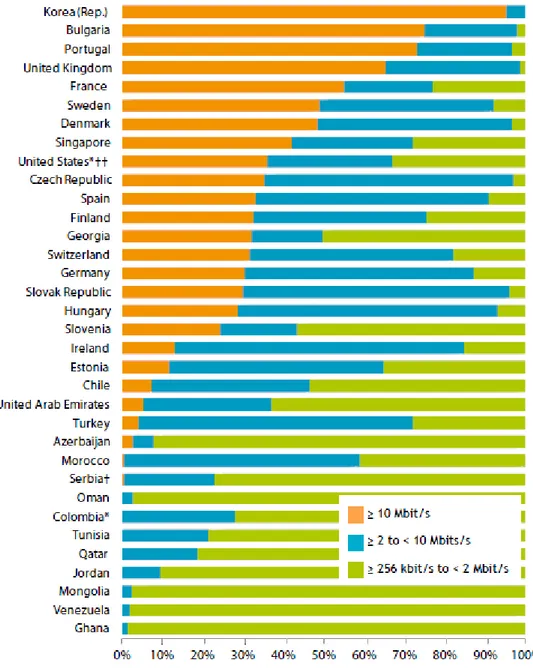
A further limitation in comparing broadband’s spread and its effect is how one may differ between generations of broadband types. A first class is already defined as one can define between fixed broadband a mobile broadband, but what the classification misses is the possibility to define differences in quality of the technology. If one could measure these differences one could narrow down further the effect of changes in this type of technology. Examples of the global differences can be made by pointing out the differences between Japan, Korea Republic, Sweden and the USA. By Meaning one could measure spread and quality effects unisonly and thus show what offers the greater contribution. A graphic illus-tration (albeit somewhat rough) demonstrate the global differences in quality
Figure 3 Showing difference in speed and spread thereof in the technology, ITU, The world in 2011: ICT facts and figures, source itu.org, p.6
Even in between the developed countries the differences in the technology is substantial, where though the different local classes of options for broadband may certainly be in be-tween the limits for what is described here as the ITU collects the data simplifies it. There-fore, the heterogeneity between the countries in terms of speed and its spread dictates a problem to how to statistically measure them. The point for this paper of this is that the basic technology may be statistically significant to alter the economic status, but to narrow it down further and to find a clearer causality it would be necessary to use either weighting techniques or dummy variables for each year and status to perfectly concentrate the effect. The question to this is if it is possible or economically feasible with respect to resources.
In addition, an argument that should be included to the discussion regarding broadband is the fact that ICT in general may be what one refers to as general purpose technology (GCT). Why ICT and thus broadband can be categorized as GCTs is because ICT may take place in any production or application, similarily to electricity in the beginning of the 20th century (David and Wright, 1999) that could be included as an technological
improve-ment in any production. The characteristics of GCT may also include some bias while measuring the technology and how it may affect the production and the economy. The ar-guments for the bias may include reasons as for instance the lag of time between the intro-duction of the technology and the time it takes for adjusting the prointro-duction to the new technology before it may be increasing the productivity in the production. Also the reason that on occasion the complementary investments into the application to the production or developments during time, may not be captured by the spread of the technology and there-fore leading to bias in measurement in the productivity. The bias in measurement would al-so include unmeasured intangible capital that have been created in adjustment processes or development processes may not have been captured in the empirical analysis. (Basu and Fernald, 2007) Another argument explaining why GPT would not increase economic growth is the fact of loss of resources devoted to change the production for the new tech-nology. The production would be lower due to the resources changing the production would not be productive to output, thus total output would diminish for the time and then increase when installments are completed and resources are once again devoted to produce to output. (Jacobs, Nahuis, 2002, p 248) Thus GPT could possibly as well affect economic growth negatively for a period of time.
Moreover, the factor stated in theory regarding the income elasticity to broadband could possibly show why broadband may advance faster in some countries than others, as men-tioned in some regions it may not be affordable resulting in that the spread growth is lower compared to what it could have been otherwise. An estimate made by the ITU for the price difference for a fixed broadband subscription between developed countries and developing countries is that by purchase power parity dollar (PPP$) a subscription “cost on average 190 PPP$ per month in developing countries compared to only 28 PPP$ per month in de-veloped countries.” (ITU, 2011, p7)Due to this problem there is another problem as well that may occur, the exacerbation of the poor as being poor and not affording a technology that could possibly improve the situation. This leads to a conclusion that while broadband may be deployed in an area, there is a need to apply measures to not let a social divide be-cause of broadband drain people further into poverty as the chances for improvement else would be diminishing.
To furthermore explain possibilities for low spread, the demand for broadband may be low due to low or none information as to what benefits broadband could provide or even how computers may aid business and personal life. Thus more information could increase the demand, making the market more profitable for more broadband providers. Better regula-tions for the rights-of-way argument or the unbundling argument could also provide to the increase in the broadband spread, which would in turn increase economic growth and ac-tivity contingent on that broadband would in fact stimulate growth.
What implication the growth factor spread of broadband has, contra the affordability along with intangible possibilities for development do comprise a problem. Perhaps not for the developed countries in the world, but for the LDCs in the world where broadband proba-bly could do have a greater effect of improving standards of economy, health and educa-tion by saving resources in inputs and creating new jobs. In some sense it is a possibility to restrain urbanization as well, by aiding the incentives to stay in rural areas. Given the