Contents lists available atScienceDirect
Journal of Controlled Release
journal homepage:www.elsevier.com/locate/jconrelSingle bead investigation of a clinical drug delivery system – A novel release
mechanism
E. Ahnfelt, J. Gernandt, Y. Al-Tikriti, E. Sjögren, H. Lennernäs, P. Hansson
⁎ Department of Pharmacy, Uppsala University, Box 580, 751 23 Uppsala, SwedenA R T I C L E I N F O Keywords: Microgel Drug delivery Release mechanism A B S T R A C T
Microgels, such as polymeric hydrogels, are currently used as drug delivery devices (DDSs) for chemother-apeutics and/or unstable drugs. The clinical DDS DC bead® was studied with respect to loading and release, measured as relative bead-volume, of six amphiphilic molecules in a micropipette-assisted microscopy method. Theoretical models for loading and release was used to increase the mechanistic understanding of the DDS.
It was shown that equilibrium loading was independent of amphiphile concentration. The loading model showed that the rate-determining step was diffusion of the molecule from the bulk to the bead surface (‘film control’). Calculations with the developed and applied release model on the release kinetics were consistent with the observations, as the amphiphiles distribute unevenly in the bead. The rate determining step of the release was the diffusion of the amphiphile molecule through the developed amphiphile-free depletion layer. The re-lease rate is determined by the diffusivity and the tendency for aggregation of the amphiphile where a weak tendency for aggregation (i.e. a large cacb) lead to faster release. Salt was necessary for the release to happen, but at physiological concentrations the entry of salt was not rate-determining. This study provides valuable insights into the loading to and release from the DDS. Also, a novel release mechanism of the clinically used DDS is suggested.
1. Introduction
Microgels from synthetic or naturally occurring polymers, is an es-tablished type of drug delivery systems (DDSs) for chemotherapeutics and/or unstable drugs, such as proteins and peptides [1,2]. Future successful drug delivery research and development require multi-disciplinary and novel approaches to solve issues for complex and novel types of active pharmaceutical ingredients (APIs) [3,4]. Drug release from the gel matrix can be controlled by reducing drug diffusion, most commonly via sterical hindrance and/or by electrostatic interaction mechanisms. An additional benefit of electrostatic interactions between APIs and gel networks is that they enable a high drug loading capacity. The release from charged microgels is often considered to be mediated by an ion exchange mechanism where the drug is replaced by electro-lyte ions entering from the release medium. Many microgel DDSs have been designed based on this principle [5]. However, little attention has been given to the importance of self-associating properties of the drugs. Drug aggregates in solutions have been characterized by thermo-dynamic measurements and static light scattering, both in combination with simple models of self-assembly [6], but there are very few studies providing structural information about them [7,8]. One of the few
direct evidences of a larger structure is a cTEM image of fiber-like doxorubicin (DOX) assemblies induced by divalent anions inside lipid vesicles [9]. And more recently, it was suggested that DOX self-as-sembled into long supramolecular aggregates of hundreds of DOX molecules in the presence of sufficient NaCl concentrations [10].
Although the interactions of simple surfactants and polyelectrolyte gels have been investigated in great detail, the more clinically relevant amphiphilic drugs have not [11]. It has been shown that ionic surfac-tants spontaneously bind to oppositely charged gels by replacing counterions bound to the charged network. The driving force behind this is attributed to the hydrophobic effect, which allows the surfactant to form micelles stabilized by electrostatic interactions with the charged network [12,13]. The replacement of small ions by surfactant micelles leads to a reduction in osmotic swelling pressure, which causes a decrease in gel-volume in weakly crosslinked networks [14]. During intermediate surfactant loadings the distribution of surfactant inside the gels is typically non-uniform (core-shell), an effect attributed to polyion-mediated attraction between surfactant micelles [15,16] and the hydrophobic effect [17]. Similar investigations of clinically used positively charged amphiphilic drugs with differences in flexibility and degrees of substitution is warranted to elucidate whether the same
https://doi.org/10.1016/j.jconrel.2018.11.011
Received 11 September 2018; Received in revised form 6 November 2018; Accepted 8 November 2018
⁎Corresponding author.
E-mail address:per.hansson@farmaci.uu.se(P. Hansson).
Journal of Controlled Release 292 (2018) 235–247
Available online 10 November 2018
0168-3659/ © 2018 The Authors. Published by Elsevier B.V. This is an open access article under the CC BY-NC-ND license (http://creativecommons.org/licenses/BY-NC-ND/4.0/).
mechanisms apply for these molecules.
There are several DDS microparticles in clinical use, for example DC bead®, HepaSphere™, Tandem™, and LifePearl™. The hydrogel DC bead® is currently available in three size ranges, covering a diameter-range of 70–700 μm. It is an ion-exchange hydrogel consisting of polyvinyl alcohol (PVA), integrated with negatively charged 2-acryla-mido-2-methylpropanesulfonate (AMPS) [18]. Loaded with DOX (maximum loading of 45 mg DOX per ml beads) or irinotecan (IRI), the beads are used clinically for treating liver cancer [18–20].
The release of DOX and IRI from the beads has been investigated [21], but without systematically exploring the importance of their amphiphilic properties. Recently, a theoretical model was used to in-vestigate whether the release of DOX from the beads was governed only by ion exchange, or if the internal drug aggregation must be considered [22]. The results confirmed that salt was required for the release of DOX. However, internal drug aggregation, drug-PVA interactions, and the equilibrium between protonated and deprotonated DOX, were also important. The applied model involved certain passumptions re-garding the distribution of DOX inside the beads, which limited the analysis [22].
The aim of this study was to further investigate and elucidate the bead–drug interactions in the DDS, and their implications for the me-chanism(s) of drug release. To accomplish this, molecular binding, distribution and in vitro release were investigated using micropipette-assisted microscopy and the μDISS profiler, respectively. Five model
substances—dodecylpyridinium chloride (DOPC), cetylpyridinium chloride (CPC), chlorpromazine hydrochloride (CHL), amitriptyline hydrochloride (AMI), and adiphenine hydrochloride (ADI)—known to form micellar-like aggregates in aqueous solution were selected (Fig. 1 andTable 1). Additionally, the clinically relevant doxorubicin hydro-chloride (DOX), known to aggregate at low concentrations [23–25], was investigated. An improved theoretical transport model was derived accounting for electrokinetic effects and local micelle–monomer equi-librium.
2. Materials and methods
2.1. Chemicals and gels
Dodecylpyridinium chloride, cetylpyridinium chloride, chlorpro-mazine hydrochloride, amitriptyline hydrochloride, adiphenine hy-drochloride, all obtained from Sigma-Aldrich, Germany, and doxor-ubicin hydrochloride purchased from Toronto Research Chemicals, Canada, were all used as received. All solutions were prepared in MilliQ water and all chemicals were of analytical grade. NaCl was obtained from Sigma-Aldrich, Germany. Rhodamine 6G (Sigma-Aldrich, Germany) and pyrene (Janssen Chimica, Belgium) were used as fluor-escent probes. The investigated beads, DC bead®, were purchased in sizes 100–300 and 300–500 μm (Biocompatible, UK).
Fig. 1. Molecular structures of the six investigated amphiphiles. A) Dodecylpyridinium. B) Chlorpromazine. C) Amitriptyline. D) Adiphenine. E) Cetylpyridinium. F) Doxorubicin.
Table 1
Critical micelle concentration (cmc), molar mass, pKa, and diffussion coefficient (D) of investigated substances.
Substance cmc (mM) Molar mass (g/mol) pKa D (×10−6cm2s−1)
Dodecylpyridinium chloride 17.8a 284 – 4.7b
Cetylpyridinum chloride 0.9c 358 – –
Chlorpromazine hydrochloride 19d– 22e 355 9.2f 6.92e
Amitriptyline hydrochloride 30e– 36d 314 9.4g 6.95d
Adiphenine hydrochloride 40h 348 9.0i 6.9j
Doxorubicin hydrochloride 1l 580 7.3, 8.5, and 9.5k –
a From reference [50] b From reference [31] c From reference [45] dFrom reference [51] e From reference [52] f From reference [53] g From reference [54] hFrom reference [55,56] i From reference [57]
j Based on the diffusion coefficients of chlorpromazine and amitryptiline l Forms aggregates of 40 molecules at 1 mM, from reference [23] k From reference [58]
2.2. Micropipette-assisted microscopy
A micropipette-assisted microscopy technique was used to study the volume change and the morphology of a single bead in a controlled fluid flow (Fig. 2A) [26]. The bead was held in place with a micro-pipette prepared in two steps from G-1 glass capillaries. First, the ca-pillary was pulled into two parts using a pipette puller PN-31 (Nar-ishige, Japan). The edge of the capillary was then polished with a microgrinder EG-400 and a microforge MF-900, both from Narishige, Japan. The prepared micropipette was connected to a microinjector (IM-11-2, Narishige, Japan), which was used to generate suction through the capillary to hold and position the bead. A Petri dish was placed on an optical light microscope (Olympus Bx-51, Olympus, Japan) equipped with a DP digital camera (Olympus, Japan). A peri-staltic pump (Pharmacia, Sweden) with a single-pass continuous fluid flow with a rate of 8 ml/min was connected to a 2 mm diameter glass flow-pipette. The micropipette holding the bead was introduced into the flow pipette, and the bead was positioned at the center of the fluid flow (Fig. 2A). Another flow pipette connected to a peristaltic pump discarded the solution, giving a constant fluid volume in the Petri dish. Loading or release of the selected model substances to the bead could be induced by changing the solution in the flow pipette [26]. Pictures of the bead were taken at given time-points and the bead diameter was determined with the camera software (Olympus cellSense Dimension, Japan). The volumes of the beads were calculated assuming that the beads were spherical [18,19] and the data were presented as mean values with standard deviations (SD).
2.3. Bead charge content
The concentration of network–bound sulfate groups in beads was determined by a method developed earlier [27]. A small volume of the beads was transferred from the manufacturers vial to a custom-made microscopy cell and thoroughly rinsed with 10 mM NaCl aqueous so-lution, where salt was present to increase the contrast between beads and liquid. A picture of the beads spread out on the bottom of the cell was taken and analyzed with a software (https://imagej.nih.gov/ij/) that provides a list of the diameters of all spherical objects in the image from which the total bead volume was calculated. A coverslip con-taining a μm-scale (Olympus Tokyo) was used to calibrate the scale settings in the program to ensure correct size determination of the beads. The beads were then transferred to a Kjeldahl flask for de-termination of sulfur content with mass spectrometry. Prior to analysis the contents of the flask were mixed with 2 ml hydrogen peroxide and 4 ml nitric acid and diluted to 10 ml to degrade the polymer network. Two blanks containing bead-free NaCl solutions were treated in the same way. The whole procedure was carried out three times. For each sample the sulfur content was analyzed at two different wavelengths (180.731 and 182.034 nm). The sulfur concentration in the microgel
beads could be calculated from the average values, as 75.4, 58.6 and 59.9 mM, respectively. The estimated concentration of sulfate groups in a bead in equilibrium with 10 mM NaCl solution was 65 ± 9 mM, based on all three individual determinations.
2.4. NaCl effects
The changes in volumes for beads of 100 to 500 μm diameters were investigated in NaCl solution in the interval of 1.0–150 mM. The bead was equilibrated in a continuous flow of MilliQ water. The MilliQ water was exchanged to NaCl solution, which was pumped through the flow pipette, thereby exposing the bead to the NaCl solution. When the bead volume had adjusted to the new NaCl concentration the medium was exchanged to MilliQ water, and the procedure repeated for another NaCl concentration.
2.5. Amphiphile solutions
The bead-volume changes for beads of 200 μm diameters were in-vestigated in amphiphilic solutions. DOPC, CHL, AMI, and ADI were prepared in solutions of falling concentrations; cmc, cmc/10, cmc/100 and cmc/1000. In addition, the bead-volume change was investigated at different concentrations for DOX (0.02, 0.02 and 2 mM) and CPC (0.02 and 0.9 mM).
A schematic flow-chart of the solutions used in the micropipette-assisted microscopy experiments is shown inFig. 2B. The beads were equilibrated in MilliQ water. Then the solution was exchanged to sur-factant or amphiphilic drug solution to load the beads with the am-phiphile molecule. When the bead volume had relaxed to a new level the medium was changed to NaCl (150 mM), which initiated the release of the loaded amphiphile molecules and an increase in bead volume. When the bead volume reached a plateau the NaCl solution was changed to MilliQ water, which was pumped through the flow pipette until the bead regained its original size.
2.6. Fluorescence microscopy
The use of fluorescence microscopy with a UV-lamp (Olympus U-RFL-T, Japan) enabled the investigation of the distribution of molecular aggregates inside the bead. To investigate if the polymer network itself had any fluorescence, approximately 300 μl beads were placed in a Petri dish containing MilliQ water. MilliQ water was gradually replaced with acetone to increase the internal polymer concentration by indu-cing shrinking of the beads. Thereafter, investigations of amphiphile aggregation inside a single bead (200 μm) were performed as described in “Amphiphile solution” with fluorescence microscopy. The in-vestigations were performed at cmc or cmc/10 depending on the quality of the micrographs taken. For DOPC (1.78 mM), rhodamine 6G (mole fraction 1.9 × 10⁻⁵) was added as a fluorescent probe, and the applied
Fig. 2. A) Schematic illustration of the micropipette-assisted microscopy set-up. The selected solution is pumped by single-pass through the flow pipette, giving a continuous flow over the inserted bead. The bead is positioned inside the flow pipette with a micropipette and the suction of a microinjector enables holding of the bead. The bead is monitored using light or fluorescence microscopy. B) Schematic illustration of the exchange of solutions in the micropipette-assisted microscopy set-up. C) Schematic illustration of the free-flowing method used in the μDISS profiler.
filter was TRITC (U-MWIGA3) with excitation 530–550 nm, dis-criminating filter of 570 nm and emission of 575–625 nm. In the case of AMI (36 mM), pyrene (mole fraction 2.8 × 10⁻⁴) was used as a
fluor-escent probe, whereas both CHL (19 mM) and ADI (4.0 mM) showed fluorescence without addition of a fluorescence probe. The filter ap-plied for AMI, CHL and ADI was DAPI (U-MVU2) with excitation 330–385 nm, dichroic mirror/discriminating filter of 400 nm and emission (long pass) of 420 nm.
2.7. Free-flowing release in μDISS profiler
A μDISS profiler with a free-flowing method (Fig. 2C) was used to investigate the release rate of the four model substances (DOPC, CHL, AMI, and ADI) from the investigated beads [22,28]. Each channel of the μDISS profiler was individually calibrated with stock solutions against a standard curve. The μDISS profiler measured the concentration of am-phiphile substance using the area under the concentration wavelength curve of the second derivate spectrum [29]. The wavelength intervals were as follows: DOPC 280–285 nm, CHL 300–320 nm, AMI 270–295 nm, and ADI 270–278 nm.
To load the beads, one ml of 100–300 μm beads were equilibrated at room temperature over night with the amphiphile solution in a 20-ml syringe. The beads were examined in a light microscope and were considered fully loaded when their visual appearance matched the vi-sual appearance of micropipette-assisted microscopy experiments. The loading solution was discarded from the syringe using an 18 G filter needle (Becton Dickinson, New Jersey, USA), and MilliQ water was added to the remaining beads, giving a bead-water slurry with a ratio of 1:1.
The release experiment was initiated by transferring 50 μl of the bead-water slurry to a glass vial containing 20 ml of 150 mM NaCl. The release experiment was performed at room temperature (approximately 22 °C) and the release medium was stirred at 100 rpm using a Teflon coated magnet. The data are presented as mean values with SD.
3. Theory
3.1. Loading model
Consider a spherical bead of volume V with n moles of amphiphile molecules exclusively partitioned to a homogeneous shell in the out-ermost layer. Let β be the the amphiphile-to-polymer charge ratio in the bead and f the local polymer-to-amphiphile charge ratio in the shell:
= n np (1) = f n n ps (2) where npand npsare the number of moles of polymer charges in the bead and in the shell, respectively. By introducing the volume per mole of polymer charges in the shell (vs), in the core (vc), and in the am-phiphile-free bead (v0) we can write:
= + = + V n v n n v n n v f v f 1 (1 ) p s ps p c ps p s c (3) For vc= v0we have: = = = V V V v n V v n v v f 1 1 p c p s c 0 0 (4)
where V0is the volume of the amphiphile-free bead prior to loading.
The steady-state rate of transferring n moles of amphiphilic mole-cules from the liquid bulk to the surface of the bead can be calculated from Eq.(5):
= dn
dt ss 2 r ShD Cb ( cac) (5)
where rbis the bead radius, Sh is the Sherwood number, D is the diffu-sion coefficient of the amphiphile in the liquid (seeTable 1), C is the concentration of amphiphile in the bulk, and the critical aggregation concentration (cac) is the concentration of amphiphile in the liquid at
rb. Sh is related to the Reynolds (Re) and the Schmidt (Sc) numbers:
= + Sh 2.0 0.6Re1/2Sc1/3 (6a) = Re 2v rb (6b) = Sc D (6c)
where v is the flow rate of the liquid, ρ is the liquid density, and η is the liquid viscosity. Eq.(6a)is valid as a good approximation for single spheres under conditions of forced convection at moderate flow rates (Re < 20) [30].
Assume that the rate of bead volume-change is controlled by the rate of amphiphile loading and that the latter process is determined by the transfer of amphiphile to the bead surface according to Eq.(5)(film control). Using Eq.(1)the loading rate can be written as:
= d dt r v ShD C cac R 3 ( ) 2 ss b 0 03 (7)
where R0is the bead radius at time zero. By substituting for rbusing rb/
R0= (V/V0)1/3= (1 − (1 − vs/vc)fβ)1/3, Eq.(7)can be integrated (for
the full derivation see Supporting information) to give:
= V t V kt ( ) (1 ) 0 3/2 (8a) = k ShD C cac v v f R ( )( ) 2 s 0 02 (8b)
Eq.(8a-b) is valid for constant k, the validity of which will be dis-cussed later.
Theoretical volume relaxation curves were calculated by means of Eq.(8a-b) with parameters relevant for the DOPC systems inFig. 3:
D = 4.7 × 10⁻⁶cm2s−1[31]; v
0= 0.022 m3/mol; vs= 0.002 m3/mol;
R0= 100 μm; f = 1.1; cac = 0; Sh = 30. Here, Sh was calculated from
Eqs.(6a-c)by setting rb=R0, i.e., neglecting variations of the ‘stagnant
layer’ thickness, a good approximation for a large part of the curve [26]. The liquid flow rate v was set to twice the measured average li-quid velocity in the flow-pipette, consistent with a parabolic velocity profile [30] and the bead positioned at the center of the pipette [26]. v0
was determined as described in the experimental section. vswas ob-tained by setting vs/v0= V∞/V0= 0.1, meaning that the volume per
polymer charged group in the shell is assumed to be the same as that in the fully collapsed homogeneous bead. f was used as a global fitting parameter [16,26,32].
3.2. Lag time
In the above equations cac is defined as the concentration of am-phiphile in the liquid in local equilibrium with the aggregated mole-cules in the shell, and Eq.(8aa-b) describe how the bead volumes vary with time after the shell appears on the bead surface. Assume that ag-gregation of the amphiphile starts when the concentration inside the bead reaches a critical value, denoted cacb, and that the lag time tL needed to reach that concentration coincides with the onset of shrinkage [33]. Under the experimental conditions of interest there was no simple electrolyte present in the solution. At time zero all network counterions (Na+) are in the bead and the concentration of the
am-phiphile (D+) and its counterion (Cl−) are uniformly distributed in the
established at the bead boundary, mediated by the ion exchange be-tween Na+and D+(Cl−is assumed to be excluded by a Donnan
po-tential). By assuming that the ligand in the bead has the same pre-ference for Na+ and D+ (below cac
b) the equilibrium condition
becomes: = + C C C C r (9) where Cris the concentration of D+in the liquid at the bead boundary,
C′is the concentration of D+ in the bead, and C
+′is the total
Fig. 3. Bead volume-change during binding and release of surfactant and amphiphilic drug solution to 200 μm beads in micropipette-assisted microscopy. A) Binding of dodecylpyridinium 0.0178–17.8 mM. B) Release of dodecylpyridinium 0.0178–17.8 mM in 150 mM NaCl. C) Binding of chlorpromazine 0.019–19 mM. D) Release of chlorpromazine 0.019–19 mM in 150 mM NaCl. E) Binding of amitriptyline 0.036–36 mM. F) Release of amitriptyline 0.036–36 mM in 150 mM NaCl. G) Binding of adiphenine 0.04–40 mM. H) Release of adiphenine 0.04–40 mM in 150 mM NaCl.
concentration of counterions in the bead (Na++ D+). This is valid
during binding without extra salt in the system and it is assumed that the chloride ions are evenly distributed in the solution (see Fig. S1 for a schematic illustration). At every instance, the rate of transferring D+
from the bulk liquid to the bead surface is assumed to be given by Eq. (5)with cac replaced by Cr(t). With =n C4 rb3/3and by substituting for Crusing Eq.(9), the rate of increasing the concentration of D+in the
bead under conditions of film control is obtained:
= + dC dt ShDC r C C 3 2b2 1 (10)
The integrated form of (10) can be used to express the time for C′to
reach cacb: = + + t r C ShDCln cac C 2 3 1 L b b 2 (11) For cacb≪C+′, Eq.(11)simplifies to tL 23r cacShDCb b
2
.
3.3. Release model 3.3.1. Overview
Being an improvement of a previous theory [22], the current ob-jectives were: (i) to make no presumption about the distribution of amphiphile within the bead during release and (ii) to take the electric coupling of the diffusion of charged species into account. Meanwhile, fitting parameters should be kept at a minimum, only including such parameters that have an actual predictive value.
Consider a system consisting of a spherical gel bead immersed in the surrounding solution. Apart from the polymer in the bead, the system contains water, a cationic amphiphile and a univalent salt. The am-phiphile may exist as free ions of permanent charge, or as aggregates of a fixed aggregation number N and charge, interconvertible through the physical reaction
N free amphiphile ions aggregate (12)
The polymer in the bead facilitates this reaction, shifting the equi-librium concentration of free amphiphile towards lower values. The aggregates are considered immobilized by interactions with the (like-wise immobile) polymer chains, meaning that they only form and dis-solve locally in equilibrium with the local concentration of free am-phiphile. Water is treated as being in excess and not explicitly taking part in the transport process. This means that volume changes of the bead and any accompanying convective fluxes within it are ignored, a simplification than can be justified by the relatively small volume changes that were observed experimentally during release of amphi-phile.
The mobile components of the system are the free amphiphile ions and the monovalent salt ions; these three species move through the system according to their own unique diffusivities, unaffected by the gel. However, being charged species, their movements are coupled through the requirement of large-scale electroneutrality. This coupling is included in the form of Nernst-Planck flux equations and Gauss' law, physically equivalent to the Poisson-Nernst-Planck- theories [35]. This is a standard method in various fields of science, even though it does not conserve momentum and does not ensure non-negative entropy production.
The surrounding solution is well stirred and large enough to maintain a constant concentration of all species. Between the bead and the solution is a stagnant layer of a constant thickness equal to all species, determined by the Sherwood number (Eq. (6)).
The time-and-space evolution of the concentrations in the bead and stagnant layer can then be solved by a numerical procedure. It is ne-cessary to solve for the time evolution because the system will generally not reach a steady state during release.
3.3.2. Transport equations
For the set of time-dependent fields of concentration ci(r,t) the equations to solve are conservation laws for the amphiphile and salt ions, = c r t t J r t ( , ) div ( , ), i i (13)
Nernst-Planck equations for the fields of flux Ji(r,t) of free amphi-phile and salt,
= J r t D c r t r q k Tc r t E r t ( , ) ( , ) ( , ) ( , ) , i i i i B i (14)
and Gauss' law for the quasi-static electric field E(r,t),
=
E r t q c r t
div ( , ) i i( , ). (15)
The equations depend on the charges qiand diffusion coefficients Di of the species, the permittivity ε of the medium and the thermal energy
kBT. The system is reduced to a single polar space coordinate r by the assumption of spherical symmetry.
The relaxation time of the aggregation reaction should be very small on the diffusive time scale. Two separate conservation laws for the free amphiphile and aggregate would include production terms with un-known rate constants. To avoid these free parameters, the proportions between free and aggregated amphiphile can be required to satisfy a condition of local equilibrium. This eliminates a variable and leaves a single conservation law for the total concentration of amphiphile
cf+ Nca, in which the flux comes only from the free amphiphile.
3.3.3. Condition for local equilibrium
The free amphiphile is always in local equilibrium with aggregated amphiphile everywhere inside the bead. If the free amphiphile is ideally mixed and the solvent is in large excess, equilibrium requires that
= +
Nlncf lnca NWa, (16)
where N is a constant aggregation number and Wathe change in free energy per amphiphile molecule of the aggregation reaction in units of
kBT (including standard state differences, entropy loss of confinement and hard-sphere excluded volume, hydrophobic effects and electric interactions). For convenience, Eq.(16)can be used to define cfand ca explicitly as functions of the total amphiphile concentration cf+ Ncain the form of a cubic spline.
For sufficiently large N, Wadetermines a cacbaccording to
cacb exp(Wa). (17)
For simplicity, Wais taken to be a constant depending only on the amphiphile and treated as a direct representation of the cacbinside the bead. The constant Wais a simplification to the theory and must be expected to limit its applicability to a certain range of aggregate con-centrations. Realistically, Washould depend in a non-trivial way on (at least) the concentration of aggregates and salt.
3.3.4. Parameters
Bead diameter and charge concentration were chosen by calculating time averages (trapezoid quadrature rule) from the release experiments, based on the measured polymer charge contents and the observed vo-lume changes. For the CHL experiment (having the largest number of measured points), this resulted in a bead diameter of 150 μm and charge concentration of 150 mM. While the calculated release times depend on the size and amount of polymer charge in the bead, the qualitative behaviour is insensitive to variations in these parameters.
Diffusion coefficients of sodium and chloride ions were set to 1.3 × 10⁻⁵cm2s−1 [36] and 2.0 × 10⁻⁵cm2s−1 [36], respectively,
whereas that of the amphiphile was tested in the range of 2 × 10⁻⁶cm2s−1(DOX) to 7 × 10⁻⁶cm2s−1(CHL). The permittivity
flow rate was set to twice the average flow rate in the experiment, as described in the binding model. This results in a stagnant-layer thick-ness of about 10% of the bead diameter, only slightly dependent on the diffusion coefficient.
The aggregation number was set to 50, which is reasonable for a variety of self-assembling substances [10,23,38]. This number is large enough to yield a well-defined cacb, which is the only function of this parameter in the present theory. It does not otherwise affect the transport kinetics.
The cacb was chosen in the range of 0.25–2 mM to reproduce the experimentally observed release rates (excluding DOX and CPC, where information on release time was incomplete). The cacbis the only free parameter in the model and reflects the accuracy of the approximations. If an unrealistic cacbis required to reproduce correct release rates, it is likely that some important effect has been neglected.
3.3.5. Solution
The system of coupled partial differential equations (Eqs.(13)–(15)) was solved by an implicit finite-difference scheme, similar to the classic method of Brumleve and Buck in 1978 [39]. The domain of the problem was defined to include the bead and the stagnant layer, with a larger density of points around the discontinuous bead surface. As boundary conditions, constant concentrations of all species were required at the well-stirred boundary while zero flux and electric field was required at the bead center. As initial conditions, the bead was considered to be equilibrated with a dilute amphiphile solution (no extra salt such as sodium and chloride ions). To be consistent with the transport equa-tions, the uniform concentrations of free amphiphile, aggregate and counterion in the bead in this state were determined by a Donnan equilibrium together with the aggregation equilibrium condition (Eq. (16)).
4. Results and discussion
4.1. Response to osmotic stress
The responses of the beads to osmotic stress was investigated using the micropipette-assisted microscopy method by exposing single beads with diameters of 100–500 μm to solutions containing 1–150 mM NaCl. The bead volume in salt solution relative to that in pure water (VNaCl/
V0) is shown as a function of NaCl concentration in Fig. S2. The volume
ratio decreased with increasing salt concentration to reach a value of 0.34 at 50 mM NaCl. In the interval 50–150 mM NaCl the swelling degree was nearly constant.
4.2. Loading of surfactants and amphiphilic drugs
The interaction between the beads and amphiphiles were in-vestigated with the flow-pipette microscopy technique. The relative volume (V/V0) of single beads in amphiphile solutions of different
concentration is shown inFig. 3as a function of time, where V0is the
bead volume in MilliQ water. All systems showed an initial lag period, characterized by insignificant volume change. For the lowest amphi-phile concentration there was a slight initial volume increase. The origin of that is not known to us; for a discussion of possible explana-tions, see Supporting Information. After the lag period, the volume decreased at a rate depending on the concentration in the solution, to reach a constant small volume after 100–1500 s. For DOPC, CHL, AMI, and ADI the final volume (V∞) was around 10% of the initial volume,
independent of the concentration in the solution (Table 2). The volume change is much larger than that caused by the addition of NaCl (see above). This shows that shrinkage induced by the amphiphiles was not simply due to an increase of the osmotic pressure in the solution. In-stead, it must be attributed to substantial loading of the amphiphile and self-assembly inside the beads. This is in agreement with the behavior of regular surfactant loading into oppositely charged gels [11,40,41], where shrinkage has been shown to be a consequence of surfactant micelles replacing the network counter ions. In those systems, volume changes similar to the ones observed here typically require bound surfactant-to-network charge ratios (β) as high as 0.8 [13]. The con-centration of network charges in the beads in the fully contracted state is ca. 400 mM, based on the estimated charge content of the network in 10 mM NaCl (see Experimental section) and the bead salt-response data in Fig. S2. This means that for β≥0.8, the amphiphile concentration in the fully contracted state is at least an order of magnitude larger than the cmc for all substances studied here. The critical aggregation con-centration inside the bead (cacb) is expected to be lower than cmc [13]. The conclusion is that most of the amphiphiles inside the beads are aggregated.
Fig. 4(left panel) shows representative pictures of the beads during loading of amphiphiles in the micropipette-assisted microscopy method. A shell could always be observed with the light microscope at the rim of the bead soon after shrinkage started. The shell grew in thickness and a sharp core/shell boundary could be seen migrating towards the center of the bead. DOPC, CHL, AMI, and ADI showed si-milar behaviors with only minor differences in coloration and shell thickness. In light microscopy, a homogeneous sphere with refractive index different from that of the surrounding medium can display a dark field at the rim, easily mistaken for a shell. This is due to the reflection of the incoming light at large incidence angles [42]. However, fluor-escence microscopy confirmed that the amphiphiles were mainly par-titioned to the shell during the binding process (Fig. 4).
DOPC appeared to be uniformly distributed in the bead when the experiment was interrupted (Fig. 4). This is the expected behavior of regular surfactants under the present conditions, where the con-centration in the solution is fixed [16]. CHL, AMI, and ADI appeared to be non-uniformly distributed, as shown by the fluorescence images (Fig. 4). The reason for this is not clear; for a discussion, see Supporting Information.
Table 2
The volume changes of the beads induced by the surfactant and amphiphilic drug solution in the flow-pipette method here presented as the mean V∞/V0and standard
deviation ( ± SD). The lag time (tL) in s is presented for the lowest concentrations.
Dodecylpyridinium Chlorpromazine Amitriptyline Adiphenine
Conc (mM) 17.8 19 36 40 V∞/V0 0.11 ± 0.01 0.11 ± 0.01 0.10 ± 0.00 0.11 ± 0.01 Conc (mM) 1.78 1.9 3.6 4 V∞/V0 0.10 ± 0.00 0.09 ± 0.01 0.09 ± 0.01 0.12 ± 0.00 Conc (mM) 0.178 0.19 0.36 0.4 V∞/V0 0.10 ± 0.00 0.10 ± 0.01 0.10 ± 0.01 0.13 ± 0.01 Conc (mM) 0.0178 0.019 0.036 0.04 V∞/V0 0.11 ± 0.01 0.09 ± 0.00 0.11 ± 0.00 0.14 ± 0.01 tL(s) 132 145 151 230
4.3. Rate determining step during loading
The loading kinetics were evaluated by comparing the recorded volume relaxation curves with theoretical curves calculated from Eq. (8a-b). The result for DOPC is shown in inFig. 5A. The experimental
data are the same as inFig. 3A, but shown without error bars and with data for an additional concentration of DOPC concentration added. The theoretical curves have been adjusted horizontally to start where the experimental lag phase ends. Apart from that, all curves have been calculated with the parameters given in ‘Loading model’ except for the
Fig. 4. A) Binding to bead with dodecylpyridinium (17.8 mM) in light microscopy (above) and dodecylpyridinium (1.78 mM) in fluorescence microscope (below). B) Release of dodecylpyridinium from bead with 150 mM NaCl in light microscope (above) and fluorescence microscope (below). C) Binding to bead with chlorpro-mazine (19 mM) in light microscopy (above) and in fluorescence microscope (below). D) Release of chlorprochlorpro-mazine from bead with 150 mM NaCl in light microscope (above) and fluorescence microscope (below). E) Binding to bead with amitriptyline (36 mM) in light microscopy (above) and amitriptyline (3.6 mM) in fluorescence microscope (below). F) Release of amitriptyline from bead with 150 mM NaCl in light microscope (above) and fluorescence microscope (below). G) Binding to bead with adiphenine (40 mM) in light microscopy (above) and adiphenine (4.0 mM) in fluorescence microscope (below). H) Release of amitriptyline from bead with 150 mM NaCl in light microscope (above) and fluorescence microscope (below).
amphiphile concentration. Eq.(8a-b)is valid for core-shell beads when the process controlling the shrinking rate is the mass transfer of the amphiphile from the bulk liquid to the bead surface (‘film control’). Agreement between theory and experiment indicates that this is the case for the three lowest concentrations (Fig. 5A). At the highest con-centrations investigated, the shrinkage rate is overestimated by the model, indicating that the process is influenced by molecular transport in the beads. Comparison between the systems inFig. 3shows that AMI, CHL, and ADI display the same behavior, which supports the idea that shrinkage is directly related to aggregation inside the beads.
4.4. Relationship between cacband cmc
The lag phase observed prior to shrinkage for all the amphiphiles increases with decreasing concentration in the solution (Fig. 3). This is in agreement with expectations for a film-controlled process in which shrinkage starts when the concentration of amphiphile inside the beads exceeds a critical value. In Eq.(11)the critical concentration is equal to
cacb, i.e., the critical aggregation concentration of the amphiphile inside the bead. The relationship was used to calculate cacb for the in-vestigated amphiphiles from the lag times determined at the lowest
concentrations inFig. 3. The diffusion coefficients used in the calcula-tions are given inTable 1. The result is presented inFig. 5B as a plot of
cacbvs. cmc. The correlation between the values (cacb= 0.72 × cmc – 7.6 with a r2of 0.99) supports the hypothesis that the shrinkage is
di-rectly related to the formation of aggregates inside the beads. Fur-thermore, it shows that amphiphilic drugs with a large tendency to form micelles in pure water also has a large tendency to form micelles in the beads. All cacbvalues are in the millimolar range and 2–3 times smaller than the corresponding cmc values. This is in agreement with previous studies of surfactant self-assembly in polyelectrolyte gels [13]. In-vestigations of surfactants also show that cac is typically much lower than cacb, where cac is the concentration of surfactant in the liquid solution in (local) equilibrium with the beads (see above). This explains why the rate of shrinkage was practically the same for all the amphi-philes, since cac was negligible compared to the concentration in the bulk solution (i.e., in Eq.8b, C − cac ≈ C).
4.5. Release kinetics 4.5.1. Microscopy studies
In each of the above experiments, the release of the amphiphile from the loaded beads was initiated by changing the liquid in the flow-pipette from amphiphilic solution to 150 mM NaCl solution. This al-ways resulted in immediate swelling (without a lag phase) (Fig. 3) ac-companied by the appearance of a depletion layer, with less intense coloration, in the outermost layer of the bead (Fig. 4right panel). In Fig. 3the dotted horizontal lines indicate a relative volume of 0.34, which corresponds to VNaCl/V0for beads in equilibrium with 150 mM
NaCl (Fig. S2). All the investigated amphiphilic molecules reached this plateau, indicating that the amphiphilic molecules had been completely released. The fluorescence images of CHL revealed some anomalies (see Fig. 4D), probably due to photo-induced effects (for further discussion see Supporting Information).
For each amphiphile the swelling profile was independent of the concentration in the solution during loading (cmc to cmc/1000). This indicates that all concentrations were higher than that needed to reach the maximum loading capacity. This is in agreement with the ob-servation that the final relative bead volume was independent of the concentration in the solution after loading was completed (Fig. 3). In-terestingly, each amphiphile had a swelling rate distinctly different from the others. The shortest time to reach the plateau was observed for ADI (< 300 s), followed by AMI (< 450 s), DOPC (< 1000 s), and CHL (< 1500 s). Apart from the fact that the last two appear in the reverse
Fig. 5. A) The binding kinetics of dodecylpyridinium vs. time. Lines represent fitting of the binding model and symbols represent experimental mean-binding data. The three lowest concentrations 0.0178 mM – 0.178 mM were well described by the model, suggesting that the shrinkage of the beads caused by the binding of dodecylpyridinium was film-controlled. B) The correlation (cacb= 0.72 × cmc – 7.6) between calculated critical aggregation concentration inside the bead (cacb) and literature critical micelle concentration (cmc) with a r2of 0.99. The lag time before bead shrinkage started was used to calculate the cac
bof each of the four model substances.
Fig. 6. Correlation of swelling rate (s−1) in micropipette-assisted microscopy
and release rate in μDISS of surfactant or amphiphilic drug solutions from 50 μl bead:water slurry (1:1) of bead sizes 100–300 μm in 20 ml of 150 mM NaCl. Free-flowing method at room temperature, a magnetic stirrer (100 rpm) pro-vided stirring of the release medium. Release data was normalized towards maximum concentration released. Swelling rate = 0.13 × release rate + 0.00022, r2 = 0.99 p < .0001.
order, the swelling rate increased with increasing cmc. This suggests that the swelling rate (and presumably also the release rate) is con-trolled by the amphiphile rate of diffusion through the depletion layer, which will be further discussed below. Thus, by assuming that the concentration of monomers in local equilibrium with the aggregates in the amphiphile rich core increases with increasing cmc, the amphiphile with the largest cmc should have the largest concentration gradient in the depletion layer, and thereby also the largest transport rate out of the bead. In order to accurately describe the quantitative release of an amphiphile from the beads novel experimental techniques that enables determination of the release from single beads or the amphiphile con-centration inside the beads are warranted.
4.5.2. Free-flowing release in μDISS profiler
The release from beads suspended in 150 mM NaCl solution was measured using the free-flowing method in a μDISS profiler, previously used to study the release of DOX [22]. Initial release rates were de-termined from the initial slope of the curve for each amphiphile (see Supporting information Fig. S3) and compared with initial swelling rates determined from the initial slope of the curves inFig. 3.Fig. 6 shows that there is a correlation between the swelling and release rates (r2was 0.99 and p-value < .0001). The result confirms that the rate of
swelling of a single bead in the flow-pipette experiment is directly re-lated to the release rate from the beads in a stirred suspension.
4.5.3. The impact of amphiphilic self-assembly on binding and release of doxorubicin
The in vitro release rate was determined with a μDISS method, as previously described [22], and was found to depend on the stirring rate, temperature and the size of the beads. However, no information of the internal morphology of the beads during release could be collected. Therefore, the micropipette-assisted microscopy method was used to
study the loading and release of DOX using the same conditions as the other amphiphiles. The microscopy images show that a sharp DOX diffusion front migrated to the center of the bead during loading (Fig. 7A). A depletion layer developed in the outer parts during release (Fig. 7B). Similar observations of the release of DOX from DC beads have been reported earlier by Biondi [43], and from polyacrylate-co-acrylamide colloidal microgels by Kiser [44]. The behavior is qualita-tively the same as for the other amphiphiles. This suggests that the rate of shrinkage during loading was chiefly controlled by mass transfer in the liquid layers surrounding the bead. Meanwhile, the rate of swelling was coupled to the release rate, which is mainly controlled by diffusive mass transport through the depletion layer in the bead.
DOX is amphiphilic but the hydrophobic and hydrophilic moieties are not as well separated as for regular surfactants or the other am-phiphilic drugs (Fig. 1). CPC was included due to the simpler chemical structure but comparable hydrophobicity to DOX. The result, presented inFig. 7-D, shows that the behavior of DOX and CPC was very similar with respect to both loading and release.
The rate of shrinkage upon loading of DOX and CPC was nearly the same as for the other amphiphilic drugs when compared at similar concentrations (Figs. 3 and 7C). However, the final relative bead vo-lume was slightly larger for DOX (0.14 ± 0.0027) compared to the other amphiphilic molecules (Table 2). The swelling rate upon release was independent of the concentration of DOX or CPC in the solution during loading (Fig. 7D). However, it was considerably slower, with an uncompleted release after 6000 s, compared to the other amphiphiles, all of which were completely released after 1500 s. CPC has a cmc of 0.9 mM [45] and DOX has been reported to form dimers at 5–20 μM in aqueous solution and larger assemblies, with an aggregation number of 40 at 1 mM [9,23,24]. This is more than one order of magnitude smaller than the cmc of the other amphiphiles studied here (Table 1), suggesting that the slow release of DOX and CPC is an effect of their
self-Fig. 7. Binding (A) and release (B) of doxorubicin (DOX) (0.2 mM) to 200 μm beads in micropipette-assisted microscopy. Bead volume-change during binding (C) and release (D) of DOX and cetylpyridinium chloride (CPC) from 200 μm bead.
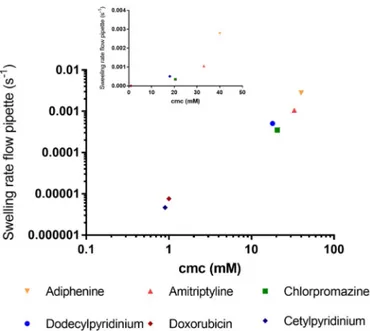
assembling properties. The resulting low concentration of free mono-mers in the depletion layer directly affect the rate of diffusive transport out from the bead. In fact, the data for all the substances investigated here suggest that there is a scaling relationship between cmc and swelling rate (i.e., release rate) (seeFig. 8). This further suggests that the tendency to self-aggregate plays an important part in the release of an amphiphile molecule from the bead.
4.5.4. Release mechanism
The release model was used to investigate the interplay between aggregation and molecular transport processes. Fig. 9shows the cal-culated release of an example amphiphile molecule with D = 5 × 10⁻⁶
cm2s−1, cac = 0.5 mM in 150 mM NaCl; other input parameters and
conditions are described in the Theory section. The first step of the process is for salt to enter the bead. This step is fast; the concentration of salt in the centre of the bead reaches the bulk value of 150 mM within a few seconds (Fig. 9). The second step is for the amphiphile to leave the bead, fully depleting the outermost layer first. This is coupled
to an enrichment of sodium and a depletion of chloride, finally resulting in a Donnan equilibrium of the salt with the solution.
The mechanism by which the amphiphile is released from the bead is by forming a depletion layer, free of amphiphile aggregates, at the surface of the bead that grows in thickness over time. This is schema-tically illustrated inFig. 10. When the free amphiphile molecules dif-fuse out of the bead, they are immediately replaced through dissolution of aggregates. Due to the high cooperativity of the aggregation equili-brium, the local concentration of free amphiphile stays nearly constant at the cacbwhile there are aggregates remaining [46]. In the absence of an appreciable concentration gradient, the flux of amphiphile within the loaded parts of the bead is always very small. Instead, only the free amphiphile in the outermost layer of the bead can be released, and its concentration is continuously kept constant through replenishing by the local aggregates. Release of amphiphile molecules from the second-outermost layer does not start until all the aggregates in the second-outermost layer have been dissolved. The results from the release model have si-milarities to the Higuchi equation which describes the release of a substance present above its solubility in the DDS [47]. Similar release models have previously been developed and applied to the release of catanionic mixtures from gels [48].
The effect of varying the cacbof the example amphiphile molecule is shown inFig. 11. Despite the complex mechanism, the time for com-plete release is approximately inversely proportional to the cacb. A higher cacb increases the release rate by increasing the concentration gradient in the depletion layer. The amphiphile concentration in the depletion layer will always vary from the cacbat the inner boundary to zero at the outer boundary, so a larger cacbyields a larger concentration gradient. Thus, the faster release of an amphiphile with lower tendency for aggregation in the bead is caused by a larger concentration gradient in the depletion layer, not by faster or less obstructed movement of individual amphiphile molecules. The conditions match those of the simple internal depletion-layer model derived earlier [22], from which the time for complete release can be shown to be inversely proportional to cacb(for further discussion see Supporting Information).
Ion exchange is sometimes held as the primary release mechanism of charged drugs from oppositely charged beads [21,43,49]. However, the calculations presented here affirm that ion exchange is not rate limiting for the release, nor does it determine the release mechanism. Inevitably, the release of an amphiphile from the bead must be coupled to movement of other charged species, but at physiological salt con-centrations (approximately 150 mM NaCl) there are enough sodium and chloride ions to enable free movement of the amphiphile. This can be verified by changing the diffusion coefficients of sodium and
Fig. 9. Calculated distributions of amphiphile and salt during release in 150 mM NaCl. Diffusion coefficient of the amphiphile molecule is 5 × 10⁻⁶cm2s−1and the
critical aggregation concentration inside the bead (cacb) is 0.5 mM. Bead diameter is 150 μm and the concentration of fixed charges is 150 mM.
Fig. 8. Relationship of swelling rate (s−1) and critical micelle concentration
(cmc) for the investigated substances. On a log-log scale to separate doxorubicin and cetylpyridinium from axis-origin.
chloride; reducing or increasing these by an order of magnitude has a negligible effect on the calculated release rate.
At physiological salt concentrations the ion exchange taking place is not rate determining, partly since both sodium ions and chloride ions are involved in the exchange. In order to leave the bead, the amphi-philes must either be exchanged by sodium ions or accompanied by chloride ions. The effect of the drug leaving the bead will thus be a simultaneous enrichment of sodium and depletion of chloride.
Salt has an effect on the release rate, but this effect depends on the concentration. The behaviour at physiological salt concentration re-presents an intermediate between two limiting cases. At the high-con-centration limit, the mechanism described inFig. 10 is exact. At the low-concentration limit, release happens through a film-controlled mechanism with a steady flux of amphiphile through the whole bead, and a constant even distribution of amphiphile in the bead. At this limit, diffusion of sodium ions is rate-limiting for the release of the amphi-phile, due to both the slow influx of sodium and the inability to deplete chloride (whose concentration is always close to zero). At physiological salt concentrations, there is a small flux of amphiphile within the loaded regions (due to the electric field), but the mechanism inFig. 10 is nearly correct.
Thus, a strict ion-exchange mechanism of release where sodium ions exchange the amphiphile ions one at a time is only valid at the limit of zero salt concentration. Additionally, such a mechanism would not explain the observed depletion layers without assuming that the am-phiphile-loaded bead is impermeable to small ions. With aggregates estimated to occupy < 10% of the volume, the rest being an aqueous solution of loosely cross-linked polymer chains, this assumption is
unrealistic. It is much more plausible that the observed mechanism is due to an aggregation reaction.
5. Conclusions
This study provides valuable insights and a mechanistic under-standing of amphiphile molecules loading to and release from a PVA based bead DDS. It was shown that loading was film controlled and independent of amphiphile concentration. The release rate was de-termined by diffusion of the amphiphile through the depletion layer in the polymeric network. Both the mechanism and rate of release were shown to be strongly dependent on aggregation reactions. The release rate was not dependent on ion exchange mechanisms at physiological conditions. Fundamental knowledge in these mechanisms is crucial to understand the clinical performance of the DDS with direct implications on efficacy and safety. The proposed experimental and analytical methods in this study can be applied in the development of future DDSs.
Acknowledgments
Financial support was provided by the Swedish Research Council, grant number 521-2011-373. The authors wish to acknowledge Martin Nilsson and Jean Pettersson for the kind assistance in determining the charge contents of the beads.
Appendix A. Supplementary data
Supplementary data to this article can be found online athttps:// doi.org/10.1016/j.jconrel.2018.11.011.
References
[1] F. Dosio, S. Arpicco, B. Stella, E. Fattal, Hyaluronic acid for anticancer drug and nucleic acid delivery, Adv. Drug Deliv. Rev. 97 (2016) 204–236.
[2] N. Peppas, P. Bures, W. Leobandung, H. Ichikawa, Hydrogels in pharmaceutical formulations, Eur. J. Pharm. Biopharm. 50 (2000) 27–46.
[3] B. Abismaı̈L, J.P. Canselier, A.M. Wilhelm, H. Delmas, C. Gourdon, Emulsification by ultrasound: drop size distribution and stability, Ultrason. Sonochem. 6 (1999) 75–83.
[4] K. Park, Controlled drug delivery systems: past forward and future back, J. Control. Release 190 (2014) 3–8.
[5] T.R. Hoare, D.S. Kohane, Hydrogels in drug delivery: progress and challenges, Polymer 49 (2008) 1993–2007.
[6] D. Attwood, The mode of association of amphiphilic drugs in aqueous solution, Adv. Colloid Interf. Sci. 55 (1995) 271–303.
[7] L.R. Barbosa, R. Itri, W. Caetano, D. de Sousa Neto, M. Tabak, Self-assembling of phenothiazine compounds investigated by small-angle X-ray scattering and electron paramagnetic resonance spectroscopy, J. Phys. Chem. B 112 (2008) 4261–4269. [8] V. Perez-Villar, M. Vazquez-Iglesias, A. De Geyer, Small-angle neutron scattering studies of chlorpromazine micelles in aqueous solutions, J. Phys. Chem. 97 (1993) 5149–5154.
Fig. 10. Mechanism of release of amphiphile, showing free amphiphile molecules (small circles) and amphiphile aggregates. As the free amphiphile diffuses out of the bead, aggregates dissolve to maintain its concentration. This prevents flux of amphiphile within the bead, leading to complete depletion of the outermost layer.
Fig. 11. Release in 150 mM NaCl for critical aggregation concentration inside the bead (cacb) values of 0.25–2 mM. Diffusion coefficient of the amphiphile molecule is 5 × 10⁻¹⁰m2s−1. Bead diameter is 150 μm and concentration of
[9] X. Li, D.J. Hirsh, D. Cabral-Lilly, A. Zirkel, S.M. Gruner, A.S. Janoff, W.R. Perkins, Doxorubicin physical state in solution and inside liposomes loaded via a pH gra-dient, Biochimica et Biophysica Acta (BBA)-Biomembranes 1415 (1998) 23–40. [10] E. Tasca, M. D'Abramo, L. Galantini, A.M. Giuliani, N.V. Pavel, G. Palazzo,
M. Giustini, A stereochemically driven supramolecular polymerisation, Chem Eur J 24 (32) (2018) 8195–8204.
[11] P. Hansson, Interaction between polyelectrolyte gels and surfactants of opposite charge, Curr. Opin. Colloid Interface Sci. 11 (2006) 351–362.
[12] P. Hansson, Self-assembly of ionic surfactant in cross-linked polyelectrolyte gel of opposite charge. A physical model for highly charged systems, Langmuir 14 (1998) 2269–2277.
[13] P. Hansson, Surfactant self-assembly in oppositely charged polymer networks. Theory, J. Phys. Chem. B 113 (2009) 12903–12915.
[14] A.R. Khokhlov, E.Y. Kramarenko, E.E. Makhaeva, S.G. Starodubtzev, Collapse of polyelectrolyte networks induced by their interaction with an oppositely charged surfactant. Theory, Macromolecular Theory Simulations 1 (1992) 105–118. [15] J. Gernandt, P. Hansson, Hysteresis in the surfactant-induced volume transition of
hydrogels, J. Phys. Chem. B 119 (2015) 1717–1725.
[16] J. Gernandt, P. Hansson, Surfactant-induced core/shell phase equilibrium in hy-drogels, J. Chem. Phys 144 (2016) 064902.
[17] M. Andersson, P. Hansson, Phase behavior of salt-free polyelectrolyte gel–surfactant systems, J. Phys. Chem. B 121 (2017) 6064–6080.
[18] A.L. Lewis, M.V. Gonzalez, S.W. Leppard, J.E. Brown, P.W. Stratford, G.J. Phillips, A.W. Lloyd, Doxorubicin eluting beads – 1: effects of drug loading on bead char-acteristics and drug distribution, J. Mater. Sci. Mater. Med 18 (2007) 1691–1699. [19] A.L. Lewis, M.V. Gonzalez, A.W. Lloyd, B. Hall, Y. Tang, S.L. Willis, S.W. Leppard, L.C. Wolfenden, R.R. Palmer, P.W. Stratford, DC bead: in vitro characterization of a drug-delivery device for transarterial chemoembolization, J. Vasc. Interv. Radiol. 17 (2006) 335–342.
[20] E. Lilienberg, I.R. Dubbelboer, A. Karalli, R. Axelsson, T.B. Brismar, C. Ebeling Barbier, A. Norén, F. Duraj, M. Hedeland, U. Bondesson, E. Sjögren, P. Stål, R. Nyman, H. Lennernäs, In vivo drug delivery performance of lipiodol-based emulsion or drug-eluting beads in patients with hepatocellular carcinoma, Mol. Pharm. 14 (2017) 448–458.
[21] M. Biondi, S. Fusco, A.L. Lewis, P.A. Netti, New insights into the mechanisms of the interactions between doxorubicin and the ion-exchange hydrogel DC Bead for use in transarterial chemoembolization (TACE), J. Biomater. Sci. Polymer Edition 23 (2012) 333–354.
[22] E. Ahnfelt, E. Sjögren, P. Hansson, H. Lennernäs, In vitro release mechanisms of doxorubicin from a clinical bead drug-delivery system, J. Pharm. Sci. 105 (2016) 3387–3398.
[23] Z. Fülöp, R. Gref, T. Loftsson, A permeation method for detection of self-aggregation of doxorubicin in aqueous environment, Int. J. Pharm. 454 (2013) 559–561. [24] P. Agrawal, S.K. Barthwal, R. Barthwal, Studies on self-aggregation of anthracycline
drugs by restrained molecular dynamics approach using nuclear magnetic re-sonance spectroscopy supported by absorption, fluorescence, diffusion ordered spectroscopy and mass spectrometry, Eur. J. Med. Chem. 44 (2009) 1437–1451. [25] E. Csuhai, S. Kangarlou, T.X. Xiang, A. Ponta, P. Bummer, D. Choi, B.D. Anderson,
Determination of key parameters for a mechanism-based model to predict doxor-ubicin release from actively loaded liposomes, J. Pharm. Sci. 104 (3) (March 2015) 1087–1098.
[26] P. Nilsson, P. Hansson, Ion-exchange controls the kinetics of deswelling of poly-electrolyte microgels in solutions of oppositely charged surfactant, J. Phys. Chem. B 109 (2005) 23843–23856.
[27] C. Jidheden, P. Hansson, Single microgels in core–shell equilibrium: a novel method for limited volume studies, J. Phys. Chem. B 120 (2016) 10030–10042. [28] G. Frenning, E. Ahnfelt, E. Sjögren, H. Lennernäs, Computational fluid dynamics
(CFD) studies of a miniaturized dissolution system, Int. J. Pharm. 521 (2017) 274–281.
[29] V. Bijlani, D. Yuonayel, S. Katpally, B.N. Chukwumezie, M.C. Adeyeye, Monitoring ibuprofen release from multiparticulates: in situ fiber-optic technique versus the HPLC method: a technical note, AAPS PharmSciTech 8 (2007) E9–E12. [30] J.M. Coulson, J.F. Richardson, J.R. Backhurst, J.H. Harker, Coulson & Richardson's
Chemical Engineering, Butterworth Heinemann, Oxford, 1996.
[31] A. Cornellas, L. Perez, F. Comelles, I. Ribosa, A. Manresa, M.T. Garcia, Self-ag-gregation and antimicrobial activity of imidazolium and pyridinium based ionic liquids in aqueous solution, J. Colloid Interface Sci. 355 (2011) 164–171. [32] P. Hansson, Phase behavior of aqueous polyion–surfactant ion complex salts: a
theoretical analysis, J. Colloid Interface Sci. 332 (2009) 183–193.
[33] A. Göransson, P. Hansson, Shrinking kinetics of polyacrylate gels in surfactant so-lution, J. Phys. Chem. B 107 (2003) 9203–9213.
[34] F.G. Helfferich, Ion Exchange, Courier Corporation, 1962.
[35] B. Corry, S. Kuyucak, S.-H. Chung, Dielectric self-energy in Poisson-Boltzmann and Poisson-Nernst-Planck models of ion channels, Biophys. J. 84 (2003) 3594–3606. [36] D.G. Leaist, B. Wiens, Interdiffusion of acids and bases• HCl and NaOH in aqueous
solution, Can. J. Chem. 64 (1986) 1007–1011.
[37] D.R. Lide, Handbook of Chemistry and Physics: CRC Handbook, CRC Press, 1993. [38] P. Hansson, B. Jönsson, C. Ström, O. Söderman, Determination of micellar
ag-gregation numbers in dilute surfactant systems with the fluorescence quenching method, J. Phys. Chem. B 104 (2000) 3496–3506.
[39] T.R. Brumleve, R.P. Buck, Numerical solution of the Nernst-Planck and Poisson equation system with applications to membrane electrochemistry and solid state physics, J. Electroanal. Chem. Interfacial Electrochem. 90 (1978) 1–31. [40] Y.V. Khandurina, V. Rogacheva, A. Zezin, V. Kabanov, Interaction of cross-linked
polyelectrolytes with oppositely charged surfactants, Polymer Sci 36 (1994) 184–188.
[41] A.R. Khokhlov, E.E. Makhaeva, O.E. Philippova, S.G. Starodubtzev, Supramolecular structures and conformational transitions in polyelectrolyte gels, Macromolecular Symposia, Wiley Online Library, 1994, pp. 69–91.
[42] C. Nordling, J. Osterman, Physics Handbook, 1982 Chartwell-Bratt Ltd, Bromley, England, 1982.
[43] M. Biondi, S. Fusco, A.L. Lewis, P.A. Netti, Investigation of the mechanisms gov-erning doxorubicin and irinotecan release from drug-eluting beads: mathematical modeling and experimental verification, J. Mater. Sci. Mater. Med 24 (2013) 2359–2370.
[44] P.F. Kiser, G. Wilson, D. Needham, Lipid-coated microgels for the triggered release of doxorubicin, J. Control. Release 68 (2000) 9–22.
[45] K.H.S. Kung, K.F. Hayes, Fourier transform infrared spectroscopic study of the ad-sorption of cetyltrimethylammonium bromide and cetylpyridinium chloride on si-lica, Langmuir 9 (1993) 263–267.
[46] J.N. Israelachvili, Intermolecular and Surface Forces, Academic Press, 2011. [47] T. Higuchi, Rate of release of medicaments from ointment bases containing drugs in
suspension, J. Pharm. Sci. 50 (1961) 874–875.
[48] T. Bramer, G. Frenning, J. Gråsjö, K. Edsman, P. Hansson, Implications of regular solution theory on the release mechanism of catanionic mixtures from gels, Colloids Surf. B: Biointerfaces 71 (2009) 214–225.
[49] M.V. Gonzalez, Y. Tang, G.J. Phillips, A.W. Lloyd, B. Hall, P.W. Stratford, A.L. Lewis, Doxorubicin eluting beads-2: methods for evaluating drug elution and in-vitro:in-vivo correlation, J. Mater. Sci. Mater. Med 19 (2008) 767–775. [50] R.A. Thakur, A.A. Dar, G.M. Rather, Investigation of the micellar growth of
1-do-decylpyridinium chloride in aqueous solution of phenol, J. Mol. Liq. 136 (2007) 83–89.
[51] S. Schreier, S.V.P. Malheiros, E. de Paula, Surface active drugs: self-association and interaction with membranes and surfactants. Physicochemical and biological as-pects, Biochim. Biophys. Acta Biomembr. 1508 (2000) 210–234.
[52] H. Sjöberg, S. Persson, N. Caram-Lelham, How interactions between drugs and agarose-carrageenan hydrogels influence the simultaneous transport of drugs, J. Control. Release 59 (1999) 391–400.
[53] F.A. Chrzanowski, B.A. McGrogan, B.E. Maryanoff, The pKa of butaclamol and the mode of butaclamol binding to central dopamine receptors, J. Med. Chem. 28 (1985) 399–400.
[54] R. Manzo, M. Olivera, G. Amidon, V. Shah, J. Dressman, D. Barends, Biowaiver monographs for immediate release solid oral dosage forms: amitriptyline hydro-chloride, J. Pharm. Sci. 95 (2006) 966–973.
[55] G.A. Kabir-Ud-Din, A.Z. Al-Dahbali, M. Akram Naqvi, Surface and micellar prop-erties of some amphiphilic drugs in various salt solutions, Colloid J 75 (2013) 170–175.
[56] A.Z. Naqvi, G.A. Al-Dahbali, M. Akram, Kabir-ud-Din, adsorption and micellization behavior of cationic surfactants (Gemini and conventional)—amphiphilic drug systems, J. Solut. Chem. 42 (2013) 172–189.
[57] W. Saal, N. Wyttenbach, J. Alsenz, M. Kuentz, Can we estimate the critical micelle concentration of amphiphilic drug bases from molecular connectivity indices? Pharm. Dev. Technol. 23 (2018) 211–215.
[58] M. Dalmark, H. Storm, A Fickian diffusion transport process with features of transport catalysis. Doxorubicin transport in human red blood cells, J. General Physiol 78 (1981) 349–364.