Degree project in
Communication Systems
First level, 15.0 HEC
Stockholm, Sweden
A B D E L A H M I D
Toward a scale with wireless connectivityMore than downloading
K T H I n f o r m a t i o n a n d C o m m u n i c a t i o n T e c h n o l o g y
More than
downloading
Toward a scale with wireless
connectivity
Abdel Ahmid
16 June 2012
Bachelor’s thesis
Mentor and examiner: Prof. Gerald Q. Maguire Jr. KTH Royal Institute of Technology
School of Information and Communication Technology Stockholm, Sweden
i
Abstract
Sensors are light-weight, low powered devices that measure some aspect of a physical or virtual environment and transmit this information in some format. This thesis describes how to integrate a sensor onto devices to enable network connectivity.
The phrase “internet of things” suggests that within a few years many devices will be connected to an internet. Devices, including common household appliances, will transmit and receive data over a network. The CEO of Ericsson has stated that there will be more than 50 billion connected devices by 2020[1]. These devices could be microwaves, fridges, lights, or temperature sensors. Devices that are usually not associated with internet connectivity will be integrated into networks and play a larger role in providing information and controlling other devices. Sensors will have a major role in “the internet of things”. These small computers could be integrated in any appliances and transmit data over the network. The sensors’ low power and low cost, as well as their light weight, makes them very attractive to integrate them into many devices. The goal of this thesis project is to build upon this trend toward “The internet of things” by integrating a sensor into a bathroom scale thus enabling the scale to have networking connectivity. The sensor will be low cost and simple. It should wirelessly or via USB transmit the current weight that it measures to a receiver (specifically a gateway). This gateway will forward the message over the network to a website or mobile phone for visual presentation of the data. This thesis describes different techniques and approaches toward developing this sensor. The thesis also evaluates these different choices in order to select one technique that will be implemented. This solution will be evaluated in terms of its cost and ease of integration into an existing commercially produced scale.
ii
Sammanfattning
Sensorer är små, energieffektiva apparater som upptäcker variationer i förhållande till någon stimulans och skickar informationen i ett godtyckligt format. Den här uppsatsen beskriver hur man kan integrera en sensor med en apparat för att möjliggöra nätverksuppkoppling.
Uttrycket ”The Internet of things”, översatt på svenska som ”Internet av saker”, konstaterar att inom några år så kommer den mesta av vardaglig elektronik vara uppkopplad mot Internet. Hemelektroniken kommer att skicka och ta emot data över ett nätverk. Ericsson tror att det kommer att vara över 50 miljarder uppkopplade apparater år 2020[1]. Sådana apparater kan vara mikrovågsugnar, frysar, lampor eller termometrar. Apparater som vanligtvis inte förväntas vara uppkopplade mot ett nätverk kommer att bli uppkopplade för att tillföra eller kontrollera information och andra apparater. Sensorer har en viktig roll i denna utveckling. De är små datorer som kan kopplas upp mot flertalet elektroniska apparater och förse dem med en nätverksuppkoppling för att skicka betydelsefull data över ett nätverk. Energieffektiviteten och de låga kostnaderna, så väl som deras små storlekar, gör dem dessutom väldigt attraktiva. Målet med den här uppsatsen är att påbygga ”The Internet of things” genom att tillförse en personvåg med en sensor för att möjliggöra nätverksuppkoppling. Sensor ska vara enkel och billig. Den kommer att trådlöst eller via USB skicka vikter till en mottagare som sedan skickar vidare informationen över nätverket till en hemsida eller mobiltelefon för en grafisk presentation av informationen. Den här rapporten beskriver dem olika teknikerna och approachen mot utvecklingen av sensorn.
iii
Table of Contents
Abstract ... i
Sammanfattning ... ii
Table of Contents ... iii
List of Figures ... v
List of Tables ... vi
List of Listings ... vii
Glossary ... viii
1 Introduction ... 1
1.1 Limitations of this thesis project ... 2
1.2 Thesis structure ... 2
2 Related work ... 3
2.1 Jorge Pinto – SD card ... 3
2.2 Micah Elizabeth Scott – hacking a digital scale ... 3
2.3 Sánchez and López (Master thesis project) ... 3
2.4 Pedersen and Andersson (Bachelor’s thesis project) ... 4
3 Wasa Board ... 5 4 Sensors ... 6 4.1 Light sensors ... 6 4.2 3-axis accelerometers ... 6 4.3 Air sensors... 6 4.3.1 Temperature sensors ... 6 4.3.2 Humidity sensors ... 6
4.3.3 Possible usage scenarios ... 6
4.4 Weight sensor ... 7
5 Wireless transmission technologies ... 8
5.1 IEEE 802.15 and SimpliciTI ... 8
5.2 Radio transmitter or transceiver ... 9
5.2.1 RFM02 - transmitter ... 9
5.2.2 Texas Instruments CC1101 - transceiver ... 9
6 Scale ... 10
6.1 Inside a digital scale ... 10
6.2 Sensor Power ... 10
6.3 Reading weight data ... 11
6.3.1 Different Approaches to snoop the data ... 12
6.3.1.1 Voltage sensing ...13
6.3.1.2 LCD screen ...13
6.3.2 Second Test ... 15
6.3.2.1 Types of LCDs ...15
6.3.2.2 The scale’s LCD screen ...17
7 Understanding MSP430... 19
7.1 Texas Instruments MSP430 ... 19
7.2 Programming the MSP430 ... 19
iv
7.2.2 ADC and GPIO ... 21
7.2.2.1 Sampling ...22 8 Initial experiments ... 23 8.1.1 Purpose ... 23 8.1.2 Approach ... 23 8.1.3 Communication ... 23 8.1.3.1 Accelerometer ...23 8.1.3.2 Temperature sensor ...24 8.1.3.3 Light sensor ...24
8.1.3.4 Wasa Board info ...24
8.1.4 Code ... 24 8.1.5 Results ... 25 8.1 Software experiments ... 25 8.1.1 Purpose ... 25 8.1.2 Approach ... 25 8.1.3 Problems ... 25 8.1.4 Results ... 26 9 Hello World ... 27 9.1 Results ... 27
10 First program for reading data sent to the LCD ... 28
10.1 Results ... 29
11 AT Commands ... 31
11.1 AT command implementation ... 32
11.2 Measurement unit ... 33
12 Send to local host ... 35
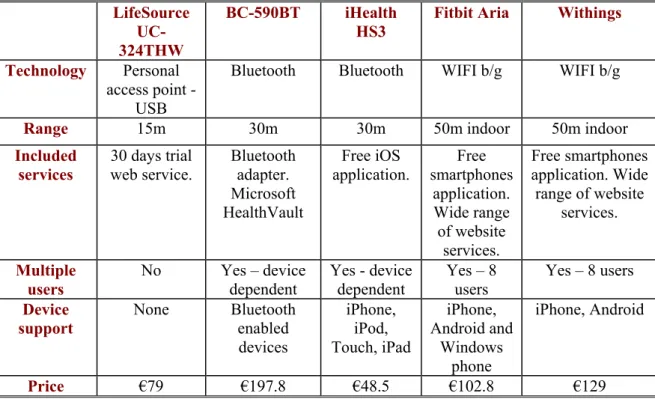
13 Market research ... 36
13.1 Other scales available on the market ... 36
13.2 The cost of this thesis project ... 37
13.3 Market potentials ... 39 14 Future work ... 40 14.1 Wireless transmission ... 40 14.2 Timer modules ... 40 14.3 Power source ... 41 14.4 Wi-Fi ... 41 15 Results ... 42 16 Conclusions ... 43 16.1 Required reflections ... 43 References ... 45 Appendix I ... 47 Appendix II ... 48 Appendix III ... 49 Appendix IV ... 52 Appendix V ... 55 Appendix VI ... 56
v
List of Figures
Figure 1-1: System Overview ... 2
Figure 3-1: One side of the Wasa board (version 1.7) ... 5
Figure 3-2: Other side of the Wasa board (version 1.7) ... 5
Figure 6-1: Front view of the scale ... 12
Figure 6-2: Back view of the scale ... 12
Figure 6-3: Electronics overview ... 12
Figure 6-4: Front view of the scale PCB ... 13
Figure 6-5: Back view of the scale PCB ... 13
Figure 6-6: soldered pins ... 14
Figure 6-7: Seven-segment digit [4] ... 14
Figure 6-8: Oscilloscope readings of the 1st pin ... 15
Figure 6-9: Oscilloscope readings of the 2nd pin ... 15
Figure 6-10: How an LCD is constructed as a matrix ... 15
Figure 6-11: static LCD ... 16
Figure 6-12: Multiplexed LCD [13] ... 16
Figure 6-13: Zero DC bias within a frame ... 17
Figure 6-14: Horizontal backplane signals ... 17
Figure 6-15: Vertical segment signals ... 17
Figure 6-16: 2nd pin and backplane signals at the value of 0 ... 18
Figure 7-1: ADC control register - ADC12CTL0 ... 21
Figure 10-1: Difference between a segment- and a backplane line with a threshold of 2.3V ... 28
Figure 11-1: 4-sampling algorithm – least significant lines for the digit 2 ... 31
Figure 11-2: Backplane sampling trigger. It triggers when the line is at its peak. ... 32
Figure 11-3: Sampling time ... 32
Figure 11-4: Possible sampling start times for the segment line for the third segment line for the digit ‘0’ ... 33
Figure 11-5: Measurement unit line. The line is HIGH during different duty cycles depending on which unit is chosen. ... 34
vi
List of Tables
Table 3-1: Summary of Wasa board version 1.7 components ... 5
Table 5-1: Summary of 802.15 network technologies ... 8
Table 6-1: Option to power the microcontroller and radio transmitter ... 11
Table 6-2: Segments at each intersection between a backplane line and a segment line ... 17
Table 7-1: Numeric presentations ... 20
Table 7-2: Logical Operations – OR, AND, NOT and XOR [16] ... 21
Table 10-1: Bit encoded digits ... 28
Table 11-1: Possible outcomes for the third segment line for the digit ‘0’ ... 33
Table 13-1: Scales summary ... 37
vii
List of Listings
Listing 7-1: Blinking led – XOR example ... 20 Listing 9-1: Hello World software ... 27 Listing 10-1: Weight decoding algorithm ... 29
viii
Glossary
ADC Analog to Digital converter
Baud Symbols/second
Comparator Compares two voltages and indicates which is higher
CEPT European Conference of Postal and Telecommunications Administrations
CoS Department of Communication Systems, KTH, Kista, Sweden
CSMA Carrier sense multiple access
D/A Digital to Analog converter
ETSI European Telecommunications Standards Institute
Gateway A device that receives data from one system and transmits it onto another system
HW Hardware
ISM Industrial, Scientific, and Medical radio bands
LCD Liquid Crystal Display is a type of display widely used in the computer industry
mA Milliampere, one thousandth (
10
−3)
of an ampereMHz Megahertz
Op-amp Operational amplifier. An electronic voltage amplifier with a differential input
Produces an output much larger than the voltage difference between the two inputs
PCB Printed Circuit Board
PDA Personal Digital Assistant
PoE Power over Ethernet, method to supply power to devices via the Ethernet
interface port
SW Software
RISC Reduced Instruction Set Computer
USB Universal Serial Bus, communication protocol used for communication and
power supply between a computer and a device
VCP Virtual COM port
1
1 Introduction
The purpose of this bachelor’s project is as the title suggests, “more than downloading”; to upload data to the internet. This was suggested by Prof. Gerald Q. Maguire Jr. who described the topic as follows:
“Today many networks are optimized for downloading (i.e., a transfer through the networking infrastructure to a host). Examples include web browsing, audio and video streaming from traditional media providers, etc. One of the coming trends is increasing generation of content (even if it is only a sensor saying "the temperature in the basement has fallen below 8°C"). This will result in increasing amounts of traffic in the uplink direction. [2]”
As I had no or very little hardware experience, but have a large interest in hardware development and networking I found this topic to be very interesting for my thesis project. Working with hardware widens my knowledge, although it is a challenge as to how to adapt my software knowledge to the hardware part of computer science.
Many different sensors were considered (these are covered in Chapter 4) and a bathroom scale sensor was selected. The reason for choosing a bathroom scale is because of my interest in health and fitness. I believe that such a sensor would not only be fun to developed, but very useful as well. I am very confident that network connected bathroom scale at a low cost have a great market demand. This enables a wide range of possibilities for future work.
There are scales currently on the market that wirelessly connect to a network; these are discussed in Chapter 13. However there is an issue with these scales; they are expensive. The main goal with the sensor-project is to develop a low-end bathroom scale with connectivity possibilities. The costing of the scale has to be a minimal with no or little effect on quality. Another important goal is simplicity. The design and implementation have to very simple with no or very little requirement for user interaction. The user should only need to stand on the scale and a few moments later view the data on their mobile phone or a website. To achieve this in a realistic situation the purchaser should receive a gateway with the scale which has a built-in sensor and transmitter, or a wired solution via USB. From a sensor point of view the user should not have to do any configuration, however some configuration may have to be done for the gateway. Energy consumption is yet another important consideration. The sensor has to be low powered and synchronized with the scale’s power consumption. The sensor’s power should not be exhausted before the scale’s power and both should have a similar averaged lifetime. Changing the power source should be inexpensive and simple, ideally not needed at all, for instance if piezoelectricity is sufficient to power the system (see Section 6.2).
My thesis project will consist of developing the sensor alone. It will used together with the gateway developed by Francisco Javier Sánchez and Albert López, described in section 2.3. The visual presentation and the application interface will be developed by Ivan Bremstedt Pedersen and Alfred Andersson for their thesis project which is described in Section 2.4. Figure 1-1 illustrates an overview of the system.
2
1.1 L
The certain t measure time, tem weight. people u to conne sensor w include sensor w the scal transmit be an ex1.2 T
Foll Chapter sensors technolo experim Descript 7. Chap World” algorithm describe scales on discusse thesis prLimitation
initial idea time frame. T ement unit as mperature, t The sensor using the sca ect the scale would be depa weight (un will also mos e until the w tted weight w xternal device
Thesis st
lowing this 3 introduces that might ogies that m ments that I h tions of the M ter 8 describ software im m. A second es the progra n the market es future wor roject.ns of this
of this proje The sensor w s data, no oth the number will also di ale. It is assum to any netw pendent on nless they tu st likely be t weight meas will be incor e.tructure
introduction s the Wasa b be used. C might be use have made t MSP430 mic bes the initia mplemented o d algorithm w am that save t as well as rk, while Ch Figures thesis
ct is to deve will send a simher informat of clothing isregard the med that the work and send
one gateway urn off the se time sensitiv surement ha rrect. In this , Chapter 2 oard used in Chapter 5 de d to connec to augment crocontroller al experimen on the MSP with the use s the weight the cost of t hapter 15 an 1-1: System O
project
elop a simple mple frame w tion will be i or other fa user, it will e scale will h d data throu y. Furthermo ensor or gate ve, for instan as stabilized. project the s will describ n this project escribes som ct the sensor a scale, ena r and a brief nts with the P430 and cha of AT comm ts locally to this thesis pr nd Chapter 1 Overview e scale senso with an ident included. Su actors that m l not be pos have a unique gh it in the c ore, the user eway), every nce it will be . If the user sensor will n be related a and Chapter me of the w rs to a gate abling it to f programmin Wasa board apter 10 dis mands is des a file. A ma roject is disc 6 discuss th or that transm tification fiel ch informati might be inte ssible to dist e user. It wil case it is a w r will not ha y weight will e required of r steps on a not be built i nd similar w r 4 will descr wireless phy way, while be a networ ng guide are d. Chapter 9 cusses the fi cribed in Ch arket researc cussed in Ch he results andmits the data ld and the we ion could be eresting in r tinguish betw ll also not be wireless solut
ave the optio l be transmit f the user to and off the
in to the scal work done b ribe different ysical and li Chapter 6 d rk connected e provided in describes th first weight hapter 11. Ch ch looking in hapter 13. Ch d conclusion a within a eight and date and regard to ween the e possible tion. The on to not tted. The stand on scale the le, it will by other. t types of ink layer describes d sensor. n Chapter he “Hello decoding hapter 12 nto other hapter 14 ns of this
3
2 Related work
After some research on the internet I found that other people had done similar work with a bathroom scale. Jorge Pinto connected sensors to a couple of different scales and used the data for different purposes. One scale wrote data to an SD card, while another transmitted the weight via a Bluetooth link to a computer. Jorge Pinto’s projects [3] are described in more detail in section 2.1. Another similar project by Micah Elizabeth Scott [4] is described in section 2.2. Her project is very interesting as she reads the analogue signals directly from the sensors ignoring the microcontroller and the LCD screen.
Section 2.3 describes Francisco Javier Sánchez and Albert López thesis project where they built the gateway which I may be using. Furthermore describes section 2.4 the application interface that will be developed by Ivan Bremstedt Pedersen and Alfred Andersson for their thesis project.
2.1 Jorge Pinto – SD card
Jorge Pinto has done 3 different projects with different scales. He started out with the Fagor BB-90 scale, a cheap and simple scale where he snooped the data from the scale’s LCD screen. The goal of his project was to store the data on an SD card and further add more advanced features to the scale. He did so by removing the original LCD screen and then added his own LCD screen and a microcontroller (LPC2103) which he could easily control. The microcontroller fetched data from the SD card and did multiple calculations before outputting it on the LCD screen. The new features were time and date, increase or decrease in weight, and multiuser support. This scale was further developed to give it Bluetooth connectivity. The scale communicated with his Android mobile phone via a Bluetooth link. He uses the Android application Smart Weight Chart to show the data as a graph [5].
His second project was similar to the first one, but with a different scale (Jata Hogar 490). This project is very interesting as the LCD screen works similarly to the LCD screen on my scale (see Chapter 6). Understanding his project was of great help when decoding my own scale.
Thirdly, he manipulated the Beurer BG 16 scale which measures weight, percentage of fat, percentage of water, and percentage of muscle. He made the same modifications as with the other scales.
2.2 Micah Elizabeth Scott – hacking a digital scale
Micah Elizabeth Scott’s project is very interesting as she does not fetch the data from the LCD screen, but instead connected directly to the sensors. Beth traced where the signals from the sensors went and figured out the analogue front-end then simply connected to it and passed these signals to a microcontroller (Propeller). This decreased the number of required pins on the microcontroller as only two I/O pins were required. She samples the weight signal by keeping an integration capacitor balanced around a comparator threshold. By measuring the amount of time it takes to charge the capacitor the weight upon the scale is calculated. Her work could be very interesting for another student to improve upon my work.
2.3 Sánchez and López (Master thesis project)
A gateway is needed to relay the information received via a radio signal to a computer connected to a network. This gateway contains a radio receiver that listens to a radio channel at a specific frequency. The gateway sends the information to a local computer via USB or via an Ethernet controller. In this thesis project I might use the gateway developed by Sánchez and López [6].
Francisco Javier Sánchez and Albert López have during the winter/spring 2012 developed a gateway that uses the 868 MHz band to snoop sensor data and send this data to a computer via an Ethernet interface. Their gateway uses a MSP430 microcontroller and a TI CC1101 wireless transceiver to communicate with different types of sensors. This gateway requires very low power and
4
is able to operate on power over Ethernet (PoE) or from an external power supply. Their gateway contains only low cost components. See their thesis report for a detailed description [6].
2.4 Pedersen and Andersson (Bachelor’s thesis project)
Ivan Bremstedt Pedersen and Alfred Andersson are developing the application interface for viewing sensor data. Their goal is to modify the gateway developed by Francisco and Albert to send data securely to a web-server for visual representation on a website. Another goal is to implement a TCP/IP-stack in the gateway to be able to communicate with the web-sever without requiring an additional computer.
A web interface was developed. This interface consists of a webpage running HTML5 and JavaScript code, together with Ruby on Rails in the background for authorization and login (in order to control who can view data collected from a sensor). Many different possibilities have been discussed, for instance mashing up with Facebook, either for logging in or possibly show a chart of the weights in Facebook.
A mobile application has also been discussed, similar to the project by Pinto described in section 2.1. A web application would serve the same purpose as a website, but could add mobility to the application interface. See their thesis report for a detailed description of their application interface [7].
3 W
For Professo such as USB cli these se WASA starting terminal The Togethe experim to protot hardwar MSP4 FT Therm 10 MP MMA7Wasa B
this thesis or Mark T. S a laptop or ient controll ensors are de board uses with 'AT'. It ls via serial p front and ba er with Alfr ments to gain type our ide re. A number Part 430F2618 T232RL mistor NTC 0K 5% PY20C48 660FC I2CBoard
project I us Smith to ena PDA. The er, a temper escribed in C AT-comman t's possible to ports. acksides of t red Anderss an understan eas of severa r of experime Table 3-1 Fut Device Visha S . Figu Figursed the Was able students Wasa board rature sensor Chapter 4 an nds for com o directly co the Wasa boa son and Iva nding about l possible se ents with the
1: Summary o Vendor TI ture Techno es Internatio ay BC Comp Silicon Senso Freescale re 3-1: One sid e 3-2: Other si 5 sa controller s to easily a d contains a r, a light sen nd summariz mmunication, ommunicate w ard (version an Bremsted these differe ensor and ac e Wasa board f Wasa board ology onal Ltd. ponents ors e de of the Wasa
ide of the Was
r board. The add sensors t MSP430F26 nsor, and a zed in Table , hence the with the Wa 1.7) are sho dt Pedersen ent sensors. tuator scenar d are describe version 1.7 com U T 3 a board (versio a board (versio e Wasa boa to existing c 618 microco 3-axis accel 3-1. The in Wasa board asa board usi
wn in Figure have we The Wasa b rios without ed in Chapte mponents Descrip Microcon USB client c Temperatur Light sens 3-axis accele n 1.7) on 1.7)
ard was desi computing p ontroller, a F lerometer. D nitial softwar d accepts co ing command e 3-1 and Fi used the b board also en t having to b er 8. ption ntroller controller re sensor sor, and erometer igned by latforms, FT232RL Details of re on the ommands d-prompt gure 3-2. oard for nabled us build new
6
4 Sensors
A general goal of sensors is to collect as much information as possible in order to extend a system’s functionality. With sensors for light level, air temperature, humidity, accelerometer, or motion sensors a system would have endless uses. There are a many different sensors that could be of interest. This chapter describes the different sensors that were considered during the literature study.
4.1 Light sensors
The Wasa board, described in Chapter 3, has a light sensor MPY20C48, produced by Silicon
Sensors. The initial tests with the light sensor on the Wasa board were successful. These tests are described in section 8 (starting on page 23). I was able to see a difference in the sensor’s value by simply placing a hand over the light sensor.
4.2 3-axis accelerometers
The Wasa board also has an accelerometer, a Freescale MMA7660FC I2C. The initial tests showed that I was able to read three values from the accelerometer. Each output consists of three values for X, Y, and Z. The test I conducted is described further in section 8 (starting on page 23).
4.3 Air sensors
Sensors that collect data about the air could be useful for homes. With data from these sensors users could start the air conditioner, turn up or down the thermostat, open or close the window blinds, and so forth. These functions are often mentioned when people talk about the “smart home”. Additionally, this data could be used together to lower their electricity bills and help reduce the user’s carbon footprint.
The two sensors described below could easily be incorporated because they are so closely related. Placing them in the same device will save money because only one transmitter and microcontroller is needed for the two sensors.
4.3.1
Temperature sensors
The Wasa board uses a temperature sensor that I have been able to take readings from. The test method and results are shown in section 8 (starting on page 23).
4.3.2
Humidity sensors
Humidity sensors could also be used with the Wasa board. I have at this time not conducted any experiments on how to use these sensors. An example project that utilizes a humidity sensor can be found on page 105 in Thomas Petruzzelli’s book “Electronic Sensors for the Evil Genius” [8].
4.3.3
Possible usage scenarios
These different types of sensors could be placed in each room of a home in order to enable the user to monitor each room and in turn control the local environment with potentially individual settings (not only as a function of the date and time, but also whether people were in the room or not). They could also be placed in a garage or basement where the air’s humidity could be of concern to the user. For example, an increase in water vapor in the air might be a sign of a leak, if the humidity has not also increased outside of the home.
If the device is placed in a waterproof case, then an outdoor installation is also possible. The lab’s 3D printer could print such a case.
Another possible usage scenario is a sauna where the electrical power or water supply to the heater could be controlled by the system via sensors placed in the sauna. Due to extreme temperature and humidity in a sauna special care needs to be taken to insure that the components function correctly.
7
4.4 Weight sensor
A weight sensor that collects data about the weight of a person would allow the user to monitor
her/his weight. A scale (Coline RTC3010) has been purchased from Clas Ohlson (SKU: 34-5062)
and initial tests describing how to read data from this scale are in section 6.3 (starting on page 11). The scale sensor will communicate with the gateway developed by Sánchez and López as explained earlier or send data via USB. In the case a wireless solution is implemented, it will transmit in the 868 Mhz band, most likely at 868.26Mhz, the same frequency as the temperature sensor they are currently working with. Ideally the sensor would transmit using the ZigBee protocol because the signals will be transmitted using CSMA techniques which are highly desired. Also as the ZigBee offers a payload of 104 bytes it would be more than enough to transmit a weight in a single packet. However the ZigBee stack is closed and requires a license. Therefore the packets could be transmitted using a proprietary protocol, the SimpliciTI. The data will be transmitted multiple times for the duration the scale stays active to minimize the risk of undelivered packages. The frame will most likely be very simple with only an identifier and data fields. If there is time a cyclic redundancy check (CRC) code will be included as well. The weight will be binary-coded decimals (BCD) and the signal will be Frequency shift keying (FSK) modulated. ZigBee, SimpliciTI, and other wireless transmission techniques are covered in Chapter 5.
8
5 Wireless transmission technologies
One of the main goals of this project is to communicate wirelessly between different devices. This wireless communication has to follow conventions and rules that are determined by international and national regulations (CEPT and ETSI). There are restrictions on which bands that can be used without a license. These bands are ISM-bands and one of the frequency bands that can be used in Europe (Sweden) is the 868MHz band. The 868MHz frequency is especially interesting since I may be using the gateway built by Francisco Javier Sánchez and Albert López as described in section 2.3, which operates in the 868MHz band.
Section 5.1 describes the different IEEE 802.15 wireless transmission technologies as well as the SimpliciTI protocol. Section 5.2 briefly describes the radio transmitters that have been discussed.
5.1 IEEE 802.15 and SimpliciTI
There are many different wireless transmission technologies each suitable for a particular need depending on data rates, communication range, security, and power consumption among other factors. Local area networks, wide area networks, metropolitan area networks, cellular wireless networks, and satellite communications each serve a purpose depending on the factors mentioned above. For this thesis project Wireless Personal Area Networks (WPAN) are of most interest. WPANs are wireless local networks for short range devices operating in the ISM-bands. The IEEE 802.15 Working Group for WPANs was formed to developed standards for short range wireless communication [9]. The first standard that was developed was IEEE 802.15.1 which was based on Bluetooth technology. Following the IEEE 802.15.1 standard the working group deployed further task groups. One of the task groups IEEE 802.15.3 was interested in developing standards for devices that are low cost and low power but with higher data rates than IEEE 802.15.1. The IEEE 802.15.4 working group is less concerned with data rates and thus develops standards for devices that are low cost and low power but with data rates lower than 802.15.1. My main concern lies with low power and low cost and as the packet sent from the scale sensor will most likely be small therefore a high data rate is not needed; hence the IEEE 802.15.4 standard is very interesting. Table 5-1 summarizes these standards in terms of power, operating frequency, range, and data rates.
ZigBee is a protocol that runs on top of IEEE 802.15.4. The ZigBee protocol is widely used in many different communication systems because of its ease of implementation. Because it operates on top of the IEEE 802.15.4 standard the ZigBee protocol can keep low power consumption. The purpose of the ZigBee protocol is to provide a standardized base set of solutions for sensors and control systems. However, since the ZigBee protocol stack must be licensed, other proprietary
protocols have been considered. One of these protocols is SimpliciTI [10].SimpliciTI is a simple
low-power radio frequency (RF) protocol for small RF networks developed by Texas Instruments (TI). It is suitable for devices that require long battery life, low data rates, and low duty cycle. The scale sensor is such a device. It was designed for easy implementation on platforms such as the MSP430 microcontroller and the CC1101 radio transceiver. SimpliciTI will most likely be used for transmitting the weights to the gateway.
Table 5-1: Summary of 802.15 network technologies
Bluetooth UWB ZigBee Standard IEEE 802.15.1 IEEE 802.15.3 IEEE 802.15.4
Transmit Power Low Low Very Low
RF Band 2.4 GHz 3.1-10.6 GHz 868/915Mhz, 2.4GHz
Range 10m 30m 30m
9
5.2 Radio transmitter or transceiver
In order to be able to send information wirelessly from each sensor to a central receiver or receivers, a transmitter or a transceiver is needed. A transceiver is simply a combined receiver and transmitter. Using a transceiver would allow full duplex communication with sensors or actuators. I have considered two low cost radios. These are described in the following two subsections.
5.2.1
RFM02 - transmitter
The Hope Microelectronics Co., Ltd. RFM02 is a low power, single chip radio transmitter. It is capable of transmitting in the 433, 868, and 915 MHz ISM bands. Details of this transmitter module are available at http://www.hoperf.com/rf_fsk/fsk/19.htm.
5.2.2
Texas Instruments CC1101 - transceiver
Francisco Javier Sánchez and Albert López have used the TI CC 1101 [29] in their master's thesis [3] in order to receive and transmit in the 868 MHz band. I can more easily build upon their work if I use the same components. Because this device is a transceiver it can be used to both receive and transmit, providing great flexibility and supporting many possible usage scenarios.
The CC1101 operates at sub 1 GHz frequencies1 and is used for very low-power applications. The
circuit also has a low-cost. It has high sensitivity (-112 dBm) at 1.2kBaud (868MHz), low current consumption (14.7mA) while receiving, and a programmable data rate from 0.6 to 600 kbps.
1 Typically in the 315, 433, 868, and 915 MHz ISM bands; often the ranges: 300-348 MHz, 387-464 MHz and
10
6 Scale
My main focus is a bathroom scale (i.e., a weight sensor) that would collect weight data and wirelessly transmit it to a gateway or via USB. The information would pass over to a server and could be accessed through a web browser or mobile phone. A visualization of the data in form of charts (weight over time) could be shown.
The inner working of a scale is described in section 6.1 and section 6.2 discusses the different power sources that have been considered during the project. Section 6.3 describes the number of different approaches to understand and read data from the scale.
6.1 Inside a digital scale
To be able to read data from the scale a general understanding of a scale’s inner working was necessary. A low cost digital scale makes use of strain gauge technology, i.e., the measurement of strain due to the weight of an object. The electrical resistance of this strain gauge changes as the weight of the object deforms the strain gauge.[11] In the case of a scale the object that stretches causes an increase in electrical resistance. In a scale the bending objects are load cells usually in the form of a bar. Load cells in a scale are transducers that convert the force to analog signals. In a well-designed scale the weight is evenly distributed over one or two load cells. The weight is applied to one end of the load cell causing a change in the electrical resistance. The strain gauge sensors utilize the change in electrical resistance to calculate the applied force. This force is then converted to an analogue signal that is passed through an ADC and calculations are done in the microcontroller and the weight is displayed on an LCD screen.
6.2 Sensor Power
The sensor will most likely be powered over USB at first; however, there is a question of how the sensor should be powered at a later stage, especially considering if it has to power a wireless transmitter. Table 6-1 shows the three different options that have been considered. Perhaps is a combination of two different power sources the ideal solution.
11
Table 6-1: Option to power the microcontroller and radio transmitter
External AA battery pack
The sensor could be powered by an external battery pack with AA batteries. This would provide independent power, sufficient for a long operating time. However, it will increase the cost of the device and clumsiness. The battery pack would require space, which is not always available within the scale. If there is space, then the battery pack would be installed inside the scale, but it still will be an increase in cost.
Scale’s batteries
Instead of using an external battery pack the sensor could make use of the scale’s internal batteries. The disadvantage of this approach is that the sensor will drain the scale’s batteries much quicker than normal. However, some analysis of the cost efficiency and battery lifetime has to done to conclude whether this approach could be beneficial regardless its disadvantages.
The scale that will be used is the Coline RTC3010 that uses one CR2023 battery. The CR2023 battery is a coin cell lithium battery for low power applications. During testing that consisted of connecting the LCD screen pins to an oscilloscope for a couple of hours, the battery was drained. This suggests that using the scale’s battery is not a feasible means to power the system.
Energy harvesting
The system might possibly be powered through harvested energy using piezoelectricity. Piezoelectricity is electrical energy produced from mechanical pressure. [12] It is quite similar to the strain gauge technology. Electrical energy would be produced when the scale is stepped on. The scale could be outfitted with piezoelectric discs and each time pressure is applied to the scale the mechanical pressure would be converted into an electrical charge by the piezoelectric discs and stored (most likely in capacitors) and used as a power source. The question is how much energy is produced and how much energy the system needs.
6.3 Reading weight data
There are different approaches to get the data from the scale. One approach is to snoop the calculated data going to the LCD screen. Another approach would be snooping the voltages from the scale’s sensors and independently calculating the weight. However, each of these approaches raises questions. Is the Wasa board’s ADC accurate enough? Will snooping the data to the LCD screen interfere with the LCD screen’s display? The LCD screen is most likely in different states at different times, at what point should the data be snooped? Or should multiple samples be taken? This section describes a number of initial tests of reading the weight data that were made with a Coline RTC3010 scale.
The RTC3010 is Clas Ohlson’s lower end, digital, simple scale (SKU: 34-5062). It is made out one glass brick and four rubber feet with a compartment at the header of the glass brick for the LCD screen and the electronics. The scale has no advanced features other than the selection of different measurement units: kilogram (kg), pound (lb), or stone (st). Thus this scale does not include features such as inputting and displaying the user’s name or storage of previous weights. The simplicity of the scale enables it to be low power and thus it has only one CR2023 battery. The front and back of this scale are shown in Figure 6-1 and Figure 6-2 (respectively).
12 Inste cells, on printed c electrica cells are
6.3.1
In th the LCD ead of havin ne at each fo circuit board al resistance e combined aDifferent A
his subsectio D screen. ng one or two oot (See Fig d (PCB). Th and this cha and convertedApproach
n I describe Figure 6-1 Figure 6-2 o larger load gure 6-3). Ea e force caus ange is conv d into a weig Figure6-hes to sno
my attempts 1: Front view o 2: Back view o d cells the sc ach load cel sed by the u verted into an ght that is dis -3: Electronicsoop the da
s to snoop the of the scale of the scalecale has a sim l uses strain ser standing n analogue s splayed on th s overview
ta
e data from t mple design n gauge sens on the scale signal. The s he LCD scree the scale’s ex with four sm sors connecte e causes a c signals from en. xisting electr mall load ed to the change in the load ronics to6.3.1.1 The engineer first step wires w different correspo only noi better re sensors bar, hen major ch 6.3.1.2 Fort on both interferin Figure 6 Voltage s first approac ring of the s p was to sold ere connecte t weights th onding weigh ise regardles esult would h could be dir nce it was not
hange to the LCD scre tunately the s sides of the ng with the 6-5 respective ensing ch was to sn scale and cal der additiona ed to an osci hat I applie ht. However ss of the for have been to rectly read. H t possible to physical sca en scale’s desig e PCB. This screen itself ely.
oop the volta libration to m l wires to the illoscope to ed to the sc r, this approa ce applied to solder the ad However, due reach the ap le. gn provided o made it pos f. A front an Figure 6-4: F Figure 6-5: B ages directly map the diffe
e connection look for the cale. These
ach did not o the scale. dditional wir e to the scal ppropriate po other possib ssible to rea nd a back vi Front view of t Back view of t
y from the sen erent voltage ns from the se e differences readings co work as the A different res straight to e’s design, e oints on the s ilities. The L ad the data g ew of the PC the scale PCB he scale PCB nsors. This r e levels to di ensors to the in output fo ould enable e readings di method that o the sensors each sensor i sensors witho LCD screen’ going to the CB are show requires som ifferent weig e PCB. The a or a small nu us to calcu id not chang t might have s. In this appr is covered by hout having t s pins were LCD screen wn in Figure 13 me reverse ghts. The additional umber of ulate the ge; I saw e given a roach the y a metal o make a available n without e 6-4 and
14 The to the LC a zigzag Afte represen one deci The reading signal p correspo were con that dete still able tested fo Thro responsi the first significa most sig to under Ther the purp understa a result made. T initial idea w CD screen, th g fashion whe er some res nted as a seve imal point (D first attempt was done on patterns (see ond to each o nstructed as ermined the e to map diff or different d ough extensi ible for 4 seg t pin (rightm ant pin for a gnificant pin rstand the pu re was still pose of the la
and the patter some extens The second at
was to snoop hus a wire w ere the first p earch on th en-segment d DP), and thre t of reading t n each pin at e Figure 6-8 other and the
bit patterns w segment’s s ferent pattern digits. ive testing an gments, thus most pin in digit was res was respons urpose of the some confus ast 4 pins wa rns and how sive research ttempt is des Figur p the signals was soldered pin was the r he LCD scr digit, as show ee measurem Figure 6-7 the weight d an applied w 8 and Figur e seven-segm where each c state. Withou ns to differen nd observati 2 pins were Figure 6-5) sponsible for sible for the d last 4 pins as sion after the as unclear an
and why the h was carrie cribed in sec re 6-6: soldere going to the onto each pi rightmost pin reen I was wn in Figure ment units 7: Seven-segme data was to fi weight of 0.0 re 6-9) at e ment digit. T change in ph ut much und nt digits and ion was I ab responsible ) was respo r the x-c-b-a d-e-f-g segm s they conne e initial attem nd the bit ord
ey changed a ed out and a ction 6.3.2.
d pins
e LCD screen in, see Figure n (as shown i
able to und e 6-7. The LC
ent digit [4]
ind out which 0 kg. This wa
ach pin and This had me hase in the si derstanding o d segments. E le to come t for a digit. I nsible for th (x being the ments, see Fig ected no segm
mpt of unde der was not u as they did, s second atte n. There are e 6-6. The pi in Figure 6-5 derstand tha CD screen co h pins contro as done by ob d in order f believe that gnal corresp of the patter Each pin was to the conclu I also came t he measurem e decimal poi gure 6-7. How ments on the erstanding th understood. F see Figure 6-mpt to unde 13 pins in to ins were num 5). at each num onsists of fo ol which seg bserving the figure out h the analogu ponded to a b rns themselv s later on re usion that ea to the conclu ment unit. T int) segment wever, I was LCD screen he scale. For Furthermore -8 and Figure erstand the s otal going mbered in mber was ur digits, ments. A different how they ue signals bit, 1 or 0 ves I was cursively ach pin is usion that The least ts and the s not able n. instance I did not e 6-9. As scale was
6.3.2
An L in the fir segment 6.3.2.1. there co horizont intersect on/off, i are suita frequenc technica backplan 6.3.2.1 Ther the follo 6.3.2.1.1 Stati LCD is to be inSecond T
LCD is drive rst test is by t is on or off An LCD ha ould be dedi tal lines in tion of a bac illustrated in ably connec cy which to ally only the nes. Any direTypes of L re are two ty owing section 1 Static LC ic LCDs hav driven throu opposition to Fi Fig
Test
en as a matri itself meani f. Every LCD as also severa cated signal the matrix a ckplane signa Figure 6-10 cted to powe the eyes see segments in ect current (D Figur LCDs ypes of LCD ns. CD ve one backp ugh the input o the backpla igure 6-8: Osci gure 6-9: Oscil ix of signals ingless. How D is driven b al segment s for each se and the segm al and a segm 0. A segmenter and groun ems like all ntersecting w DC) damage
re 6-10: How a
D screens: sta
plane line (pin t of a square
ane signal. T
illoscope readi
lloscope readin
s and so is th wever the inte
by one or ma signals, each egment. The ment signal ment signal d t is illuminat nd. The sign the segment with the activ es the display an LCD is cons atic LCDs a n) and a ded wave. To tu To turn a seg ings of the 1st p ngs of the 2nd he scale’s LC ersection of t any backplan h signal coul e backplane s are the lin determines w ted when bot nals are con ts (for a part ve backplane y [13]. structed as a m nd multiplex dicated line fo urn a segmen gment ‘off’ th pin pin CD display. E two signals d ne signals, as d represent m signals are e nes opposite whether that th a vertical ntinuous and ticular digit) are ON, wh matrix xed LCDs. T or each segm nt ‘on’ the co he segment s Each signal a determines w s explained i multiple seg either the ve e in the mat particular se and a horizo d driven at ) are always hen there are
They are des
ment of the L orresponding signal has to 15 as shown whether a n section gments or ertical or trix. The egment is ontal line a certain ON, but multiple cribed in LCD. The g line has be of the
16 same ph each pha while if as each PCB are 6.3.2.1.2 A m multiple backplan illustrate backplan of frame backplan the volta zero DC during a signals i hase as the b ase determin the differenc segment req e required. Th 2 Multiplex multiplexed L e segments. T ne signal wh ed in Figure nes determin es. For a se ne signal has ages is abov C bias (mean a frame has idle at mid-v backplane sig nes then if th ce is non-zer quires a dedic he microcon xed LCD LCD has se To turn ‘on’ hile the rema e 6-12. A du nes the numb egment to be s to above a ve the thresho value of a si to total out voltage, see F gnal, as show he segment is ro voltage, fo cated pin, a l troller also n Figu veral backpl a segment th aining backp uty cycle is ber of duty cy e visible the a threshold v old the segm ignal) the dif t to zero vol Figure 6-12. Figure 6-1 wn in Figure s on or off. I or instance 3 larger numb needs more o ure 6-11: static lane signals he responsib plane signals s the period ycles during e difference voltage which ment is turne fference betw ltage as sho 12: Multiplexed e 6-11. The d If the differen v the segmen er of pins an output/input p LCD and a singl ble signal is d s are idle dur one backpl one frame. A between the h is usually d on, otherw ween a backp own in Figur d LCD [13] difference be nce is 0v, th nt is on. This nd connection pins. le segment p driven in opp ring that par ane stays ac A wave is a e driven seg ~2.3V. If th wise it is off. plane signal re 6-13[14]. etween the s hen the segm
s design is si ns as well as pin is share position to t rticular duty ctive, the nu continuous gment signal he difference f. To have an and a segme Thus the b signals at ent is off imple but s a larger d among he active cycle as umber of sequence l and the between n average ent signal backplane
6.3.2.2 The responsi (pins) ho drives th segment these co knowled segment should b The scale scale’s LCD ible for 2 seg old each dig he x-c-b-a se t each interse onclusions in dge in the sec t intersected be opposite (p Table 6 B B B B e’s LCD scre D screen is a gments as sh git; that is ea egments and ection betwe n the first t cond test I re between the power and g 6-2: Segments Backplane 0 Backplane 1 Backplane 2 Backplane 3 Figure 6-13: Z een multiplexed hown in Figu ch signal is d the other si een a backpl est, but to c ead two sign e backplane round) durin Figure 6-14: H Figure 6-15 at each interse S 0 2 3 Zero DC bias w d LCD with 4 ure 6-14. As responsible ignal drives lane line and confirm thes nals at once, signal and t ng that phase Horizontal bac 5: Vertical segm ection between Segment lin DP c b a within a frame 4 backplane s previously for 4 segmen the d-e-g-f d a segment se conclusio one backpla he segment e. This is illu ckplane signals ment signals n a backplane l ne 0 e signals. Eac found in the nts (see Figu segments. T line is respo ons with a l ne and one s signal is on strated in Fig s
ine and a segm
Segment lin d e g f ch backplane e initial test ure 6-15). On Table 6-2 sho onsible for. I lot more bac segment sign then the tw gure 6-16. ment line ne 1 17 signal is 2 signals ne signal ows what I came to ckground nal. If the o signals
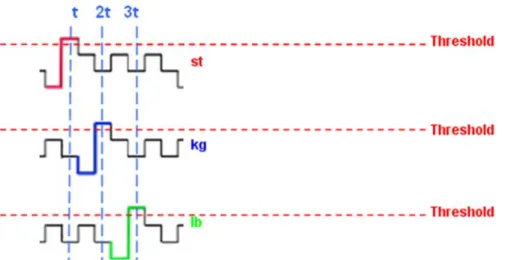
18 Figu 0. As de phase (r backplan Figure 6 b-a and segment The two sign respectiv ure 6-16 illus escribed in s red) the signa
ne signal an 6-15. The sec
as the segm ts are on.
same observ nals that segm
vely.
Figure 6
strates the le section 8.4.2 als are not in d the least s cond-fourth b ment signal is vations were ment is on if 6-16: 2nd pin an ast significan 2.1.2 each se n opposition significant di backplane si s in oppositi e done for d f the signals nd backplane s nt digit pin w egment is illu n (power resp
igit pin inter ignals interse ion to each b different digit are in oppo signals at the v which holds uminated du p. ground), t rsects at the ect with the s backplane at ts of the LC sition, hence value of 0 4 segments ( uring one du
hus that segm segment x, segment sign t each corres CD display. A e connected t (x-c-b-a) at t uty cycle. At ment is off. see Figure nal at the seg sponding pha At the inters to power an the value t the first The first 6-14 and gments c-ase those ection of d ground
19
7 Understanding MSP430
Having figured out the technical details of the scale it was time to familiarize myself with the hardware that is going be used in this project, the Wasa board and the MSP430 microcontroller. The Wasa board is discussed in more detail in Chapter 8, while this chapter covers the MSP430 microcontroller. A brief description of the MSP430 is provided in section 7.1. Section 7.2 focuses on programming. There are courses covering MSP430 programming as it is a broad topic, thus only the relevant parts of programming this chip, such as the ADC, will be briefly discussed in this chapter.
7.1 Texas Instruments MSP430
Prof. Maguire recommended the MSP430 microcontroller as it has been used in several other recent thesis, including the bachelor thesis of Thor Hådén [15]. The TI MSP430 is a low voltage and low power microcontroller that can be used to collect data from sensors, control an actuator, and send and receive data via a radio. It’s a 16-bit RISC microcontroller, where the “16-bit” means that all registers hold 16 bits. The reduced instruction set computer (RISC) acronym means that the controller has a reduced number of core instructions – in this case “only” 27 of them. The MSP430 is a family of controllers including the one used by Hådén: the MSP430F2618. This particular microcontroller is also used on the Wasa board (described in Chapter 3) that I have been experimenting with. The MSP430 operates on a low supply voltage ranging between 1.8 V and 3.6 V. It features a built in 8 channel, 12 bit analogue-to-digital (ADC) and two digital-to-analogue (D/A) converters.The specific MSP430 that I have used is the MSP430F2618. This version of the chip contains 116KB + 256B of Flash Memory and 8KB of random access memory (RAM).
7.2 Programming the MSP430
Understanding the programming syntax of the MSP430 is the most crucial part of this project. This is also where most of the time was spent. A microcontroller is a small computer with a processor, memory and I/O meaning that as a programmer I need to consider all of these aspects. Programming at a low level, for embedded systems could be more difficult than traditional high level programming as many more things needs to be considering, such as I/O, interrupts and clocks. This section describes the steps taken from the very basic understanding of binary to the more complicated understanding of the analogue-digital converter (ADC) and registers. This may be of great help to future students.
7.2.1
Data types and registers
The MSP430 is as most other computers a binary computer. Meaning they operate on ‘1’ and ‘0’. Luckily enough as a programmer I do not need to concern myself with binaries as it may get a bit tricky, the reason is that the compiler sorts out the chosen numeric presentation to binary. The most used numeric presentations are binary, hexadecimal and decimal, in most cases hexadecimal; therefore a clear understanding of hexadecimals is required. Hexadecimal uses 16 symbols to represent numbers, 0-9 followed by A-F, whereof F equals 15 in decimal or 1111 in binary as shown in Table 7-1. Using hexadecimal decreases the number of symbols needed to represent a number. Each symbol in hexadecimal represents 4 bits, enabling one symbol to represent 16 decimal numbers and two symbols to represent 256 decimal numbers. Hexadecimals numbers are denoted with 0x followed by a number of symbols.
20 It is arithmet operatio bitwise o One LED’s v followin The associate connecte As show LED on s very impo tic takes pla ons. Thus a g operations ar e very comm value (GPIO ng pseudo co LED is tur ed with a reg ed to the firs wn in Table and off by X rtant to und ace in binar good understa re AND, OR mon MSP430 O output) wil ode gives a br rned on and gister with 8 st pin (pin 0) 7-2 XOR 1 XOR the sam
Table 7-1 derstand that ry. MSP430 anding of bit R, NOT, and X programmin ll XOR itsel rief clarificat Listing 7-1: B off in a con bits connec ). Setting thi with 1 retur me value with 1: Numeric pre t even thoug 0 programm twise operat XOR, see Ta ng example lf continuous tion; Blinking led – X ntinuous loo cted to 8 pins is bit to 1 tu rn 0 and XO h the current esentations gh hexadecim ming relies h ions is very able 7-2 for t is the blinkin sly, shifting XOR example op every sec s, 1 bit per p rns the pin t OR 1 with 0 contents of t mal notation heavily on r handy. The m their truth tab
ng of a LED from 1 and
ond. I assum pin. I also ass
to high, henc returns 1 res the register. n is used, th registers an most frequen bles. D, to achieve d 0 (on and o me that LED sume that th ce 0x01 (000 sulting in tur he actual d binary ntly used e this, the off). The D_Port is e LED is 00 0001). rning the
Hav importan control I bitwise o An Figure 7 in the re to 0 stop this regi their ass ADC is the sam ADC
7.2.2
The display represen value is represen used to [16], the has an A In th quantiza below fo ADN
inV
= ving refreshe nt registers i I/O. These re operations di interesting a 7-1, found in egister. For in ps the conver ister and the signed names C12CTL0 |= me as startin C12CTL0 |=ADC and
most import are to be i nting the vol known as Q nts a specific represent a e more levels ADC resoluti he scale’s ca ation level of or calculating=
solu DC(
2
Re = Input volta Table 7-2: (a) OR, |= ed my memo in the MSP4 egisters coul iscussed abo and importan n the Texas In nstance settin rsion. See th many other s, as an exam ADC12SC; ng the conver 0x0001; FigGPIO
tant aspect o inputs to th ltage at the s Quantization c voltage thr signal; thus s, the higher ion of 12-bits ase the refer f 4095 (4096 g the decima×
−
R i utionV
V
)
1
age andV ,
R+ : Logical Oper (b) A ory on bitwi 430. The reg ld be 8 or 16 ove. nt register in nstruments, ng bit 0 of A his User Guid registers. To mple: rsion by sayi gure 7-1: ADC of this projec he ADC. Th sampling timand the retu reshold. The dictating the the accuracy s, thus the nu rence voltag 6-1) and 0V al value (quan − + −
−
−
R R R inV
V
V
− RV
= Uppe rations – OR, A AND, &= ise operation gisters that w 6 bits in widt n this projec ‘MSP430x2x ADC12SC to de for furthe o simplify pr ing: C control regist ct is the ADC he ADC wil me. Converti urned value i e ADC’s res e lowest dif y of the samp umber of qua ges are powe has a quanti ntization lever and lower
AND, NOT and
(c) NOT ns it was tim were of inter th. Setting a ct is the AD xx Family -o 1 starts the r detailed ex rogramming ter - ADC12CT C. The analog ll sample th ing the analo s based upon solution dete fference in in pling. The M antization lev er and groun zation level vel) represent reference vo d XOR [16] T, != (d) XO me to unders
rest are the m bit of a regis C control re User Guide’ ADC conver xplanations o the different TL0 gue signals f hese signals ogue voltage n a quantizat ermines how nput voltage MSP430F216 vels are
2
12= nd, 0V and of 0. A gene ting a voltage oltages. OR, ^= stand the ma module regis ster is done u egister ADC ’ [17], shows rsion, while of the differe t bits can befrom the scal and return e to a specif tion level. E w many level we can diff 68 used in thi = 4096. 3V, hence 3 eral equation e [16]: 21 any, very sters that using the 12CTL0. s each bit setting it nt bits of set using le’s LCD a value fic digital ach level ls can be ferentiate is project 3V has a n is given
22
The General Purpose Input Output (GPIO) pins are digital input/output pins that can be used to determine whether a signal at a certain point in time is higher or lower than a set voltage threshold. If the voltage is higher than the threshold the GPIO register returns a logical ‘1’ or if lower it returns a logical ‘0’. Note that this assumes that the relevant GPIO register’s bit is set as input. In the example shown in Listing 7-1 the GPIO is set as output therefore setting a bit in the register as ‘1’ or ‘0’ determines the output of the associated GPIO pin (as high or low). There are 8 GPIO pins on the Wasa board used in this project. They are controlled by port 5. Each port has a number of control registers. The most interesting registers in our case are:
P5DIR This selects whether a pin is output or input. A logical ‘1’ sets the pin as
output.
P5SEL This sets whether a pin is GPIO or an internal module.
P5IN This holds the logical value at the input pin
7.2.2.1 Sampling
Sampling frequency is the rate at which the signal is captured, assuming that the signal is continuously sampled. The ADC allows different sampling modes. One of these modes is chosen by setting the second and first bits in the ADC control register ADC12CTL1as shown below.
ADC12CTL1 |= CONSEQx The available modes are:
CONSEQ0 Single Channel sampled once (0x00)
CONSEQ_1 Sequence of Channels sampled once (0x01)
CONSEQ_2 Single Channel sampled continuously (0x02)
23
8 Initial experiments
The experiments described in this section were conducted (2012-03-28) at the Department of Communication Systems (CoS) in the laboratory of Professors Smith and Maguire, in the Electrum building, located in Kista, Stockholm, Sweden. The lab provided all the tools and equipment used in the experiments.
8.1.1
Purpose
The purposes of these experiments were to gain some experience, to get an overview of the hardware used on the Wasa board, and to understand the potential uses of a device similar to the Wasa board. As we had very little experience in hardware, all of the experience from these experiments was of great help in planning what we would do for the rest of our thesis project. We especially wanted to see how the MSP430 worked and how it could be used. We also wanted to examine the use of sensors and to understand how this sensor data could be sent and displayed on a computer.
8.1.2
Approach
We started by investigating the Wasa board and its components. The components that were most interesting for us were the MSP430 microcontroller, FT232RL USB client controller, and the different sensors. We looked at how these components were connected and how additional sensors could be easily added to the board.
We read Prof. Mark T. Smith’s description of the Wasa board version 1.7 [18] to gain an understanding of how we could read and display sensor data on our laptop computers. We downloaded the virtual COM port (VCP) driver suggested by Prof. Smith, installed a terminal to handle the message passing, and connected the Wasa board to the computer via a USB cable. It turned
out that the VCP driver was actually unnecessary, as the Windows 7operating system automatically
downloaded the correct driver (v2.8.14.0) and installed it.
8.1.3
Communication
A computer can talk to the Wasa board via a USB interface. The board uses the FT232RL USB client controller and the drivers are available online for multiple platforms [19]. For our initial experiments we used a Windows 7 computer with the “Tera term terminal emulator” [20] installed. Prof. Mark T. Smith has an excellent guide [18] on his webpage that helped us with the setup.
We tested some of the commands that Prof. Mark T. Smith lists on his website. [21] It should be noted that all of these commands take the form of an “AT” command, such as one might use with a modem, but in this case these commands are interpreted by the software that was installed by Prof. Smith in the Wasa board.
8.1.3.1 Accelerometer
The accelerometer was tested by simply reading a value when the board was lying on the table and then reading another value when the board was held at an angle. This measurement measures the gravitational force as a vector, relative to the 3D accelerometer’s axes. The command to get the accelerometer’s current value is: AT+OAW? The command and its corresponding output for these two measurements were:
>AT+OAW? +OAW: -2,-2,20 OK >AT+OAW? +OAW: -1,-21,-3 OK
24
We note the large change in the values of the Y and Z axes between these two measurements. 8.1.3.2 Temperature sensor
The temperature sensor was tested by first reading a control value and then rubbing a finger gently on the surface of the sensor to increase the sensor’s temperature. The command to read the temperature sensor’s value and its output for these two cases were:
>ATS204? 1946 OK >ATS204? 1673 OK
Note that the resistance of the thermal sensor decreased, hence the voltage drop across the sensor (which determines the value read from this sensor) also decreased when the sensor was warmed. Given the specifics of this negative temperature coefficient sensor it is possible to translated the value to a temperature in degrees centigrade
8.1.3.3 Light sensor
We took several measurements with the light sensor on the Wasa board. First we took a control value, this value was given by just exposing the sensor to the normal light in the lab. We later covered the sensor with a finger and another value was output from sensor. These commands and their respective output values were:
>ATS203? 522 OK >ATS203? 3853 OK
In this case the resistance of the light sensor increases when there was less light. If one use the specific characteristics of this sensor one could calibrate the sensor’s output and get a light level in lux.
8.1.3.4 Wasa Board info
There is a command that returns information about the Wasa board. The “GMM” command returns the hardware version number and the “GMR” returns the software version number. These commands and their respective outputs were:
>AT+GMM? +GMM: Wasa_1.7 OK >AT+GMR? +GMR: 12.25.2011 OK
8.1.4
Code
We took a quick look at the software written by Prof. Smith to gain some insight into how to program the MSP430. The software was written in C and included an MSP430x26x header file that
25 contains standardized identifiers and functions to program the MSP430. The code is available from Prof. Smith’s homepage [22].
8.1.5
Results
These experiments gave us a basic understanding of how we could communicate with the Wasa board and the MSP430 to collect data. We also got a clearer picture of the components and the complexity of the Wasa board, which was useful to help us plan the next phase of our thesis project. This experiment also provides some basic knowledge about the tools we needed to use to communicate, program, and monitor the Wasa board and the MSP430. This experience also gave us greater confidence regarding our project and future work, which we needed.
8.1 Software experiments
We conducted several software experiments on 2012-03-30. These experiments are described in further detail in this section.
8.1.1
Purpose
Our goal was to investigate the software used in the Wasa board version 1.7. Prof. Smith provides both the source of the software [22] and a guide [23] about how to set up the programming environment and what tools are used to program the MSP430 microcontroller used on the Wasa board. Our main goal was to be able to load a modified version of the original software onto the board and to have this modified software operate as we expected.
8.1.2
Approach
By reading the guide that Prof. Smith provides on his website [23] and the “Users guide” that Texas Instruments provides on their website [24] we were able to modify the software to alter the output of a command. We decided to modify a simple string to see if we could successfully compile and install the modified software. The string we decided to change was the one that was displayed when reading the accelerometer. The function which outputs a string has the form: mts_puts(string). Thus we replaced mts_puts("+OAW: ");withmts_puts("+OAW (TEST): ").
As described by Prof. Smith, we had to download TI’s Code Composer Essentials (CCE) to compile and generate a TI-TXT file to be loaded into the microcontroller. When searching for CCE at TI’s homepage we found that they also referred to another program called Code Composer Studio (CCS). The CCS software is an updated and extended version of the CCE software, so we decided to download and use the CCS software instead. We modified the original software and made the proper settings (i.e., selecting the right microcontroller: MSP430F2618, and set the proper output format: TI-TXT format). We built the project to generate a TI-TXT output file. In order to load the modified code into the microcontroller we had to download a BSL scripter and write a script file to instruct the BSL scripter. We used the script proposed by Prof. Smith in his user guide [23] and only modified the name of the file that was to be loaded into the microcontroller. We ran the Biological Scripting Language (BSL) scripter together with the script file and (eventually) successfully loaded the modified program into the microcontroller.
8.1.3
Problems
We encountered several problems while conducting this experiment. The first problem that we ran into was a problem with the compiler version. We imported the original project written by Prof. Smith, which had been compiled by a different version of the CCS or CCE software than what we had on our computer. Because of this we could not build the project. We searched the Internet to find a solution to this problem, but found nothing. We eventually looked at the different options and settings of the CCS software and discovered the compiler version option and changed it from version 3.0.1 to version 4.1.0.B1, which solved the problem.
Another problem that we encountered was due to multiple connections to the Wasa board. Because we were already connected to the Wasa board by a terminal program, a new connection