Assessing supply chain
resilience within the
automotive industry in
the event of a pandemic
MASTER THESIS WITHIN: Business Administration NUMBER OF CREDITS: 30
PROGRAMME OF STUDY: International Logistics and Supply Chain Management
AUTHOR: Jan Schliebener and Thomas Nickel JÖNKÖPING May 2021
A multiple case study of the COVID-19 disruption in
the Scandinavian and German automotive industry
i
Acknowledgements
This master thesis represents the last step of our two-years advantage at the JIBS in Sweden towards our master’s degree. Despite the challenging times, it was an exciting and interesting avenue to conduct this thesis.
We would like to take this opportunity to express our gratitude to everyone who supported us on our journey. At first, we would like to thank our supervisor, Imoh Antai, for his guidance and assistance. We really appreciate the amount of time he took to provide us with fruitful insights and helpful remarks. He motivated us throughout the whole process, and for sure, his great effort has its positive impact on this thesis.
Further thanks go to our seminar group and fellow students who gave us plenty of feedback and took their time to discuss our study, and guided us in the right direction.
Moreover, we would like to express our deep appreciation to all the respondents of our case companies. Especially during crises times like now, we do not take it for granted that so many experts took their time to provide us with data for our master thesis. Hence, we would like to
thank all the experts from the automotive industry for taking part in our interviewsand granting
us all the information and insights.
Finally, we would like to extend our gratitude to our friends and families, who supported us throughout the whole process of this thesis and provided us with great advice and feedback. Tack så mycket!
Jan Schliebener & Thomas Nickel Jönköping, Sweden, May 24, 2021
ii
Master Thesis in Business Administration
Title: Assessing supply chain resilience within the automotive industry in the event of
a pandemic
Authors: Jan Schliebener and Thomas Nickel
Tutor: Imoh Antai
Date: 2021-05-24
Key terms: Supply chain management, supply chain resilience, disruption, trajectory,
performance, measures, strategies, COVID-19, Automotive, Scandinavia, Sweden, Germany
Abstract
Background: The automotive industry experiences significant challenges such as
electric mobility, autonomous cars, smart factories, and ridesharing. Above that, the COVID-19 pandemic did not only affect the global health care system but also caused a disruption that challenged the automotive manufacturing sector and its supply chains.
Purpose: The automotive industry was investigated to assess the supply chain
resilience during the COVID-19 disruption. Therefore, the supply chain performance along the disruption stages was determined. Also, the usage and value of supply chain resilience measures were explored to characterise the current state of supply chain resilience in the industry.
Method: A multiple case study and purposeful sampling were used to gather
empirical data. Semi-structured interviews with 21 automotive experts from the Scandinavian and German automotive industry were conducted. A content analysis approach was applied to analyse the primary data. The investigation was supported by a systematic literature review prior to the study and additional company reports as secondary data.
Conclusion: The level of supply chain resilience within the automotive industry can be
assessed as high. A quick recovery and a corresponding rebound of the production volume can be identified, even though the findings indicate that the COVID-19 disruption also caused a bullwhip effect. To compensate for this effect, agility measures, increased collaboration and information sharing, and risk management were used. Other supply chain resilience measures like technological innovations or sustainability were only used to a limited extent.
iii
Table of Contents
List of Figures ... v
List of Tables ... v
Abbreviations ... v
1.
Introduction ... 1
1.1 Background ... 1 1.2 Problem statement ... 2 1.3 Purpose ... 3 1.4 Delimitations ... 5 1.5 Outline ... 52.
Theoretical framework ... 6
2.1 Resource-based view ... 62.2 Automotive supply chains ... 7
2.2.1 Multi-tier structure ... 7
2.2.2 Industry-specific characteristics ... 9
2.3 Supply chain risk management ... 10
2.4 Supply chain resilience ... 12
2.4.1 Concepts of supply chain resilience ... 12
2.4.2 Measures of supply chain resilience ... 16
2.4.3 Assessment of supply chain resilience ... 20
2.4.4 Outcomes of supply chain resilience ... 21
2.5 Conclusion of theoretical study ... 21
3.
Methodology ... 23
3.1 Research philosophy ... 23
3.2 Primary data – multiple case study ... 24
3.2.1 Sampling strategy and process ... 25
3.2.2 Interview procedure ... 28
3.2.3 Data analysis procedure ... 29
3.3 Secondary data ... 30
3.3.1 Data and reports of case companies ... 30
3.3.2 Systematic literature review and article sampling ... 31
3.4 Research quality ... 32
3.5 Ethical reflection ... 34
4.
Description of empirical findings ... 35
4.1 Supply chain performance regarding the COVID-19 disruption ... 35
4.1.1 Preparation for COVID-19 disruption ... 35
4.1.2 Production stoppages after COVID-19 disruption ... 36
4.1.3 Restart and recovery after COVID-19 disruption ... 37
4.1.4 Backlashes after COVID-19 disruption ... 38
4.2 Supply chain resilience measures regarding the COVID-19 disruption ... 39
4.2.1 Supply chain (re-) engineering ... 42
4.2.2 Supply chain collaboration ... 44
4.2.3 Agility ... 45
4.2.4 Supply chain risk management culture ... 47
iv
4.2.6 Sustainability ... 49
5.
Data analysis and interpretation ... 51
5.1 Analysis of supply chain performance ... 51
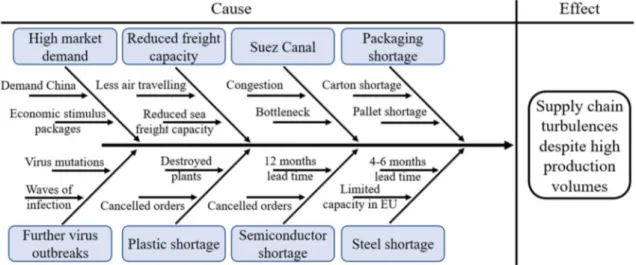
5.1.1 Supply chain turbulences despite high production volumes ... 54
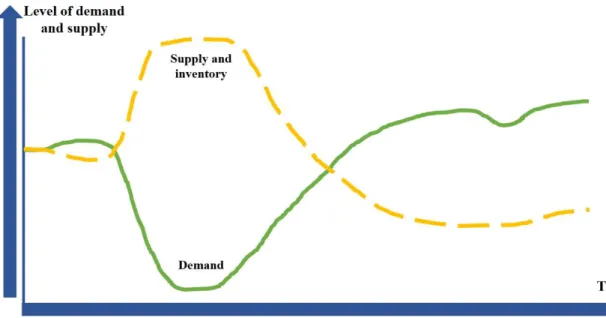
5.1.2 Demand-supply gap and bullwhip effect ... 56
5.2 Supply chain resilience measures ... 59
5.2.1 Supply chain (re-) engineering ... 61
5.2.2 Supply chain collaboration ... 62
5.2.3 Agility ... 63
5.2.4 Supply chain risk management culture ... 64
5.2.5 Technological innovations ... 65
5.2.6 Sustainability ... 66
6.
Conclusion ... 68
7.
Discussion ... 70
7.1 Managerial and societal implications ... 70
7.2 Theoretical implications ... 71
7.3 Limitations ... 72
7.4 Future research ... 73
8.
Bibliography ... 74
v
List of Figures
Figure 1: Automotive supply chain tiers ... 7
Figure 2: Stages of disruption ... 13
Figure 3: Creating the resilient supply chain ... 14
Figure 4: Thesis structure ... 23
Figure 5: Application of holistic multiple case study design ... 25
Figure 6: Coding scheme ... 30
Figure 7: COVID-19 disruption impact on supply chain performance .. 52
Figure 8: Causes of SC turbulences despite high production volume .... 54
Figure 9: Demand-supply gap after COVID-19 disruption ... 57
List of Tables
Table 1: Overview of SCRes measures in theory ... 18
Table 2: Overview of companies in the case study sample ... 27
Table 3: Overview of SCRes measures in practice ... 40
Table 4: SCRes measures during varying disruption conditions ... 60
List of Appendices
Appendix 1: SCRes definition matrix ... i
Appendix 2: SCRes concept matrix ... ii
Appendix 3: Interview request ... iii
Appendix 4: Interview guide ... iv
Appendix 5: GDPR Thesis Study Consent Form ... v
Abbreviations
COVID-19 Coronavirus disease 2019
DSM Decision support model
EDI Electronic Data Interchange
ERP Enterprise-Resource-Planning
FKG Fordonskomponentgruppen
GPS Global Positioning System
JIT Just-in-time
KPI Key performance indicators
OEM Original Equipment Manufacturer
RBV Resource-based view
RFID Radio-Frequency Identification
SCM Supply Chain Management
SCRes Supply Chain Resilience
SCRM Supply Chain Risk Management
1
1. Introduction
_____________________________________________________________________________________
In the following chapter, we introduce the scope of this master thesis. We inform about the impact and challenges of the COVID-19 disruption on global supply chains and automotive supply chains in specific. Based on these challenges, we define the problem and purpose of the thesis and illustrate the delimitations and outline of this study. ______________________________________________________________________ 1.1 Background
The Coronavirus disease (COVID-19) was first discovered in December 2019 in Wuhan, China (WHO, 2021). It led to a pandemic with worldwide 167 million infections and 3.5 million deaths by the time we conducted this research (Johns Hopkins University, 2021). Moreover, COVID-19 does not only affect the global health care system but also revealed the vulnerability of the manufacturing sector and its supply chains to risks and disruptions (CIPS, 2020; van Hoek, 2020). Wuhan, the centre of the COVID-19 outbreak, is a significant hub of car-component manufacturing that supplies the major global automobile manufacturers with critical parts (LMC, 2020; Belhadi et al., 2021). Consequently, it caused production stoppages globally when Wuhan became a quarantine region in February 2020, even though the virus did not spread in Europe and the United States of America (USA) yet (Hofstätter et al., 2020). The situation worsened in March 2020 when up to 3500 facilities of the automotive and industry sector were unavailable due to their location in quarantine areas within China, South Korea, and Italy (Linton & Vakil, 2020; Statista, 2020).
However, the automotive industry managed to stabilise their supply chains over the rest of the year 2020 and mitigate the impact on the global passenger car market to a decline of 17% of the sold units compared to the previous year (Japan Times, 2020; VDA, 2020; Statista, 2021; Volkswagen AG, 2021). Nevertheless, the recent chip shortage in January 2021 revealed that the disruption is still causing backlashes in the supply chain. The car manufacturers faced an unexpected high consumer demand rebound which could not be fulfilled in the short-term with the current chip supply capacity and led to production stoppages (BBC, 2021; Bloomberg, 2021; DW, 2021; Reuters, 2021).
In conclusion, the COVID-19 disruption will continue to influence the automotive supply chains. The Boston Consulting Group and McKinsey estimate that it will take two years
2
or more for the global car industry to recover from the pandemic disruption (BCG, 2020; Hofstätter et al., 2020). Nevertheless, the automotive industry was already experiencing significant challenges before the COVID-19 outbreak, such as electric mobility, autonomous cars, smart factories, and ridesharing (Hofstätter et al., 2020). The automotive supply chains are also of interest due to the high global economic significance of the automotive industry (Belhadi et al., 2021). Moreover, the automotive industry played a significant role in prior supply chain research and literature (Womack et al., 1990; Holweg, 2007). Thus, various reasons support an investigation of the automotive supply chains, particularly concerning the COVID-19 disruption, which severely affected the automotive supply chains.
1.2 Problem statement
Supply chain disruptions are distinguished between internal (e.g. plant fire) and external disruptions (e.g. economic shock, natural disaster). However, both types decline the operational and financial performance if they are not handled adequately (Hendricks & Singhal, 2005; Hohenstein et al., 2015). The COVID-19 disruption can be aligned with previous unexpected external supply chain disruptions such as terrorist attacks, tsunamis and floods, financial crises, earthquakes, or other diseases (Wagner & Bode, 2006; Stecke & Kumar, 2009; Abeysekara et al., 2019; Notteboom et al., 2021).
The frequency and severeness of these disruptions increased in the last decade due to globalisation, climate change, a fast-changing business environment, and the growing complexity and uncertainty of global supply chain networks (Blackhurst et al., 2005; Craighead et al., 2007; Hohenstein et al., 2015). Therefore, the changing environment requires a change of supply chain capabilities. Supply chains do not only need to be efficient but also resilient to decrease the vulnerability to risks and disruptions (Blackhurst et al., 2005; Christopher & Holweg, 2011; Kamalahmadi & Parast, 2016; Sheffi, 2019). The COVID-19 disruption emphasises the urgency for supply chain resilience (SCRes) since it exposed the increasing dependence on China as the single-country source of supply (Hohenstein et al., 2015; Hofstätter et al., 2020; Linton & Vakil, 2020). Consequently, a McKinsey (2020) survey revealed that 93 per cent of the supply chain executives at leading global companies plan to make their supply chains more resilient.
3
Following previous researchers, SCRes is embedded in supply chain risk management (SCRM) (Blackhurst et al., 2011; Ivanov et al., 2014; Hohenstein et al., 2015). SCRM is defined as “an inter-organisational collaborative endeavour utilising quantitative and qualitative risk management methodologies to identify, evaluate, mitigate and monitor unexpected macro and micro-level events or conditions, which might adversely impact any part of a supply chain” (Ho et al., 2015, p. 5036). Subsequently, Ponomarov and Holcomb specify SCRes as “the adaptive capability of the supply chain to prepare for unexpected events, respond to disruptions, and recover from them by maintaining continuity of operations at the desired level of connectedness and control over structure and function“ (2009, p.131).
Several scholars already frame the COVID-19 disruption from a SCRes perspective and recommend resilience measures and recovery paths (Dertouzos et al., 2020; Hofstätter et al., 2020; Linton & Vakil, 2020). Also, the first literature reviews in the field of SCRes were conducted to examine a new post-COVID-19 research agenda (Free & Hecimovic, 2020; Queiroz et al., 2020; van Hoek, 2020; Zhu et al., 2020). Above that, other researchers focus on technical or sustainable measures to increase post-COVID-19 SCRes (Ivanov & Dolgui, 2020; Nandi et al., 2020; Salmi et al., 2020; Sarkis, 2020). Additionally, further investigations simulate the long-term disruption impacts on supply chains under the aspect of SCRes (Ivanov, 2020; Singh et al., 2020; Shahed et al., 2021). However, our literature review revealed two research gaps in the current SCRes literature. First, the research was conducted at the beginning of the pandemic. Hence, more profound insights about the supply chain performance of the automotive industry can be explored after one year of the initial COVID-19 disruption. Second, there is a gap between SCRes research and practice (van Hoek, 2020). The current literature is thin concerning the usage and value of SCRes measures due to the COVID-19 disruption.
1.3 Purpose
This research aims to close the identified research gaps by gathering feedback from the automotive industry to analyse and assess the SCRes concerning the COVID-19 disruption. We conduct a qualitative multiple case study with interviews of automotive supply chain experts from Scandinavia and Germany, focusing on three aspects of SCRes in the automotive industry. First, the COVID-19 disruption has already exposed the
4
automotive supply chains to varying disruption conditions from December 2019 until March 2021, the date we started to conduct our research. Consequently, we want to analyse and visualise the effects of the disruption on the trajectory of the supply chain performance in the automotive industry. As a result of our literature review, we rely on the eight stages of disruption of Sheffi and Rice (2005) to structure the trajectory. Furthermore, the analysis of the supply chain performance concerning the COVID-19 disruption enables us to assess the SCRes of the automotive industry. Also, this aspect lays the foundation for further analysis of the impact of SCRes measures.
Second, the research problem revealed that the current literature focuses on identifying and recommending possible SCRes measures. However, it is unclear which measures were used in the industry during the varying conditions of the COVID-19 disruption. Hence, we focalise on our interviewed automotive supply chain experts to identify the used SCRes measures to support our assessment. Furthermore, we analyse how these measures were used over the varying disruption conditions. To structure this analysis, we synthesise and categorise SCRes measures in our theoretical study. This framework is based on six categories: supply chain (re-) engineering, collaboration, agility, risk management culture, technological innovation, and sustainability. The first four categories are based on Christopher and Peck (2004). The last two categories are derived from various sources of the literature review to acknowledge the emerging relevance of these topics in the recent SCRes literature (Rajesh, 2018b; Ivanov et al., 2019).
Third and last, we determine the value of the SCRes measures that were used in practice. We assume that some SCRes measures are more valuable and practical for the interviewed supply chain experts than other SCRes measures based on different aspects. The disruption phase, the location, or the supply chain structure of the affected automotive companies might be such possible aspects that influence the suitability of SCRes measures. In line with the second aspect, we rely on the synthesis and categorisation of SCRes measures to structure this research element. In summary, these three aspects of our research goal are explored with the help of the following research questions:
RQ1: How can the trajectory of the COVID-19 disruption be described and visualised regarding the supply chain performance in the automotive industry?
5
RQ2: How have supply chain resilience measures been used in the automotive industry in the varying disruption conditions of the COVID-19 disruption?
RQ3: How valuable were the supply chain resilience measures that had been used in the automotive industry in the varying disruption conditions of the COVID-19 disruption? 1.4 Delimitations
This study follows a qualitative approach to assess SCRes beyond the available quantitative data. We want to receive insights and impressions from the supply chain experts of the automotive industry about the COVID-19 disruption since a significant number of assessment attributes of SCRes are also of qualitative characters such as subjective descriptions and linguistic expressions (Rajesh, 2019a). However, we acknowledge the lack of objectivity related to qualitative studies (Easterby-Smith et al., 2018). Therefore, we rely on multiple cases and further triangulation by developing theoretical frameworks prior to the empirical investigation and using additional company data. Furthermore, the research is conducted in Spring 2021 while the COVID-19 pandemic is still present. Since we investigate the COVID-19 disruption that took place in Spring 2020, we assume that it is feasible to describe the supply chain performance and resilience measures concerning this disruption. Last, due to the economic impact and the relevance in supply chain literature, we only focus on the automotive industry (Womack et al., 1990; Holweg, 2007; Belhadi et al., 2021). The investigation of other industries would enable the comparison and increase the validity (Yin, 2017). Nevertheless, it would exceed the limitations of this study.
1.5 Outline
Our study is divided into seven chapters. After the introduction in Chapter 1, we lay the theoretical foundation for automotive supply chains, SCRM, and SCRes in Chapter 2. Then, we explain our multiple case study, the purposive sampling, and the content analysis procedure in Chapter 3. Chapter 4 encompasses our research findings of the supply chain performance and the SCRes measures while analysing and interpreting the data in Chapter 5. At last, we provide a conclusion in Chapter 6 and discuss our study in Chapter 7.
6
2. Theoretical framework
_____________________________________________________________________________________
This chapter establishes the theoretical background of this thesis. First, we introduce the resource-based perspective that we take in our study. Then, we illustrate the essential aspects of automotive supply chains. Third, we present the fundamentals of supply chain risk management that are relevant to our research. Last, we execute our systematic literature review to outline the relevant concepts and measures of supply chain resilience. ______________________________________________________________________ 2.1 Resource-based view
Concerning the theoretical perspective, we approach our study from a resource-based view (RBV). Within strategic management, identifying the sources of competitive advantage is a major research topic (Porter, 1985; Barney, 1991). Based on the RBV, we assume that competitive advantage is achieved with specific resources and capabilities that a firm owns or could develop. By exploring these resources and capabilities, it can be clarified how firms gain a competitive advantage over other firms (Barney, 1991; Newbert, 2008; Nandi et al., 2020). Resources are defined as the assets that a firm has access to or possesses. It can distinguish between tangible resources like infrastructure or intangible resources such as information sharing (Grössler & Grübner, 2006; Brandon‐ Jones et al., 2014). Moreover, single resources may not lead to a competitive advantage until they are integrated into a bundle of resources to develop capabilities (Newbert, 2007; Sirmon et al., 2008; Brandon‐Jones et al., 2014).
The RBV is helpful to understand and frame how uncertainty can be reduced, and SCRes can be leveraged (Blackhurst et al., 2011; Bode et al., 2011; Ambulkar et al., 2015; Cheng & Lu, 2017). For instance, the buffering and bridging of resources helps to reduce uncertainty and mitigate the disruption impact, while SCRes can be leveraged by resource reconfiguration (Bode et al., 2011; Ambulkar et al., 2015). Also, several scholars relate resources and capabilities to SCRes measures that positively impact SCRes, leading to a competitive advantage (Brandon‐Jones et al., 2014; Dubey et al., 2017; Rajesh, 2019b; Ji et al., 2020). Therefore, we take an RBV to examine when and how supply chain entities create SCRes (Barney, 1991; Cheng & Lu, 2017).
7
2.2 Automotive supply chains
Supply chain management (SCM) as a concept emerged in the literature during the 1980s by Oliver and Weber (1982), who described the connection of logistics with other operational functions (Khojasteh, 2018). This concept gained popularity since globalisation led to more complex supply chain structures. In addition, the time and quality-based competition forced enterprises to organise the flow of materials in and out of the company more efficiently (Mentzer et al., 2001; Ribeiro & Barbosa-Povoa, 2018). SCM is understood as managing the product, information, cash, and demand flow from the first supplier in the supply chain to the final customer (Coyle et al., 2016).
Regarding that a car has up to 6,000 components, the SCM is critical within the automotive industry to ensure the described flow of material, information, and cash to prevent supply shortages and the resulting costly production stoppages (Boysen et al., 2015; Falsafi et al., 2018). Due to this challenging environment, the automotive industry became a reference for other industries, especially SCM (Cox, 1999; Thomé et al., 2014). Since we investigate the SCRes of the automotive industry, our study needs to introduce the necessary context regarding automotive supply chains. Consequently, we present the multi-tier structure and the relevant characteristics that influence the impact of the COVID-19 disruption on the automotive industry.
2.2.1 Multi-tier structure
We illustrate the multi-tier structure of automotive supply chains to enable the characterisation and classification of the automotive companies that are part of our empirical study. Figure 1 simplifies the structure of the automotive supply chain and points out that it consists of several entities that are subsequently described.
Figure 1: Automotive supply chain tiers
8
The original equipment manufacturer (OEM) who designs, produces, and brands the car as the end-product has a pivotal role in the automotive supply chain (Carbone & Martino, 2003). Further, the OEM can be described as a supply chain leader who takes a significant role in coordinating and overseeing the supply chain (Mentzer et al., 2001). Also, the OEM has a dominant power relationship with its suppliers, which allows the OEM to enforce innovations and concepts in the upstream supply chain tiers (Cox, 1999).
Next, the first-tier supplier can take the role of a quality buffer, enhancer of productivity, system developer, purchaser, designer, or problem solver to relieve the OEM (Hines, 1998). Doran (2004) further characterises the first-tier suppliers based on a continuum. On the one end, the mature first tier has the capacity and competence to ensure the global supply of modules. Further, the mature first tier has high-quality standards, a global presence and owns critical areas of the modular supply chain. The developing first tier is in the middle of the continuum. These suppliers also have a second-tier business, and they enhance their supplier relationship skills to achieve a better position. At the other end, the fringe first tier is primarily a second-tier supplier who also has a first-tier business but who is only a marginal player regarding the modular supply (Doran, 2004).
Then, the second-tier suppliers are mainly indirect suppliers to the OEMs with few opportunities to supply the OEMs directly. Further, they can be divided into two groups. The first group is the component manufacturer who is specialised in a specific component such as metal stamper or injection moulder. They are responsible for designing and testing the specific component, but not for the superordinate subassembly of the module the component belongs to. The second group is the subassembly manufacturer who produces a subsystem such as steering columns or batteries. Likewise, the subassembly is responsible for the design and production of the subsystem, but not for the whole module (Veloso & Kumar, 2002; Vazquez et al., 2016).
Last, the third tier and raw material supplier are characterised. These suppliers have a more diversified portfolio and supply several industries with their raw materials. Therefore, they are less dependent and focused on the automotive industry than the prior downstream supply chain tiers (Lind et al., 2012). However, this group also includes third-tier suppliers who provide raw materials specifically for the automotive industry (Carbone & Martino, 2003).
9
2.2.2 Industry-specific characteristics
Based on Thun and Hoenig (2011), two industry-specific supply chain characteristics are considered essential since they contribute to increasing supply chain risks and thereby influence the SCRes of the automotive industry. These characteristics are the growing complexity due to the increasing globalisation and the simultaneous importance of lean and efficient supply chains (Thun & Hoenig, 2011).
Globalisation as the first characteristic encompasses reducing trade barriers and deregulation of commerce that enabled global production networks. The main driver of globalisation is the potential of cost reduction due to lower production costs (Mondragon et al., 2006; Bechmann & Scherk, 2010). Therefore, the automotive supply chains are characterised by highly complex global networks that involve long transportation segments and require a high level of coordination (Kleindorfer & Saad, 2005). Also, a consequence of the length and complexity of the global supply chains is the increased vulnerability to disruptions (Blackhurst et al., 2011).
The second characteristic of the automotive SCM is lean management which Toyota initially introduced to minimise waste and increase efficiency (Womack et al., 1990; Cox, 1999). Toyota’s success encouraged other car manufacturers to copy the system of a leaner, demand-pull, and outsourced production that relies on just-in-time (JIT) deliveries (Cox, 1999; Iskandar et al., 2001; Wagner & Silveira-Camargos, 2012). The JIT concept requires that materials and parts are delivered in the correct quantity when the OEM needs them in production. Lean management is seen as a competitive advantage (chapter 2.1) in the automotive industry improving cost, quality, flexibility, and technology (Scannell et al., 2000; Boysen et al., 2015).
Nevertheless, it requires a high level of information exchange and collaboration. In particular, the information flow is needed in both ways. The upstream information flow contains the order or demand information that enables the improvement of scheduling and inventory control. The downstream information flow involves the order progress information, volumes, delivery dates, and quality. Furthermore, these information flows are also critical to increase overall agility and supply chain performance (Childerhouse et al., & Towill, 2003). Several technologies are recommended to improve the information flows. Iskandar et al. (2001) and Childerhouse et al. (2003) assume the utilisation of
10
electronic data interchange (EDI) to enable intense information exchange, whereas Mondragon et al. (2006) recommend the usage of web services or RFID (radio-frequency identification) to increase visibility. However, the lean framework, including the JIT system, is still vulnerable to disruptions and can cause worldwide shortages. Hence, the call to increase safety stocks intensifies (Thun et al., 2007; Zhu et al., 2020).
2.3 Supply chain risk management
As indicated by the industry-specific characteristics of automotive supply chains (chapter 2.2.2), supply chains are confronted with increasing risks that could negatively impact the firm’s profitability (Kumar et al., 2010). Thus, companies must find strategies to deal with the different risk types (Daultani et al., 2015). Risks within supply chains are defined as “any risks for the information, material and product flows from the original supplier to the delivery of the final product for the end-user” (Jüttner et al., 2003, p. 200). Thereby, supply chain risks expand beyond the boundaries of the single entity, and the boundary covering flow can become a cause of supply chain risk by itself (Jüttner, 2005). Hence, SCRM became an essential part of SCM (Khojasteh, 2018).
SCRM is defined as “an inter-organisational collaborative endeavour utilising quantitative and qualitative risk management methodologies to identify, evaluate, mitigate and monitor unexpected macro and micro-level events or conditions, which might adversely impact any part of a supply chain” (Ho et al., 2015, p. 5036). Based on that definition, it is vital for an enterprise to identify and assess risks besides developing appropriate risk-mitigation strategies (Manuj & Mentzer, 2008; Ho et al., 2015).
First, a risk identification process initiates the SCRM activities since it aims to discover all risks and evaluate their significance (Kern et al., 2012). Thereby, the risk identification process also embraces a classification of the different risk types (Neiger et al., 2009). Supply chain risks are classified as supply risks, demand risks, manufacturing risks, financial risks, information risks, transportation risks, or macro risks (Ho et al., 2015). Supply risks occur when a company is implementing an outsourcing or offshore-sourcing strategy. As the total costs are supposed to decrease with this strategy, the default risk and the level of uncertainty also increase (Wu et al., 2013). On the other side, demand risks arise due to the difficulty to forecast demand accurately. There is a risk caused by transmission and amplification of order variability throughout a supply chain, the
so-11
called bullwhip effect (Lee et al., 1997). The risk for the bullwhip effect increases due to the rapidly changing environment and the difficulty to implement accurate forecasts (Kim, 2013).
Manufacturing risks describe adverse events that might occur within a company’s scope, like personnel lacking knowledge and ability to handle new processes (Wu et al., 2006). Financial risks refer to issues that could occur within a firm’s cash flow, such as volatile exchange rates and currency fluctuations (Liu & Nagurney, 2011). Information risks cover the aspect that supply chains are highly interconnected throughout information systems to increase collaboration. With this, threats through viruses, trojan horses, hacking, or simply the accidental destruction of data by employees are considered as risks (Smith et al., 2007).
Transportation risks refer to adverse effects on the flow of goods caused by terroristic activities or piracy with potential harm for the entire supply chain (Hishamuddin et al., 2013). Macro risks describe catastrophic events characterised as low probability-high consequence events and unexpectedly disrupt the supply chain flows (Knemeyer et al., 2009). Examples of such macro risks are political crises or natural disasters like hurricanes, droughts, or earthquakes. A pandemic disruption can be classified as a macro risk (Kumar & Havey, 2013).
A second step within SCRM is the risk assessment process, whereby the likelihood and the significance of the potential consequences and losses of an adverse event are evaluated (Brenchley et al., 2003). Herein, a company aims to determine the propagation of the negative effect caused by the risks and measure the impact on the operational supply chain performance (Wu et al., 2007). The risks can either be objectively evaluated based on indicators like financial data or subjectively through assessing the robustness of the relationship between the companies or combining both approaches (Zsidisin et al., 2004). Third and last, SCRM further tries to develop risk mitigation strategies to reduce the negative impacts deriving from the various risk sources (Ceryno et al., 2015). The main objective of SCRM is to establish and maintain a decent level of resilience within supply chains (Grötsch et al., 2013). The principle of SCRes is further elaborated in the next sub-chapter.
12
2.4 Supply chain resilience
A generally accepted definition of SCRes that reaches complete consensus among scholars is not defined yet (Tukamuhabwa et al., 2017; Emenike & Falcone, 2020). Hence, the reviewed articles cite various SCRes definitions from previous studies (Christopher & Peck, 2004; Sheffi & Rice, 2005; ISO22301, 2012; Sahebjamnia et al., 2018; Costa et al., 2018; Um & Han, 2020). Nevertheless, within the reviewed articles, Ponomarov and Holcomb (2009) established the most cited definition regarding the 16 citations within the reviewed literature (appendix 1). Ponomarov and Holcomb (2009) regard a resilient supply chain as “the adaptive capability of the supply chain to prepare for unexpected events, respond to disruptions, and recover from them by maintaining continuity of operations at the desired level of connectedness and control over structure and function“. Our study relies on this definition for two reasons. First, the definition is perceived as relevant in the reviewed literature. Second, it focuses on the term disruption and thereby corresponds to our focus on the COVID-19 disruption to assess the supply chain resilience of the automotive industry.
2.4.1 Concepts of supply chain resilience
In similarity to the SCRes definitions, there is no accepted concept for SCRes in the current literature that highlights the resilience measures, enabling an evaluation of the resilience level (Rajesh, 2020b; van Hoek, 2020). However, several articles rely on prominent frameworks. Two of the most cited frameworks in the reviewed literature are Sheffi and Rice (2005) and Christopher and Peck (2004) (appendix 2). Sheffi and Rice (2005), as the first ones, demonstrate a graphical approach based on the stages of disruption that allows the qualitative characterisation of the system performance and disruption trajectory. They distinguish between eight stages (figure 2).
13 Figure 2: Stages of disruption
Source: Adapted from Sheffi & Rice (2005)
Preparation as the first stage describes that companies can anticipate and thus prepare for disruptions to some extent. The disruptive event that causes the supply chain disruption is the second stage. The third stage is the first response which aims to control the situation and to prevent further damage. Stage four, as the initial impact, covers the damage that the first response could not prevent. The initial impact depends on the magnitude of disruption, available redundancy, and existing SCRes. Also, the supply chain performance starts to decline (Sheffi & Rice, 2005).
However, the disruption eventually reaches stage five, where the supply chain experiences the full impact of the disruption. Firms within the supply chain run out of inventory of critical parts, which leads to a steep decline in supply chain performance. The recovery preparations as stage six start after or in parallel with the first response. If the disruption has been anticipated, the recovery preparations start before the disruption. Typical preparation measures are, for example, the qualification of alternative suppliers, redirection of suppliers’ resources, and the development of alternative transportation routes and modes. The return to normal operating levels is achieved during the recovery as stage seven. Relevant measures are the utilisation of overtime or suppliers’ and customers’ resources. Last, the long-term impact is covered by stage eight. A disruption might cause long-term damages such as a negatively affected supplier or customer relationships which are complicated to recover from. Hence, an extensive period is
14
assumed to recover from disruption until a supply chain performance level is reached, comparable to the pre-disruption state (Sheffi & Rice, 2005).
The disruption profile framework of Sheffi and Rice (2005) builds the foundation for subsequent, highly cited articles (Tierney & Bruneau, 2007; Cimellaro et al., 2010; Pettit et al., 2013; Tukamuhabwa et al., 2015). Additionally, the literature review revealed that the framework is still relevant in the current literature (Sahebjamnia et al., 2018; Rajesh, 2019a; Emenike & Falcone, 2020; Fan et al., 2020; Polyviou et al., 2020; Rajesh, 2020b; Shekarian & Mellat Parast, 2020).
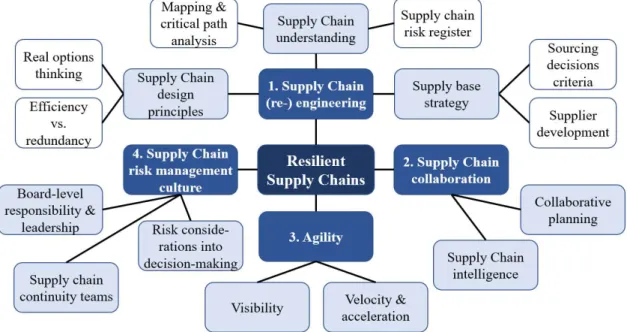
As the second one, Christopher and Peck (2004) provide a framework that illustrates how to create a resilient supply chain based on categorised measures (figure 3). The framework organises four categories of measures that increase the company’s SCRes.
Figure 3: Creating the resilient supply chain Source: Adapted from Christopher & Peck (2004)
The first category is the (re-)engineering of the supply chain. It describes the measures that are used to design and optimise the supply chain to achieve higher SCRes. Supply chain (re-)engineering involves, for instance, a change of the supply base strategy which requires a change of sourcing decision criteria and a focus on resilience in supplier development. The second category is supply chain collaboration. The category acknowledges that the vulnerability to disruptions is a network-wide issue. Hence,
inter-15
organisational measures like collaborative planning and information sharing are needed to develop a resilient supply chain (Christopher & Peck, 2004).
The third category, agility, is defined as responding rapidly to unpredictable supply and demand changes. Agility is achieved with visibility and velocity. Visibility is the ability to see the inventory, supply, and demand over the whole supply chain, whereas velocity captures the ability to shorten lead times. The fourth and last category is the creation of SCRM culture. The authors recognise that a management culture change is necessary to ensure that the SCRes measures are adequately implemented. The risk management culture can, for example, be achieved by assigning the responsibility for supply chain risk management on board level and the consideration of risk management in the decision-making process of the companies in the supply chain (Christopher & Peck, 2004). The framework of Christopher and Peck (2004) is the foundation for various subsequent frameworks that are highly cited (Jüttner & Maklan, 2011; Pettit et al., 2013; Scholten & Schilder, 2015; Tukamuhabwa et al., 2015). For instance, Ponomarov and Holcomb (2009) recognise the groundwork of Christopher and Peck (2004) and develop a more holistic concept that incorporates the logistic capabilities into the SCRes framework. Concerning the reviewed articles, further and more recent frameworks can be traced back to Christopher and Peck (2004), which underlines the framework’s relevance (Abeysekara et al., 2019; Rajesh, 2019a; Rajesh, 2020b).
Although, the literature review also revealed contradicting articles concerning the explicitness of flexibility. Other scholars characterise supply chain flexibility as a separate SCRes strategy (Polyviou et al., 2020; Shekarian & Mellat Parast, 2020; Dubey et al., 2021). They rely on previous research that also singled out flexibility as a resilience driver (Pettit et al., 2013; Hosseini et al., 2019). While Christopher and Peck (2004) state in their definition of SCRes that flexibility is implicit in all four categories.
In sum, we presented two frameworks that follow a different approach to structure the topic of SCRes. However, we pointed out that both frameworks are still relevant even though the related articles were published in 2004 and 2005. Nevertheless, recent trends in the SCRes literature are not covered by the two frameworks. Specifically, scholars established the topics of technological innovation and sustainability as the main trends within the field of SCRes.
16
Technological innovation encompasses the investigations that identify innovativeness and technology as capabilities to improve SCRes (Golgeci & Ponomarov, 2013; Rajesh, 2017; Ivanov et al., 2019; Parast, 2020; Salmi et al., 2020; Um & Han, 2020). Recent investigations revealed that the COVID-19 pandemic increases the need for technological innovation since the crisis uncovers the vulnerabilities in the supply chain due to the lack of information flow and end-to-end visibility. However, this vulnerability can be tackled by transforming traditional supply chains into digital supply networks (Ivanov & Dolgui, 2020; Queiroz et al., 2020; Rapaccini et al., 2020; Sarkis, 2020; Zhu et al., 2020). Besides, other scholars identify potential measures of technological innovation that improve SCRes, such as 3D printing (Salmi et al., 2020), blockchain technology (Queiroz et al., 2020; Nandi et al., 2020), and data analytics or machine learning (Cavalcante et al., 2019; Dubey et al., 2021).
Furthermore, the literature review revealed that sustainability is also perceived as an enabler of SCRes (Soni et al., 2014; Hosseini et al., 2016; López & Ruiz-Benítez, 2020). Rajesh (2018b) introduces the concept of sustainable-resilient supply networks as networks that combine the benefits of sustainability and resilience. Sarkis (2020) points out that sustainability strategies and practices such as maintained ecosystem services, sustainable localisation, and earning the community’s trust reduce risks and contribute to SCRes. Further, the author concludes that sustainability and resilience are complements that contribute to a post-COVID-19 improvement of the supply chain (Sarkis, 2020). Likewise, Queiroz et al. (2020) recognise that the emerging COVID-19 research agenda involves sustainability and resilience, and they combine the themes under the concept of supply chain viability. Also, other reviewed articles provide specific measures such as green supplier integration or circular economy capabilities that enhance SCRes and sustainability (Bag et al., 2019; Ji et al., 2020; Nandi et al., 2020).
2.4.2 Measures of supply chain resilience
Several reviewed articles provide an overview of the potential measures that increase SCRes (Pettit et al., 2013; Rajesh, 2020a; Um & Han, 2020; Zhu et al., 2020). Lotfi & Saghiri (2018) distinguish in their overview between measures that relate to resilience, leanness, and agility. Also, Ruiz-Benítez et al. (2018) identify 12 resilient supply chain practices and investigate their impact on financial and operational performance. Further,
17
the literature distinguishes between proactive and reactive SCRes measures (e.g. Tukamuhabwa et al., 2017; Belhadi et al., 2021). Proactive measures are established to prevent the negative impact of supply chain disruptions. In contrast, reactive measures are implemented to recover the supply chain performance to a sufficient level in a sufficient time after the disruption (Dubey et al., 2021). Belhadi et al. (2021) exemplify that a proactive measure is to set up digital connectivity through digital innovations such as blockchain technology or integrated SCRM with a perspective of the whole supply chain. Examples of reactive measures are the creation of redundancy or increased velocity and visibility to respond accurately to a supply chain disruption (Tukamuhabwa et al., 2017).
However, various reviewed articles do not provide an overview of measures. Instead, they select a single or a small number of measures to validate the positive impact of these measures on SCRes. For instance, Polyviou et al. (2020) analyse social capital and a risk-focused culture to build SCRes. At the same time, the overview provided by Rajesh (2017) focuses on the technological measures that increase SCRes. In contrast, Ji et al. (2020) investigate green supplier integration as a measure that increases SCRes and supply chain sustainability.
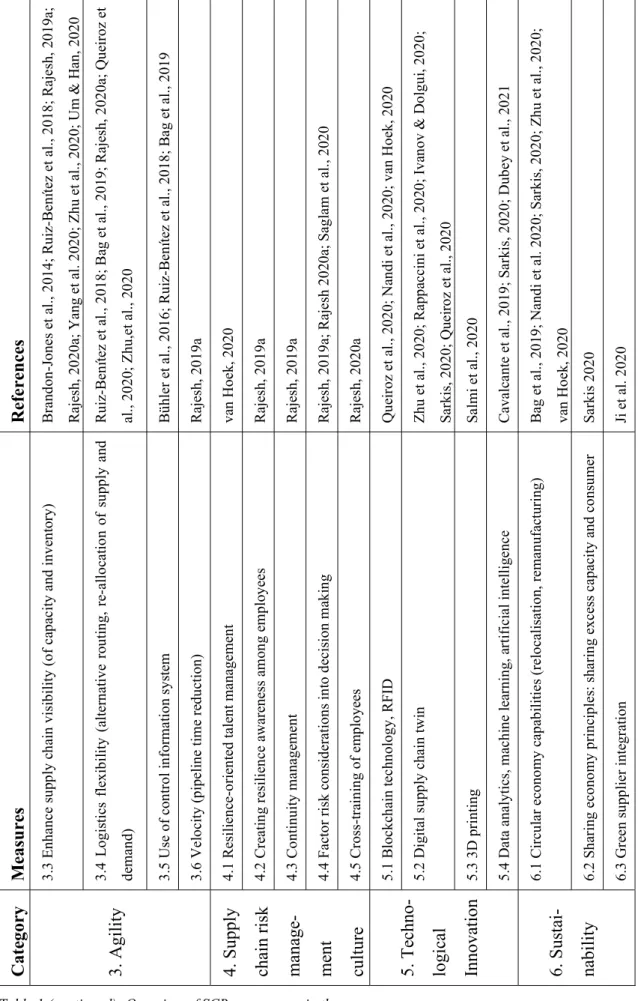
To provide a structure for this high quantity of measures, we relied on the four categories of the presented framework of Christopher and Peck (2004). The four categories are supply chain (re-) engineering, supply chain collaboration, agility, and creating a SCRM culture. Also, we added technological innovation and sustainability as the fifth and sixth categories to cover the measures that relate to these recent trends. In conclusion, table 1 provides an overview of the relevant SCRes measures based on the reviewed articles.
18 R ef er en ce s C os ta e t a l., 2 01 8; C av al ca nt e et a l., 2 01 9; M ar i e t a l., 2 01 9; S hi n & P ar k, 2 02 0; S ur ee ya ta na pa s et a l., 2 02 0; R aj es h, 2 02 0a ; v an H oe k, 2 02 0 T ho m as e t al ., 20 15 ; H os se in i et a l., 2 01 6; R ui z-B en íte z et a l., 2 01 8; U m & H an , 20 20 ; E sm iz ad eh & M el la t P ar as t, 20 20 ; R aj es h, 2 02 0a L üc ke r & S ei fe rt , 20 17 ; R ui z-B en íte z et a l., 2 01 8; R aj es h, 2 01 9a ; P ol yv io u et a l., 2 02 0; Sh ek ar ia n & M el la t P ar as t, 20 20 ; R aj es h, 2 02 0a Fu & C hi en , 2 01 9; S in gh e t al ., 20 19 ; R aj es h, 2 01 9a ; Q ue ir oz e t al ., 20 20 ; S in gh e t al ., 20 20 ; E m en ik e & F al co ne , 2 02 0; Z hu & K ri kk e, 2 02 0; S ha he d et a l., 2 02 1 Sa gh af ia n & V an O ye n, 2 01 2; L üc ke r & S ei fe rt , 2 01 7; Z hu e t al ., 20 20 ; Q ue ir oz e t al ., 20 20 ; va n H oe k, 2 02 0 R aj es h, 2 01 8a ; R aj es h, 2 01 9a ; Z hu e t a l., 2 02 0; R aj es h, 2 02 0b R ui z-B en ít ez e t a l., 2 01 8; S ah eb ja m ni a et a l., 2 01 8; Q ue ir oz e t a l., 2 02 0 Sa gh af ia n & V an O ye n, 2 01 2; B ra nd on ‐J on es e t a l., 2 01 4; D ub ey e t a l., 2 01 7; R ui z-B en íte z et al ., 20 18 ; R aj es h, 2 01 9a ; S he ka ri an & M el la t P ar as t, 20 20 ; U m & H an , 2 02 0 R ui z-B en ít ez e t a l., 2 01 8; P ol yv io u et a l., 2 02 0; R aj es h, 2 01 9a R aj es h, 2 02 0a ; R aj es h, 2 02 0b T ho m as e t a l., 2 01 5; R aj es h, 2 02 0a T ho m as e t a l., 2 01 5; B ag e t a l., 2 01 9; R aj es h, 2 02 0a ; Z hu e t a l., 2 02 0 M ea su re s 1. 1 R es il ie nc e-or ie nt ed S up pl ie r se le ct io n 1. 2 R es il ie nc e-or ie nt ed su pp ly ch ai n de si gn (a da pt iv ity ) 1. 3 R ed un da nc y (r es er ve in ve nt or y) 1. 4 Si m ul at io n, f or ec as tin g, o r de ci si on s up po rt m od el ( D S M ) 1. 5 D iv er si fi ca tio n/ D ua l S ou rc in g 1. 6 Su pp ly c ha in m ap pi ng / vu ln er ab il ity r ev ie w 1. 7 D is as te r re co ve ry p la n 2. 1 In fo rm at io n sh ar in g (w ith in s up pl y ch ai n) 2. 2 C ol la bo ra ti ve p la nn in g 2. 3 R is k he dg in g 3. 1 A gi le o pe ra tio ns ( pr od uc t d ev el op m en t t im e) 3. 2 M an uf ac tu ri ng f le xi bi lit y (p ar al le l op er at io ns ; dy na m ic a ss or tm en t p la nn in g) C at eg or y 1. S up pl y ch ai n (r e-) en gi ne e-ri ng 2. S up pl y ch ai n co l-la bo ra ti on 3. A gi li ty
19 R ef er en ce s B ra nd on ‐J on es e t a l., 2 01 4; R ui z-B en ít ez e t a l., 2 01 8; R aj es h, 2 01 9a ; R aj es h, 2 02 0a ; Y an g et a l. 20 20 ; Z hu e t a l., 2 02 0; U m & H an , 2 02 0 R ui z-B en ít ez e t a l., 2 01 8; B ag e t a l., 2 01 9; R aj es h, 2 02 0a ; Q ue ir oz e t al ., 20 20 ; Z hu ,e t a l., 2 02 0 B üh le r et a l., 2 01 6; R ui z-B en ít ez e t a l., 2 01 8; B ag e t a l., 2 01 9 R aj es h, 2 01 9a va n H oe k, 2 02 0 R aj es h, 2 01 9a R aj es h, 2 01 9a R aj es h, 2 01 9a ; R aj es h 20 20 a; S ag la m e t a l., 2 02 0 R aj es h, 2 02 0a Q ue ir oz e t a l., 2 02 0; N an di e t a l., 2 02 0; v an H oe k, 2 02 0 Z hu e t a l., 2 02 0; R ap pa cc in i e t a l., 2 02 0; I va no v & D ol gu i, 20 20 ; Sa rk is , 2 02 0; Q ue ir oz e t a l., 2 02 0 Sa lm i e t a l., 2 02 0 C av al ca nt e et a l., 2 01 9; S ar ki s, 2 02 0; D ub ey e t a l., 2 02 1 B ag e t a l., 2 01 9; N an di e t a l. 20 20 ; S ar ki s, 2 02 0; Z hu e t a l., 2 02 0; va n H oe k, 2 02 0 Sa rk is 2 02 0 Ji e t a l. 20 20 M ea su re s 3. 3 E nh an ce s up pl y ch ai n vi si bi lit y (o f ca pa ci ty a nd in ve nt or y) 3. 4 L og is ti cs f le xi bi lit y (a lte rn at iv e ro ut in g, r e-al lo ca tio n of s up pl y an d de m an d) 3. 5 U se o f co nt ro l i nf or m at io n sy st em 3. 6 V el oc ity ( pi pe lin e tim e re du ct io n) 4. 1 R es il ie nc e-or ie nt ed ta le nt m an ag em en t 4. 2 C re at in g re si li en ce a w ar en es s am on g em pl oy ee s 4. 3 C on ti nu ity m an ag em en t 4. 4 Fa ct or r is k co ns id er at io ns in to d ec is io n m ak in g 4. 5 C ro ss -t ra in in g of e m pl oy ee s 5. 1 B lo ck ch ai n te ch no lo gy , R F ID 5. 2 D ig it al s up pl y ch ai n tw in 5. 3 3D p ri nt in g 5. 4 D at a an al yt ic s, m ac hi ne le ar ni ng , a rt if ic ia l i nt el li ge nc e 6. 1 C ir cu la r ec on om y ca pa bi lit ie s (r el oc al is at io n, r em an uf ac tu ri ng ) 6. 2 Sh ar in g ec on om y pr in ci pl es : s ha ri ng e xc es s ca pa ci ty a nd c on su m er 6. 3 G re en s up pl ie r in te gr at io n C at eg or y 3. A gi li ty 4. S up pl y ch ai n ri sk m an ag e-m en t cu lt ur e 5. T ec hn o-lo gi ca l In no va ti on 6. S us ta i-na bi li ty
20
2.4.3 Assessment of supply chain resilience
Regarding the assessment of SCRes, several articles evaluated the degree of the implementation of the resilience measures. Herein, Ivanov et al. (2019) refer to the proactive and reactive measures that have to be assessed. For proactive measures, the level of inventories or capacity buffers must be evaluated. At the same time, the appropriateness and the number of contingency plans is an indicator for the degree of reactive SCRes measures (Ivanov et al., 2019). Likewise, Hosseini et al. (2016) assess SCRes by using absorptive and adaptive capacities. Absorptive capacities are, for example, the level of physical protection against disruptions caused by natural disasters, the reliability of suppliers by estimating the delay or failure rate, and the amount of backup supplier to secure continuity of production. In contrast, the main adaptive capacities are the level of flexibility within manufacturing and transportation operations (Hosseini et al., 2016).
The reviewed literature also highlights the SCRes assessment based on key performance indicators (KPIs). At first, the SCRes can be measured by the impact on financial KPIs like revenues caused by the disruption (Ivanov & Dolgui, 2020). A further KPI to assess the SCRes is the recovery speed, which describes the time it takes to bring the supply chain back to its previous functionality after a disruption (Emenike & Falcone, 2020; Belhadi et al., 2021). In addition to that aspect, another critical KPI is the determination of continuity levels of operations (Gligor et al., 2019). Further mentioned KPIs that could be deployed to assess the level of SCRes are the customer and operational performance indicators (Ivanov & Dolgui, 2020).
Above that, several articles rely on mathematical indices and models to assess the SCRes level (Pettit et al., 2013; Sahebjamnia et al., 2018). One example is the GResilient index, emerging from a multi-criteria model, which enables the evaluation of greenness and SCRes of automotive manufacturers (Ramezankhani et al., 2018; Mari et al., 2019). Last, the SCRes of suppliers during the supplier selection process is also assessed (Sureeyatanapas et al., 2020). Examples of resilience criteria for the supplier selection process in the reviewed literature are density, complexity, node criticality, responsiveness, and re-engineering capabilities of the supplier (Mari et al., 2019).
21
2.4.4 Outcomes of supply chain resilience
In sum, within the reviewed literature, the outcomes of increased SCRes are mainly related either to the supply chain performance or the general operational performance of the investigated companies (e.g. Kauppia et al., 2016). Also, companies that react quicker and more efficiently to disruptive events than competitors could access a competitive advantage due to SCRes (Singh et al., 2019). Besides, resilience practices positively impact the sustainability performance of a supply chain since SCRes is considered an approach to develop lasting capabilities (Ji et al., 2020; López & Ruiz-Benítez, 2020). Regarding the interdependence of agile supply chains and SCRes, Rajesh (2018) mentions that the simultaneous implementation of resilient and agile measures would increase the supply chain performance. Also, Thomas et al. (2015) declare agility as a critical theme to establish manufacturing resilience. Further, Lotfi and Saghiri (2018) mention that agility is a formative element of SCRes, especially within reactive measures. Concerning the interdependence between lean supply chains and SCRes, Ahmed & Huma (2021) state that strategically lean-oriented companies do not support organisational resilience capabilities. Furthermore, based on previous research, Lotfi and Saghiri (2018) conclude that lean supply chains are more fragile, and their disruption risks increase dramatically. However, the authors also acknowledge that leanness could help to improve the time to recovery performance (Lotfi & Saghiri, 2018). Likewise, Ruiz-Benitez et al. (2018) declare an increased supply chain vulnerability due to leanness because firms reduce their availability to buffer. Nevertheless, lean supply chain practices may boost SCRes practices since the enforcement of lean practices for cost-efficiency reasons also requires implementing SCRes practices due to the increased supply chain vulnerability (Ruiz-Benítez et al., 2018).
2.5 Conclusion of theoretical study
Based on our systematic SCRes literature review, we identified two research gaps. First, the COVID-19 supply chain disruption is not well researched regarding that only 16 out of the 85 reviewed articles relate to the COVID-19 crisis. Due to the inherent delay based on the peer review and publication process of journals, the published articles that study the COVID-19 disruption were conducted at the beginning of the pandemic. Therefore, the available literature mainly forecasts and simulates the impact of the disruption on
22
supply chains under the aspect of SCRes (Ivanov, 2020; Singh et al., 2020; Belhadi et al., 2021; Shahed et al., 2021). Although, one year after the initial COVID-19 outbreak, it is valuable to investigate the actual trajectory of the disruption up to this point. Therefore, Sheffi and Rice (2005) provide a suitable first theory-based research framework to analyse the different disruption phases, the respective supply chain performance, and the role of SCRes in these phases (figure 2).
Second, another gap that the literature review disclosed is the gap between theory and practice (van Hoek, 2020). This gap manifested itself primarily in the examination of SCRes measures. The central aspect of the sampled articles is the recommendation of measures based on a theoretical conceptualisation. For instance, measures like blockchain, circular economy practices (Nandi et al., 2020; Sarkis, 2020), and flexible backup suppliers (Saghafian & Van Oyen, 2012) are explored. Even though studies exist where the authors consult the industry to identify which SCRes measures are used, the linkage to the industry is superficial (Thun & Hoenig, 2011; Dubey et al., 2017; Rajesh, 2017; Rajesh, 2020a; Azadegan & Dooley, 2021).
Hence, we synthesised the SCRes measures from the reviewed literature (table 1) to tackle the lack of qualitative research on the role of SCRes measures in practice as the second research gap. This list of SCRes measures is based on six categories. The first four categories of the supply chain (re-) engineering, collaboration, agility and SCRM culture relate to the presented framework (figure 3) of Christopher and Peck (2004). Several scholars promote the last two categories, technological innovation, and sustainability as research opportunities that should be considered in further investigations related to the COVID-19 disruption (Queiroz et al., 2020; van Hoek, 2020; Sarkis, 2020). Therefore, we use the synthesis of SCRes measures (table 1) as the second theory-based research framework.
23
3. Methodology
_____________________________________________________________________________________
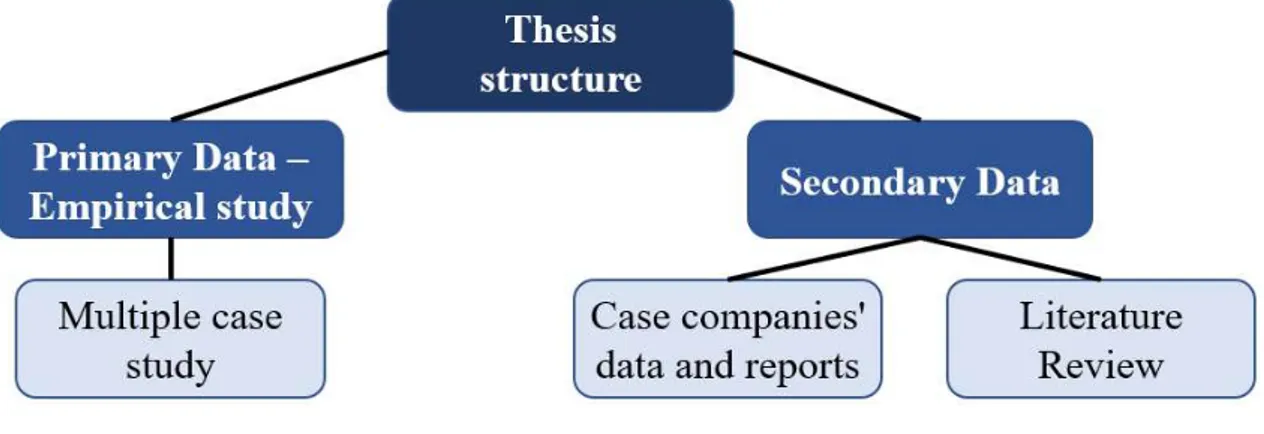
In this chapter, the multiple case study and the usage of secondary data are explained. The constructionist research philosophy and our purposive sampling strategy are outlined. Afterwards, we illustrate the interview procedure and the subsequent directed content analysis. At last, we describe how research quality and ethics are ensured. ______________________________________________________________________ The research is structured into primary data with an empirical study and secondary data reflecting company data and a theoretical study (figure 4). The empirical study is displayed in chapter 4, whereas the theoretical study is covered in chapter 2. The following sub-chapters explain the study procedure after we introduce our research philosophy.
Figure 4: Thesis structure Source: Own construction
3.1 Research philosophy
Awareness about the philosophical assumptions increases the quality of the research (Easterby-Smith et al., 2018). Thereby, we outlined our ontological and epistemological assumptions to illustrate our research philosophy. Concerning this study, we selected relativism as our ontological position. Based on this position, many truths are assumed, which depend on the viewpoint of the observer. Therefore, scientific laws are influenced by the perspective since people are embedded in a context (Putnam, 1987; Easterby-Smith et al., 2018). Furthermore, we followed a constructionist-oriented epistemological approach under our relativist position. The idea of constructionism embodies that objective or external factors do not determine reality, but it is instead a social construction of people (Robson & McCartan, 2016). Hence, we considered that the responses we receive from the interviewed supply chain experts are socially constructed and require
24
embodied context. The strengths of the constructionism approach are that the value of multiple data sources is acknowledged and enables generalisations beyond the investigated sample. However, the weaknesses are that access to this sample can be difficult and the potential issues regarding discrepant information (Easterby-Smith et al., 2018).
The constructionist position can be further specified as engaged constructionism. An engaged research approach requires close collaboration between academics and practitioners regarding research aims, implementation, and practical implications (Easterby-Smith et al., 2018). Within the field of engaged constructionism, our philosophical position can be described as pragmatism. Pragmatism claims that direct experience is the source of understanding and knowledge (Fendt et al., 2008). This position is pertinent for our research since we also criticised the lack between theory and practice of SCRes measures which we want to tackle. Furthermore, the position emphasises that concrete and abstract have to be balanced as well as reflection and observation (Easterby-Smith et al., 2018). In this manner, we illustrate how we achieve this balance in our empirical study in the following chapter.
3.2 Primary data – multiple case study
Constructionist research requires a methodology that uses questions to advance the research, which considers many different perspectives and aims for convergence. The holistic multiple case study approach is coherent with these requirements and the formerly described research philosophy. Further, the multiple case study methods and techniques emphasise the analysis of words, and the methodology relies on triangulation, comparison, and theory generation (Yin, 2017; Easterby-Smith et al., 2018). Above that, a multiple case study enables a descriptive research approach that portrays a situation or phenomenon (Runeson & Höst, 2009; Robson & McCartan, 2016).
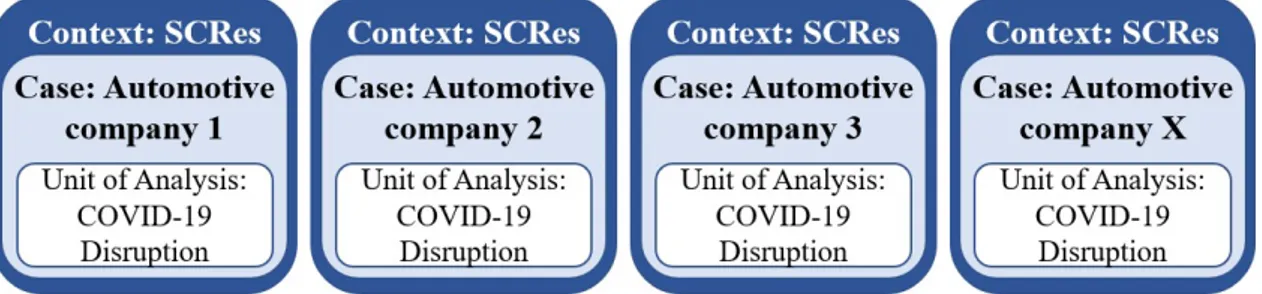
Consequently, we investigated the COVID-19 disruption and assessed the SCRes of the automotive industry based on multiple cases (figure 5). The multiple case study allowed us to include a relatively large sample to achieve an overall picture of the impact of the COVID-19 disruption on the automotive industry. Hence, we focused on the cross-case analysation to compare the trajectory of the supply chain performance and the usage and value of SCRes measures concerning different stages of the disruption and different levels
25
and entities of the supply chain. To assemble a representative sample of the main supply chain tiers, we focused on the OEMs and the first and second supply chain tiers in the automotive supply chain as the case companies (Thomé et al., 2014).
First, we analysed the OEMs, which are naturally a vital supply chain entity in the automotive supply chain since they produce the end-product. Second, we examined the situation at the tier 1 suppliers in the automotive supply chains. The impact and reaction on the COVID-19 disruption and the used SCRes measures might have been different at this entity, which we want to investigate. Third, we also investigated tier 2 suppliers since we believe that these suppliers can also reveal relevant insights concerning the COVID-19 disruption, its trajectory, and the impact of different SCRes measures (Chapter 2.2.1).
Figure 5: Application of holistic multiple case study design Source: Adapted from Yin, Bateman, & Moore (1983); Yin (2017)
The research design was developed prior to the investigation. Our theoretical study of SCRes provided the theory-based research frameworks for our cases. We synthesised the relevant concepts of our study and the SCRes measures (chapter 2.4). Therefore, we described and analysed the COVID-19 disruption as the single unit of analysis to derive insights about SCRes that can be applied to other disruptions (Stake, 2006; Easterby-Smith et al., 2018). In conclusion, we move from theory to empirical observations, which can be specified as a deductive research procedure (Robson & McCartan, 2016).
3.2.1 Sampling strategy and process
The accumulation of qualitative data requires an appropriate sampling strategy. We referred to purposeful sampling since it is suitable for qualitative studies (Emmel, 2013; Maylor et al., 2016). Also, it allows a selection of instances for cases based on predefined criteria (Emmel, 2013; Easterby-Smith et al., 2018).
26
We defined four sampling criteria that possible organisations and their expert individuals should meet to be considered for our research. First, we specified the automotive industry by focusing on the Scandinavian and German automotive industries. In both regions, the automotive industry is organised within an association. The Scandinavian Fordonskomponentgruppen (FKG) represents more than 350 member companies from Scandinavian suppliers to the automotive industry (FKG, 2021). In comparison, the German Verband der Automobilindustrie (VDA) constitutes over 600 companies that manufacture cars, trailers, bodies, buses, parts, and accessories. Within the VDA, we prioritised manufacturer group 1, car manufacturers, and manufacturer group 3, which are over 500 parts and accessories manufacturers. Manufacturer group 2 was excluded because it involves special bodies, trailers, and buses that do not correspond to our automotive focus (VDA, 2021a).
Second, the targeted companies were the OEMs and the first or second supply chain tier in the automotive supply chain. Hence, we revised the companies' website within these two associations to exclude the companies that are not producing parts that relate to automotive supply chains. Consequently, we avoided companies that concentrate on automotive engineering, information technology, mobility services, and additional car equipment. We contacted the enterprises via E-Mail or their contact forms on their websites (appendix 3). Thereby, we introduced ourselves, the purpose of our interview request, and our interview guide (appendix 4).
Third, we required that the role of the interviewees was related to automotive supply chain management. Since not every company has a SCM department, we also accepted managing directors, purchasing, sales staff, or industry analysts if they were confident to answer our questions based on our written request and interview guide. Fourth, the interviewee had to compare the situation of the automotive supply chains before and after the COVID-19 disruption. Hence, we assured that the interviewees were in the same position over the last two years and demonstrated adequate years of experience. As a result, we obtained 18 interviews with participants that met our sampling criteria. Above that, our study is supported and expanded by interviews with a pure third supply chain tier supplier and two industry analysts who work for the automotive associations and related institutions to include their macro-perspective on the industry. In table 2, we have displayed the anonymised information of the 21 participants and companies in total.
27 E xp er ie nc e 6 ye ar s 3 ye ar s 19 y ea rs 35 y ea rs 31 y ea rs 23 y ea rs 2 ye ar s 15 y ea rs 20 y ea rs 25 y ea rs 26 y ea rs 34 y ea rs 12 y ea rs 11 y ea rs 21 y ea rs 10 y ea rs 16 y ea rs 30 y ea rs 35 y ea rs 22 y ea rs 20 y ea rs In te rv ie w ee ’ s ro le SC m an ag er ( JI T ) SC m an ag er ( ra m p-up ) L og is ti cs n et w or k pl an ne r V al ue s tr ea m le ad er W ar eh ou se m an ag er H ea d of S C M SC m an ag er H ea d of S C M Pl an t l og is tic s m an ag er C E O H ea d of S C M G en er al m an ag er lo gi st ic s L og is ti cs m an ag er Pl an t m an ag er D ir ec to r bu si ne ss d ev el op m en t H ea d of lo gi st ic s Sa le s m an ag er A ut om ot iv e M an ag in g di re ct or SC m an ag er In du st ry a na ly st In du st ry a na ly st Su pp ly C ha in T ie r O E M O E M O E M T ie r 1, 2 , 3 T ie r 1, 2 , 3 T ie r 1, 2 , 3 T ie r 1, 2 T ie r 1, 2 T ie r 1, 2 T ie r 1, 2 T ie r 1, 2 T ie r 1, 2 T ie r 1, 2 T ie r 1 T ie r 1 T ie r 2 T ie r 2 T ie r 2 T ie r 3 - - C om p an y’ s au to m ot iv e p ro d uc ts C ar m an uf ac tu ri ng C ar m an uf ac tu ri ng C on tr ac tu al c ar m an uf ac tu ri ng C he m ic al s, ta pe s, o th er m at er ia ls C he m ic al s (A dh es iv es , c oa tin gs , e tc .) C ha ss is , s te er in g kn uc kl es , c ra nk sh af ts V eh ic le d oo rs , s ea ts a nd b od y R ad ar s, c am er as In je ct io n m ou ld in g, v en ti la tio n sy st em Pr es si ng s he et m et al a nd w el di ng In te ri or ( Pl as tic c om po ne nt s, C ab le h ar ne ss a nd c om po ne nt s (J IT ) W ax es ( co rr os io n pr ot ec ti on ) Se at s (s ec on d se at in g ro w ) Su sp en si on C on ne ct in g pa rt s, d ir ec t s cr ew St ee l t ub es f or e ng in es a nd c ha ss is C oa tin gs C he m ic al s (C oa ti ng ) Fi na nc ia l S er vi ce s fo r A ut om ot iv e A ut om ot iv e as so ci at io n N um be r I 1 I 2 I 3 I 4 I 5 I 6 I 7 I 8 I 9 I 10 11I I 12 I 13 I 14 I 15 16I I 17 I 18 I 19 I 20 I 21
Table 2: Overview of companies in the case study sample
As the table shows, we aimed for a broad spectrum of experts from different supply chain tiers and diverse professional backgrounds and experiences. Thereby, we attempted different perceptions of the topic and assured a qualitative outcome regarding the collected data.