1
-
:;:;(J
f
.
I
e? {'
.
,,--.::i-e-/:fi
~;--6
copy
2
October 1961
a...
ANALYSIS OF PRECIPITATION DATA
IN THE
UPPER COLORADO RIVER BASIN
by
Richard A. Schleusener
Engineering Research Colorado State Universityand
Loren W
.
Crow
Coi:,sulting Meteorologist
900 E Louisiana
Denver, Colorado
#"V.
,
r ,.. ....~-,, ..
, .,r,
fCIVIL ENGINEERING SECTION
COLORADO STATE UNIVERSITY
FORT COLLINS
,
COLORADO
..
,
-~
PAST AND PROBABLE
FUTURE V ARIA
TIO NS
IN
STREAM FLOW
IN THE UPPER COLORADO
RIVER
I.
Summary
and Conclusions
Morris
E.
Garnsey,
Project
Director
II.
A Study of
the Statistical Predictability of Stream
Runoff in
the
Upper
Colorado River Basin
Paul
R. Julian,
Research
Staff,
High Altitude Observatory,
University
of Colorado
Ill.
Some
General Aspects of Fluctuations of Annual
Runoff
in the Upper Colorado River Basin
Vujica M. Yevdjevich,
Engineering Research,
Colorado
State University
IV.
Probability
Analysis Applied to the Development of a
Synth'i!tic
Hydrology for the Colorado River
Margaret
R. Brittan,
Assistant Professor of Statistics,
University of Denver
V
.
Analysis of Precipitation Data in the Upper Colorado
River
Basin
Richard A. Schleusener,
Engineering Research,
Colorado State University
and
Loren W. Crow,
Consulting Meteorologist
Denver, Colorado
SPONSORS
This project was sponsored by the State of Colorado,
supported by it and by the States
·
of New Mexico,
Utah
and Wyoming, acting through the Upper Colorado River
Commission
October 1961
ANALYSIS OF PRECIPITATION DATA
IN THE
UPPER COLORADO RIVER BASIN
by
Richard A. Schleusener
Engineering Research Colorado State University
and Loren W. Crow Consulting Meteorologist
900 E Louisiana Denver, Colorado
Civil Engineering Section Colorado State University
Fort Collins, Colorado
CER61RAS52
ll
ll
l
l
lll
lll
ll
lllllllllllllllll
il
lllllllllll~
IIII
TABLE OF CONTENTS List of tables Page ii iii List of figures Abstract Acknowledgements V vi I. II. Introduction .
Weather stations analyzed
When and where precipitation occurs
Dept_h of precipitation required to produce the measured flow in the Upper Colorado River . . . . .
General evaporation and runoff relationships Frequency analyses . . . .
2 2 6
Annual precipitation . . . . . . . . 6 Difference between average and median precipitation totals in semi-arid climates 9 Percentage of storm periods giving various fractions of total annual rainfall 9 Dates within the water year for acquiring various amounts of precipitation . 11 Probability of receiving given amounts (5, 10, 15, and 20 inches) of
precipitation during the water year after 1 January, 1 March, and 1 May . . . . . . 13 Amounts of precipitation received from storms for the various months
of the water year, October - September 15
Distribution of precipitation during the water year . . . 1 7 Frequency distribution of precipitation amounts . . . 19 Example of correlation study by machine tabulation procedure 21 III. A review of major storms which have occurred in the Upper Colorado River Basin
Objectives 23 23 23 24 25 IV.
V.
VI. Procedure ResultsConclusions from study of major storms
Moisture sources for precipitation in the Upper Colorado River Basin Objectives
Procedure Results
Conclusions from study of moisture sources Conclusions and recommendations
Conclusions Recommendations Appendices
Procedures for machine processing of precipitation data Catalogue of data available at Colorado State University
i 26 26 26 26 27 29 29 29 31 31 34
Table I II III IV V LIST OF TABLES
Summary of card punching completed
Average monthly temperatures at 2, 000-foot intervals within the air mass which moves against or envelopes the primary collection basin of the Colorado River throughout the year--based on a three-year sample of data obtained by radiosondes released from Grand Junction, Colorado. . . . Amounts to be deducted (inches) from individual storms to adjust actual precipitation
to "precipitation contributing to runoff". . . . . . . Comparison of group mean of average monthly precipitation and group mean of
median monthly precipitation for three elevation groups. . . . . . Rough approximation of response in increased annual stream flow at Glen Cari.yon
related to major storms occurring in Western Colorado.
(Stream-flow Unit - 1000 acre-feet). . . .
ii Page 4 7 9 24
Figure 1. 2, 3. 4, 5. 6. 7. 8. 9, 10. 11. 12. 13. 14. 15. 16. 17. 18. 19. 20, 21, LIST OF FIGURES
Stations and inclusive dates for meteorological data used in this study Group means of median monthly precipitation amounts throughout the year
from October through September for three elevation groups , , , , , , Mean, standard deviation, and coefficient of variation of annual
precipitation (in inches) during a water year · · · · Mean, standard deviation, and coefficient of variation of the
number of storms received during a water year , , , , , , , , , , , , , , , , , , , , , Mean, standard deviation, and coefficient of variation of "Annual precipitation
(in inches) contributing to runoff" during a water year, determined by making certain reductions in observed precipitation for assumed evapotranspiration losses Mean, standard deviation, and coefficient of variation of the "Number of storms
contributing to runoff" during a water year, determined by making certain reductions in observed precipitation amounts for assumed evapotranspiration losses . . . . Average percentage, standard deviation and coefficient of variation of the number
of storm periods giving 25 per cent of rainfall for the water year . . . . Average percentage, standard deviation and coefficient of variation of the number
of storm periods giving 50 per cent of rainfall for the water year . . . . . Average percentage, standard deviation and coefficient of variation of the number
of storm periods giving 75 per cent of rainfall for the water year , , , , , .
Mean date, standard deviation in days, and coefficient of variation of acquiring 5 inches of precipitation during a water year. Number in parenthesis
indicates the percent of total years of record in which 5 inches or more
of precipitation was received , , , , , , , , , , , , , , . , , , , , , . , , , , , ,
Mean date, standard deviation in days, and coefficient of variation of acquiring
10 inches of precipitation during a water year. Number in parenthesis
indicates the per cent of total years of record in which 1 O inches or more of precipitation was received. Data are not shown when percentage is
less than 50 per cent · · · ·
Mean date, standard deviation in days, and coefficient of variation of acquiring
15 inches of precipitation during a wafer year. Number in parenthesis indicates the per cent of total years of record in which 15 inches or more of precipitation was received. Data are not shown when percentage is less than 50 per cent Mean date, standard deviation in days, and coefficient of variation of acquiring
20 inches of precipitation during a water year. Number in parenthesis indicates the per cent of total years of record in which 20 inches or more of precipitation was received, Data are not shown when percentage is iess than 50 per cent Mean date, standard deviation in days, and coefficient of variation of acquiring
25 inches of precipitation during a water year. Number in parenthesis indicates the per cent of total years of record in which 25 inches or more of precipitafion was received. Data are not shown when percentage is less than 50 per cent
Probability of receiving more than 5 inches of precipitation during the water year
after 1 January, 1 March, and 1 May , , , . . . .
Probability of receiving more than 10 inches of precipitation during the water year
after 1 January, 1 March, and 1 May · · · ·
Probability of receiving more than 15 inches of precipitation during the water year after 1 January, 1 March, and 1 May · · · ·
Probability of receiving more than 20 inches of precipitation during the water year after 1 January, 1 March, and 1 May , , , , , , , , · · · · Mean, standard deviation and coefficient of variation of the amount of precipitation (in inches) received from storms beginning in October . . . . , . , , , Mean, standard deviation and coefficient of variation of the amount of precipitation (in inches) received from storms beginning in November , . , . , , · · · Mean, standard deviation and coefficient of variation of the amount of precipitation
(in inches) received from storms beginning in December , , , , , , · · · iii Following Page 2 2 6 6 7 7 10 10 10 11 11 11 11 11 13 13 13 13 15 15 15
Figure 22. 23. 24. 25. 26. 27. 28. 29. 30. 31. 32. 33. 34. LIST OF FIGURES-Continued
Mean, standard deviation and coefficient of variation of the amount of precipitation (in inches) received from storms beginning in January . . . . Mean, standard deviation and coefficient of variation of the amount of precipitation
(in inches) received from storms beginning in February . · · · . . . .
Mean, standard deviation and coefficient of variation of the amount of precipitation
(in inches) received from storms beginning in March . . . .
Mean, standard deviation and coefficient of variation of the amount of precipitation
(in inches) received from storms beginning in April . . . .
Mean, standard deviation and coefficient of variation of the amount of precipitation
(in inches) received from storms beginning in May . . . . Mean, standard deviation and coefficient of variation of the amount of precipitation
(in inches) received from storms beginning in June . . . . Mean, standard deviation and coefficient of variation of the amount of precipitation
(in inches) received from storms beginning in July . . . . Mean, standard deviation and coefficient of variation of the amount of precipitation
(in inches) received from storms beginning in August . . . .
Mean, standard deviation and coefficient of variation of the amount of precipitation
(in inches) received from storms beginning in September . . . . Mean, median, mean plus one standard deviation, and extremes of amounts of
precipitation (in inches) received from storms beginning in various months
of the water year . . . . Frequency distribution of precipitation amounts received for the entire water year, and for storms beginning in January and July. . . . . .
Listing of the 15 largest major storms occurring in Western Colorado during the 46-year period, 1911-12 - 1956-57 · · · ·
Source regions for precipitation in the Upper Colorado River Basin . . . . .
iv Following Page 15 15 15 15 15 15 15 15 15 17 19 22 26
.l
ABSTRACT
A sample of daily precipitation and
temera-ture data from 30 weather observing locations in or
near the Upper Colorado River Basin have been placed on cards and partially analyzed by computer techniques. The sample represents a total of 1660
station years and analytical conclusions give a good representation of the climatic ranges for this area.
Frequency of precipitation at multiple time
V
intervals for each location are presented. Major storms having a recurrence less than once per year have been found to contribute significantly to runoff in the Upper Colorado River. Preliminary techniques for adjusting actual precipitation to more closely relate to runoff are presented and further refinements are anticipated. Variations in moisture sources have been studied.
ACKNOWLEDGEMENTS
The authors wish to thank the State of Colo-rado and the other States of the Upper Colorado River for the financial support which has made this study possible.
Special thanks are due Mr. Joseph Berry, Weather Bureau Climatologist for the State of Colo-rado, for his assistance in supplying and editing
vi
many of the original weather records which were used as a basis of this study.
A special note of thanks is due the many unpaid cooperative weather observers of the U. S. Weather Bureau, who collected the basic data used in this study and without whose cooperation this report would not have been possible.
I. INTRODUCTION Work at Colorado State University has been
concerned with analyses of existing climatological data in order to provide a refinement of basic data useful in hydrologic studies of the Upper Colorado River Basin.
Climatological data from many stations in the Upper Colorado River Basin have been collected for many years by unpaid cooperative observers of the U. S. Weather Bureau. Records of daily maxi-mum and minimaxi-mum temperatures, precipitation, snowfall, and other data are available for about 50 to 60 years prior to 1960. Since 1948 the Weather Bureau has placed all such data on IBM cards for machine tabulation and analysis. Prior to 194 8 however, climatological data were in tabular form only, not in a format suitable for machine com-putation and analysis.
The general procedure followed in this study has been to place weather records prior to 1948 on IBM cards in a format suitable for machine com-putation and analysis as a first step study. These data were reduced to storm totals and from the re -duced storm totals various frequency analyses were performed. Details of the procedures followed in processing the precipitation data are included in the appendix.
A. WEATHER STATIONS ANALYZED
Precipitation data from 30 stations in an near the Upper Colorado River Basin were analyzed in this study. Table I summarizes the stations and years included in this analysis. As shown in Table I about 608,000 cards were used in the analysis. Of these cards, about 4 70, 000 were prepared at Colo-rado State University as a part of this study.
The locations of the stations used in this study are shown in Figure 1. Figure 1 also shows the inclusive dates for which data were available for this study.
It should be noted that some parts of this re-port (such as parts of III and IV) are based on ana-lyses from stations from Colorado only, since they were performed by hand prior to the availability of machine-processed data from all stations.
B. WHEN AND WHERE PRECIPITATION OCCURS Fall rains, winter snows, and summer showers are the precipitating mechanisms which produce the water which runs back toward the ocean in the Colorado River from the collection basin of the Colorado River Watershed. This general con-cept of timing is an oversimplification when applied to individual stations, but the stream flow of the Colorado River at Lee Ferry is an integrated measure of the runoff yield of a large area. This watershed area is characterized by having rather extreme variations in elevation, distances from major moisture sources, and the localized effects of surrounding terrain and windward exposure of the locations where precipitation amounts have been measured.
The pattern of monthly precipitation amounts is shown in Figure 2 for three groupings of stations representing three general elevation levels. Rather uniform timing is indicated at all three levels. The months of November and June stand out as low average months, with June being the lowest month in the entire year. September is a relatively low month, which tends to divide the summer shower period from the fall rain period.
TABLE I
SUMMARY OF CARD PUNCHING COMPLETED Stations In Colorado Western Slope Fort Collins New Mexico Utah Wyoming Number Of Stations 18 5 5 Total Station-Years Total Number of Cards (Approximately)
STATION -YEARS Punched By CSU USWB 839 170 70 42 12 113 137 219 58 1,283 377 470,000 138,000
'
Total 1,009 70 54 250 277 1,660 608,0002
The late winter and spring period of heavier
precipitation throughout the year generally occurs from broad general storms covering thousands of square miles of cross-sectional area. The
rela-tively high summer precipitation peaks of July and
August are a result of local shower activity, each storm covering only a small area. The summer
showers occur during the period when evaporation
rates are very high.
Contrasts in the amounts of precipitation can
be noted easily in that the high level stations tend to have precipitation amounts between two and
three times greater than those at low level stations.
The contrast of low evaporation at high elevations
and high evaporation at low elevations accentuates
the importance of high elevation collection of
precipitation.
C. DEPTH OF PRECIPITATION
REQUIRED TO PRODUCE THE MEASURED FLOW
IN THE UPPER COLORADO RIVER The measurement of runoff in acre feet
allows a quick computation of the total quantity of
runoff in inches that takes place over a year's time to produce the total annual runoff at any given point where measurements are made along a river basin.
If 12 inches of water over one acre equals one acre
foot, then one inch of runoff over 12 acres would
also equal an acre foot of water. With 640 acres
per square mile, one inch of runoff would produce
53. 33 acre feet of water. (640 divided by 12 =
53. 33).
At high elevations where precipitation amounts
are high and evaporation rates are low, the yield
of runoff is high. For instance, the mean annual
flow of the Animas River at Durango represents
1 7. 7 inches from the 6 9 2 square miles above that
gaging station. By contrast, the mean annual flow
of the Paria River at Lee Ferry represents a
runoff from a 1550 square mile area of only O. 3
inch.
The mean annual flow measured at Lee Ferry,
Arizona (the terminal point of the Upper Basin)
re-presents a total annual runoff of ONLY 2. 3 inches
for the entire 109, 889 square mile watershed above that point.
The general range of runoff from low years
to high years would be between approximately one inch and three inches. This runoff comes from an area which receives precipitation quantities
rang-ing from only a few inches to over 30 inches.
From this analysis it can be seen that any
one single storm covering this broad area which is
capable of producing one inch of runoff over the
whole watershed above Lee Ferry, would
change the flow by approximately 6 million acre
feet. Thus it is important to analyze carefully the
precipitation records of the past to determine when and how runoff yields are produced from the pre-cipitation patterns that move through this area.
D. GENERAL EVAPORATION AND RUNOFF RELATIONSHIPS
The capacity of air to contain moisture is
directly related to temperature. The absolute quantity of moisture which can be carried in vapor form in saturated air at 32° F is less than one-fifth the amount that can be carried in saturated air at 80° F.
The process of precipitating moisture out of the atmosphere takes advantage of this fundamental
fact by carrying warm moist air upward and cooling
it. The fractional portion of absolute moisture which is in excess of the amount needed to produce
100 per cent saturation at the cooler temperatures
falls out. This phenomenon is well illustrated in
the lifting and cooling accomplished by strong vertical updrafts in a summer thunderstorm which can "expel" very heavy rain in a localized area for
a brief period of time. The precipitation process
constitutes an outflow of moisture from the
atmosphere.
When any particular air mass is not produc
-ing precipitation or being held at or near 100 per cent saturation, it can absorb additional water in
vapor form, and there is an inflow of moisture into
the atmosphere as it moves past any moisture
source.
In the upper basin of the Colorado River the
total hours of active precipitation and 100 per cent
saturation constitute a very, very small fraction of
the 8760 hours in an entire year. During all the
other hours when saturation is less than 100 per cent , the air mass can accept and carry away
moisture which can enter it by either direct
evaporation from moist-surfaces or transpiration
from plant life.
The altitude range between the lowest elevation in the watershed above Glen Canyon and
the mountain peaks at the rim of the Continental Divide is such that there is an extremely wide
range in evapotranspiration losses at different
points in the watershed and at different times of
the year. Table II presents the average monthly
temperature at 2000-foot intervals within the air
mass covering the upper watershed of the Colorado
River throughout the year.
Looking first at the 14, 000-foot elevation,
which is nearly the same as the highest peaks, we
'
\
E"o10,1e
l
Kendall ," 8tdlo,di
/1917-1959
1898
-
1959
~
J
'
® Borde(1902
-
1959
'
\
'
\
I
//
/
~
Evons!on' 1898
-
1959
Elkliorn1920
-
195
6
°
\. 8 Duchesne1906
-19
59
'
\ H1aw01ho)'
01921
-
1959
~
..,
• l rw
"
_1
901
-
1959
,
"
Blanding1905
-
1959
y
/I
N
UPPER COLORADO RIVER BASIN
G
ABOVE LEE'S FERRY, ARIZONA
Oixo11 0
25 0 25 50
HRH
CONTOUR INTERVAL: 3000 FT. COLORADO STATE UNIVERSITY, 1961
--- ---
192
~'1'
959'
---·
::"I
·
-
--
c
!!'!!!!!!!!'!!!'!!'!!!!! _ _ _ ,'. ~
i ,,_
I
I
Steombool For! Collins 0
Sp'\"•'\
1889-1948
.
)
, __ r.,
1893-1957-
_
..,
~~-
...
'.
e Meeker-
j1
893
-
1957
Glen#OOd Rifle SprinQ,S 0•
1909-1957
1893
-
1957
Collbron Grand Junction•
"
1893
-
1957
~ . --/ Fraser _t1893-1957
Poonio"'
des1ed, 1 Buttev
.
.
-r--·-"
Delta e1893
-19
57
1909
-
1957
1893-195
R A
D
•
0
•
Montrose1896
-
1957
Telluride1901
-
1957
e.
Silverton.
1906-1957
Cortez e Durongp1929-1957
•
1895-1957
-
·,··
N
M E
, G_unnison1893-1957
-"
PagosaHigh Level Above 8,000' ilverton vf)illon Crested Butte 1 Telluride ,/Fraser 1.. Steamboat Spgs.
*
STATION GROUPINGS BY ELEVATION
Middle Level 6,200' to 7,999' v6unnison Kendall iawatha vPagosa Spgs. VDulce VE vans ton \/Elkhorn \/Bedford l Dixon eeker v(Henwood Spgs. '' vDurango v Collbran
*
Arbitrarily included in next higher elevation group due to abnormally large precipitation amounts.2, SO" ,40 .30 • 20 .10 2.00 .90 ,80 ,70 • 60 l.SO .40 .30 ,20 ,10 1.00 .90 .80 .70 ,60
.so
.40 .30 . 20 .10High Level Stations
e Level Stations
Oct Nov Dec Jan Feb Mar Apr May June July Aug Sept
Low Level Below 6,200' l Paonia v'Border v cortez VBlanding !/Rifle v Montrose v'Escalante VDuchesne [/Grand Junction " Delta v ff C.,,/(i?J5
Fig. 2. Group means of median monthly precipitation amounts throughout the
year from October through September for three elevation groups.
4
TABLE II
Average monthly temperatures at 2, 000-foot intervals within the air
mass which moves against or envelopes the primary collection basin of the Colorado River throughout the year--based on a three-year sample of data obtained by radiosondes released from Grand Junction,
Colorado.
Highest
Mountain Peaks
14,000
I32
22
13
13
8 87
12
23
33
36 35
12,000'
lQ,000 I
Silverton-Dillon
Crested Butte=
Telluride
-
Fraser-8,000 I
Gunnison_
Kendall,-Hiawatha\._
J;;a§osa Springs
-y
nston\.Dulce'-E
khornSteamboat Spn.ngs
-Durango_
Bedford
~Q~~itill':;:-Cortez
~agDJa-
6,000
IBorder' Bl n
ing?-
Montrose-Glenwood
Sprin~sr-Escalan e r
Duchesne,._
Rifle-Del ta -
5,000 I
Grand Junction
Elevation
41
28
19
19
14 15
15
21
33
43
46
45
BEL(l,l
FREEZING
50
36
25
24
20
22
23
34 43
52
55
54
58 43
31
29
27
29
33
39
49
62
64
62
65
53
35
32 31
35
4047
59
69
72 70
Average Monthly Temperatures °
F
below freezing for nine months out of the year, and the other three months have temperatures only
slightly above freezing. The capacity of the
tran-sitory air to carry water away from these highest
elevations is extremely limited and can be con-sidered as negligible throughout the entire year.
It is easy to see from Table II how snowpack can
build up at the higher elevations during the cold winter months.
By contrast, at the 6000-foot level all
months have temperatures above freezing, with the
exception of December and January, and these two
months are near the freezing level. The warmer months at the lower elevations have temperatures
and dry air capable of accepting tremendous
quan-titites of moisture either through direct evaporation or transpiration from plant life.
The lower elevations of the watershed above Glen Canyon Reservoir are also characterized by being made up of generally flat sandy soil with
tremendous capacity for absorbing large quantities
of rainfall and preventing any direct runoff. The
many dry washes are perennial evidence to this fundamental fact. Only in the instances of ex-tremely heavy local thunderstorms do these dry washes carry any water, and many times this water disappears long before it reaches the main stem of
the Colorado River. Almost all of the water which does enter the soil returns in delayed evaporation
into the atmosphere before ever reaching the Colorado River.
5
Little is known about actual rates of
evapo-ration. However, some rough approximations can
be made about the fractional portion of the
ob-served precipitation which is lost to evapotrans-piration in this particular watershed.
The entire watershed loses over 80 per cent.
The area below 5000 feet loses over 90 per cent.
The area above 11, 000 feet loses less than 20 per cent.
During the winter there is a much greater
contrast between low elevations and high elevations.
This is first due to the marked contrast in
pre-cipitation amounts, the higher elevation stations
recording nearly three times as much as the low
elevation stations. Immediate evaporation at high
elevations is negligible, and the delayed
evapora-tion tends to be consolidated in the amount of moisture entering the soil either at the beginning or end of the snowpack season.
At the elevations above 10,000 feet, all the storms which occur from approximately early
November through mid-April tend to accumulate as if they were one large storm, and the runoff from this accumulation also can be treated as if it were one large storm.
6
II. FREQUENCY ANALYSES
One of the objectives of the study was to
determine_ the frequency distribution of
precipita-tion ·during various periods of time. The results
of these frequency analyses are given in Figures
3 - 32 which are presented in this section. The
inclusive dates for which meteorological data were
used are presented in Figure 1.
In Figures 3 - 15 and Figures 19 - 30, the
.frequency analyses are presented by giving the
mean, standard deviation, and coefficient of varia-tion. A£, pointed out later in this report (see especially section II B below) the precipitation data
are not normally distributed and usually are
posi-tively skewed. In spite of this fact, for convenience the standard deviation is presented with the mean
to give an estimate of the probability of occurrence of the event.
For normally distributed data the mean ±
one standard deviation should include about
two-thirds of the cases; the mean ± two standard
deviations should include about 95 per cent of all
the cases; and the mean ± three standard
devia-tions should include about 99 per cent of all the
cases. To illustrate, from Figure 3 we note that the mean annual precipitation at Gunnison is 10. 54
inches, with a standard deviation of 2. 21 inches.
Thus, approximately two-thirds of all years should
fall approximately within the limit of 10. 54 ± 2. 21
inches, etc.
It should be emphasized that these frequen
-cies are approximate only, since most of the data
are positively skewed and do not follow a normal distribution.
The coefficient of variation, defined as the standard deviation divided by the mean, gives a measure of the relative variability of the data.
A. ANNUAL PRECIPITATION
1. Observed Annual Precipitation
Figure 3 shows that marked differences in annual precipitation occur at stations which are relatively close together. For example, Silver-ton, Colorado ( elevation 9400 feet), has the highest
annual precipitation with 24. 60 inches per year, while Montrose (elevation 5830 feet), geographical-ly nearby, but on the opposite side of a ridge of high terrain, has a much lower value of 9. 75 inches per year. The coefficient of variation is higher for
stations in the southern part of the Upper Colorado River Basin. The values vary from 0. 3 for
stations in southern Colorado and Utah to a value
of about 0. 2 for stations in northern Colorado and
Wyoming.
2. Number of Storms Occurring
During a Water Year
One storm period consists of a number of
consecutive days with precipitation greater than a
trace in any 24 hour period.
Figure 4 shows that the variations in the
number of storms are similar to the variations in
mean annual precipitation. High-altitude stations
such as Silverton and Telluride receive more
storms during the year than nearby low-altitude
stations S'llch as Delta and Grand Junction. A greater number of storms per year occur at
sta-tions in the northern part of the basin such as
Kendall and Bedford than in southern stations such
as Durango and Pagosa Springs.
3. Annual Precipitation Contributing to Runoff
a. Adjusting Actual Precipitation Data To
"Precipitation Contributing To Runoff" Data
-Basically there is a very direct relationship
bet-ween precipitation and runoff. Large amounts of
precipitation are required to produce large amounts
of runoff. However, the range of errors sustained
in working with total known precipitation records
to derive co-related runoff indicates considerable
room for refinement. One very large source of
error comes from the assumption that one
particu-lar rain gage with a cross sectional catchment area
of less than one square foot can represent the true
measurement of precipitation for an area of
several thousand square miles.
A second cause for error is the wide varia-tion in precipitation timing. One storm which
produces four inches of rain on one day can deliver
far more runoff than 40 storms on 40 different days
each producing . 10 inch.
With the advent of computer facilities it is
believed possible to reduce the second cause of error by adjusting actual precipitation records to give resultant values which are more directly re -lated to runoff. Small storms which will contribute
little or no runoff can be eliminated from the
ad-justed precipitation record. A large part of the
rainfall from large storms returns to the atmos -phere by evapotranspiration, and only the balance moves to the streams as runoff.
The quantities to be deducted from individual
0
12
.54
3.76
0
.
3
/ Kel)dolt17
.
20
1-' B,dto,d ;I
4
20.24 ,;/
.06
3.91
0.24
-0
.
19
'
I
• 8/,!13
.
27
\
2
.
83
\ 0
.
21
'
\
J
I
/I
/
12.57
IZ\ fvonsfon3
.
16
)
0
.
25
\ Hmwotho 013
.
28
3
.
67
0.28
.
"""
? ),,
Elkhorn13.94
°4.14
0
.
3
t> Duchesne9
.
54
2
.
61
0
.27
/
<
(
/
\
0 Blanding13
.
58
4
.
3
0
.
32
/
M
..
/ .8
.
59
N
16
.
28
3
.
54
0.22
11.25
2
15
Grnod • Junction0
.
25
•
-\..8
.
05
2
.
29
0
.
28
Cortez13.33
.
3
.
62
0
.
27
UPPER
COLORADO RIVER
BASIN
ABOVE LEE'S FERRY, ARIZONA
G
El Meeker
25 0 25 50
HRH
CONTOUR INTERVAL: 3000 FT.
COLORADO STATE UNIVERSITY, 1961
10
.
54-X
2
.
21
-
(T
0
.
21
-
Cv
X
=
Arithmetic
mean
0-
=
Standard
deviation
C,r Variance
coefficient
\
'-(
\f~colan1e 027
.
6.0
8
0
.
22
/ K,ndolr,.,
""'"'
/ 53
.
52
.
, /
6.41
6
.
32
0
.12
0
.1
2
I
J
I l"
t
42
.
\
5
.
66
\
0
.
14
\
\
I
I
/
/
45
.<,oos1on5
_,
66
0
.
13
Elkhorn39
.
0 H10 .. a1ho'
4
1.
5
.10
0
.
12
lJ
""'
f'
J
".6.4
0.16
~ Duchesne36
.
8
.
00
0.22
I<
\ j'
•
(
A(
H
< • < Iw
0 Blond1nq35
.
6.56
0
.
19
y
(
UPPER COLORADO RIVER BASIN
ABOVE LEE'S FERRY, ARIZONA
N G
Dixon-
4
-
"
5.83
0
.
12
48
.
7
.
48
e " " ' "0
.
16
41.
9
.
06
"'"'
0 25~a~a~a
~ -
0~
25i
- ~ i
50 CONTOUR INTERVAL: 3000 FT.COLORADO STATE UNIVERSITY, 1961
~ ~
I
''
56
Sl!otnbOOI44.
5.57
0
.
13
For! Co11ms 0 • 5Drl(lg'i\7
.
88
$ i, ...--J\
0
.
14
59
.
' ;
-
_ _
..
Glenwood Springs.
5
.
66
.,,,
0
.
1
''""'
55
.
8
.
60
o,u,,.l 00
.
22
45.
0
.
16
42.
G1ond 0 Collbran8
.
83
'
~46
.
0.2
6.93
6
.
24
Junrnon0
.
15
e43
.
7.7
37
.
0
.
18
:"4°i
6.48
°•
110 •7
.
55
Ctested Bulle 00
.
18
Q.\1
8
D
Q
38
.
5
.
57
0
.
15
41.
7
.
62
0
.
19
Montrose50
.
Cortez e8
.
54
0.17
Telluride G Silverton51.
6
.
00
0
.
12
Ourongq 042
.
6.78
0
.
16
47
.
Pogoso6.78
Sp,ong,0
.
15
.
14
--·
-,,··-0ulceN
M E
0GUNNISON
46
. -
X
6
.
56
-
0-0
.
14
-
C
VX
=Arithmeti
c mean
CJ=
Standar
d
deviation
C
=Variance
coefficient
VFig. 4 Mean, standard deviation, and coefficient of variation of the number of storms received during a water year. See accompanying text for definition of a storm period.
should vary for different times of the year and also for different elevations. As a first approximation of the right order of magnitude, the II
dropout 11
values shown in Table III have been used as an initial step to illustrate such an adjustment tech-nique.
On an annual basis precipitation-year totals corresponding to the water-year runoff totals at Glen Canyon Reservoir should ordinarily include data from September through August. Only very heavy storms in early September contribute to the
current Septemberrunoff measured at Glen Canyon.
(See September, 1927).
Prior to the development of this adjustment
table, tests were made on samples of data cover
-ing rather small watersheds which have little or no diversion above gaging stations.
For instance, the actual September-August precipitation at Fraser for water year 1957 was 28. 08 inches. When these data are adjusted, the
net result is 23. 37 inches. The runoff for a small
32. 8 square mile watershed measured on St. Louis
Creek near Fraser was equal to 21. 5 8 inches. This was a wet year, and it is believed that some of the moisture was carried over into 195 8.
From September to August, 1958, the actual
precipitation total was 17. 23 inches. The adjusted
total was only 12. 16, and the runoff was 15. 00
inches. This indicates a benefit in runoff from
195 7 precipitation. The two years combined show
actual precipitation of 45. 31 inches. The adjusted
two-year precipitation was 35. 53 inches, and
run-off 36. 5 8 inches.
Similar relationship problems for small
watersheds near Dillon and near Silverton also
gave good results for typical near average
con-ditions and for wet and dry year extremes.
Water-sheds at low elevations studied included the Faria
River in Utah and Chevelon Creek on the Little
7
Colorado River
in
Arizona. At these fwo locationsthe median annual runoff is less than one-half inch, and practically all the annual precipitation must be deducted in the adjustment.
The "dropout" values as shown in Table III have been used only to illustrate the technique.
Further gradation for elevation is recommended. It is also expected that subsequent test and
crit-icisms by experienced hydrologists familiar with
precipitation and runoff relationships in the
Colo-rado River Basin will permit refinement.
Subsequent developments in evaporation
measurement techniques may give indications of
more correct "dropouts II
to be applied.
b. Value Of "Precipitation Contributing To Runoff" - The effect of making such reductions in observed precipitation amounts as estimates of the
losses by evaporation and transpiration are shown
in Figure 5. Figure 5 shows that high-altitude stations contribute significantly more runoff than do nearby low-altitude stations. For example,
Figure 5 shows more than 16 inches contributing to
runoff from Telluride while the nearby station of
Montrose yields about only one inch of precipitation
contributing to runoff.
c. Number Of Storms Contributing To
Run-off - Figure 6 shows the number of storm periods that are effective in contributing to runoff after the
observed precipitation data are reduced for
esti-mated evapotranspiration losses by the values
shown in Table III. The Number of storm periods contributing to runoff follows a pattern that is
sim-ilar to the precipitation contributing to runoff shown
in Figure 5. The stations at higher elevations,
such:as Telluride, have many more periods each
year in which storms contribute to runoff than near-by low elevation stations, such as Delta or Mont-rose.
The coefficient of variation for the low
-altitude stations is much higher than for the
high-elevation stations. TABLE III
High Level Stations
AMOUNTS TO BE DEDUCTED (INCHES) FROM INDIVIDUAL STORMS TO ADJUST
ACTUAL PRECIPITATION TO "PRECIPITATION CONTRIBUTING TO RUNOFF"
Sept Oct Nov Dec Jan Feb Mar Apr May Jun Jul
-.5 -. 5 no deduction -. 3 -. 3 -. 5 I cumulative Middle Level Stations -. 7 -. 7 -. 5 -. 2 -. 2 -. 2 -. 2 -.5 -. 5 -. 5 -. 7
I
cumulative Low Level Stations -. 8 -. 8 -. 6 -. 6 -.4 -.4 -.6 -.6 -. 6 -. 6 -. 8 Aug -. 5 -. 7 -. 8\
( '£sca/onre 03.49
t94
0
.
56
/ Ke do/) '' Bedfo,d?
/
1
,
g~
7
.
8o
'-;'/
0
·
2.77
·
~
~
0
.
36
'
.
I
'
::
, \,.UPPER COLORADO RIVER BASIN
ABOVE LEE'S FERRY, ARI ZONA
25 0 25 50 EBCJB8:JB::I====::::::t ===:JI / l ;, 0
1(
~
'
2.33
h
1.56
\ 0
.
67
CONTOUR INTERVAL: 3000 FT. COLORADO STATE UNIVERSITY, 1961f r
/
\
(
,.) )I
/I
N
G
/
3.40
. ( ''0""0"l
.
77
'
0
.
52
i
( ~ H1owothoe
4
.
62
·
2
.
34
0
.
51
. ' ' I l. f~·"
i
-
~
~
-
,----
...
---
....
<1.58
~ Elkhorn4.80
°
2.46'
0
.
51
:Z
If
0.46
,,
I
"
4.46
)
l
t2
.
6
( Steamboor/
17
.
6p
Sp"ogs\0.58
Fo,t Collms 0~
./ "<:...J,<
---
3
.
~l
~
,
~
"--r,
{. -
0
.
22
'
' ~
-eu'i""
_,)£~
\' -~
4J
.
g~
'\( ,
132.761
/
,.,,..
1.48
/
~
(
0
:
4a-
"
C
,L ' \ ' ::- ) /,
0
:
28
"
0 "\ :l.05
)j
- \
,
\ I (
1
.
37
\.
Gle,woodl
J. 96
{ J ll
.
08
R,
fle
Sp,ln Itf
'
I-
0
.
79
"
'
6
~~
0
.
26
1" j /}t
Collb,oo2
.
~
f?
~
J-7
-
.
39
f
~q>-
8
:
~~
J:~:::~
'}
vf:
70
7
0.
1
6
6
.
62'
j
N~
o.
,
96
V
-
2.0
0
/'
~
~
.J
).
38
~
'7.r.
0A2
~
·
·
0 •11•,
0.8~,GUN!j,fSOr-j/ -5
.
20
°
0.85
Del~ 1: •1.91
.,,
f
1
.
02
\
10
.
6
1l
J.OJ ,Monl,oserrJE
f;
7
.J
1.0
I
l_ \1.14
?
~
0
.
1
5'
'-,,.
,.
,
.,
\ '
-
0 5
.
)
16
.
53
°J
(
~
5
.
66
~
S11m1o~ 7 Blbndm/ 1 ,0
.
3
4'
17
4
1
I
s4'v tI1*
/
,_
2
.
80
lc
l
m,
f (
if~
)
·-.,,
0
.
68
6:~;
)
~
:
~f
)~
~
8.
?
:::.
}
J..
1J.47
'
o
·
~
~ V (' 1 Dulce ~-? / "6.70
-< ...\:...._3.0
.
0.45
0GUNNISON
2.27-X
l.14
-
0-0.5-Cv
X=
Arithmetic
mean
O=
Standard
deviation
C
=Variance
coefficient
VFig. 5 Mean, standard deviation, and coefficient of variation of "Annual precipitation [in inches) contributing to runoff" during a water year, determined by making certain reductions in observed precipitation for assumed mpotranspiration losses. See accompanying text for details.
fscotonre o'
6
.
2.
65
0.44
/ Kendall r1 Bedford /l S
.
18
.
~./ 2.
83
4
.
00
0
.
19
~-
2~
I
f, ~ ...l
6
I
.
\
2
.
24
\ 0
.
37
\
\
•
//
/
10
.
.(\°"
"
0 "3
.
87
0
.
39
Hiowothoe
lO
.
3
.
61
0
.
36
Elkhorn12
.
04
.
36
0
.
36
" Duchesne3
.
1.73
0
.
58
~
l
~
r
'
i
0 Bkmd1ng7
.
3
.
16
0.45
3
.
GrandUPPER COLORADO RIVER BASIN
ABOVE LEE'S FERRY, ARIZONA
14.
o,.,onl
l.
3
.00
0
.
27
3
.
74
...
,.,
0
.
27
4
.
2
.
24
"'"'
00.56
Collbran 0 0 25 0 25 50HRH
CONTOUR INTERVAL: 3000 FT.COLORADO STATE UNIVERSITY. 1961
~
I
I
7
.
2
.24
40
Sleombool Q.3
2
Fort Collins 8. Springs\
6.32
•
"'---r,
0
.
16
' ~
-Glenwood Springs•
39
.
4
.79
0
.
12
''
0 " ',,36
.
5.48
Doll~0
.
15
l 73
J,octoooo
:
58
•
13
.
3
.
88
0
.
3
16
.
4.79
0
.
3
33
.
6.
24
0.19
7
.
2
.
82
0.4
C'l"ested Poon10 Butte2.
•
8
.
0l
.
73
o,ua e2
.
83
0
.
86
0
.35
4
.
Mon !rose i> Gunnison8.
2.24
0.28
2.45
0
.
61
Tellunde35.
7
.00
0
.
20
Cortez15
.
4
.58
0
.
3
8 & Silver Ion35.
5
.
29
0
.
15
Ourongo16.
<> Pagosa4
.
36
Sp,ioo,r
O
.t
27
0 Dulce14
.
4
.
12
0
.29
0GUNNISON
8
.
- x
2
.24-0-0
.
28-Cv
X
=
Arithmetic
mean
O=Standard
deviation
c;
Variance coefficient
Fig. 6 Mean. standard de,iation. and coefficient of rniation of the "Number of storms contributing to runoff" during a water year,
B. DIFFERENCE BETWEEN AVERAGE
AND MEDIAN PRECIPITATION TOTALS IN SEMI-ARID CLIMATES
It has been the policy in most climatological data publications, including this one, to present
precipitation quantities as average precipitation by monthly totals for any particular location. This
average (mean) is obtained by the simple mechan-ics of adding together all of the monthly totals for the series of record available and dividing that total number by the quantity of months used in the sample. This is a very easy method for obtaining a general indication of the precipitation that may be expected in a given area, but it can be definitely misleading if the array of precipitation quantities
throughout the record is made up of a few very high monthly totals and the majority of the monthly
totals ranging around a much smaller value. The median value of monthly precipitation gives a better indicator of what to expect in the semi-arid region from which the Colorado River obtains its
runoff.
The median is defined as the point in a total sample which has half the number of individual values above it and half below it.
In any semi-arid region which has many
small storms and few large ones, the median value is consistently below the mean value. This fact is illustrated in Table IV, which shows the difference between monthly mean and monthly median in the three elevation groups used in Figure 2.
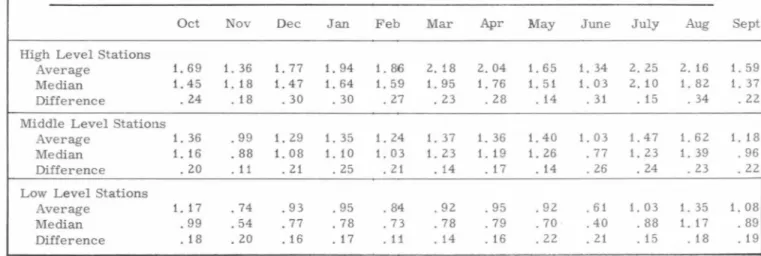
The difference between the average and the median at high level stations per month is 0. 24
inch. The difference at the middle 1 evel stations is O. 20 inch, and at low level stations, 0. 18 inch.
The most extreme case of relative importance is
the month of June at low elevation stations when the arithmetic average is 0. 61, while the median
9
is only O. 40. Even at the high elevation stations the difference between average and median is generally greater than 10 per cent of the monthly values.
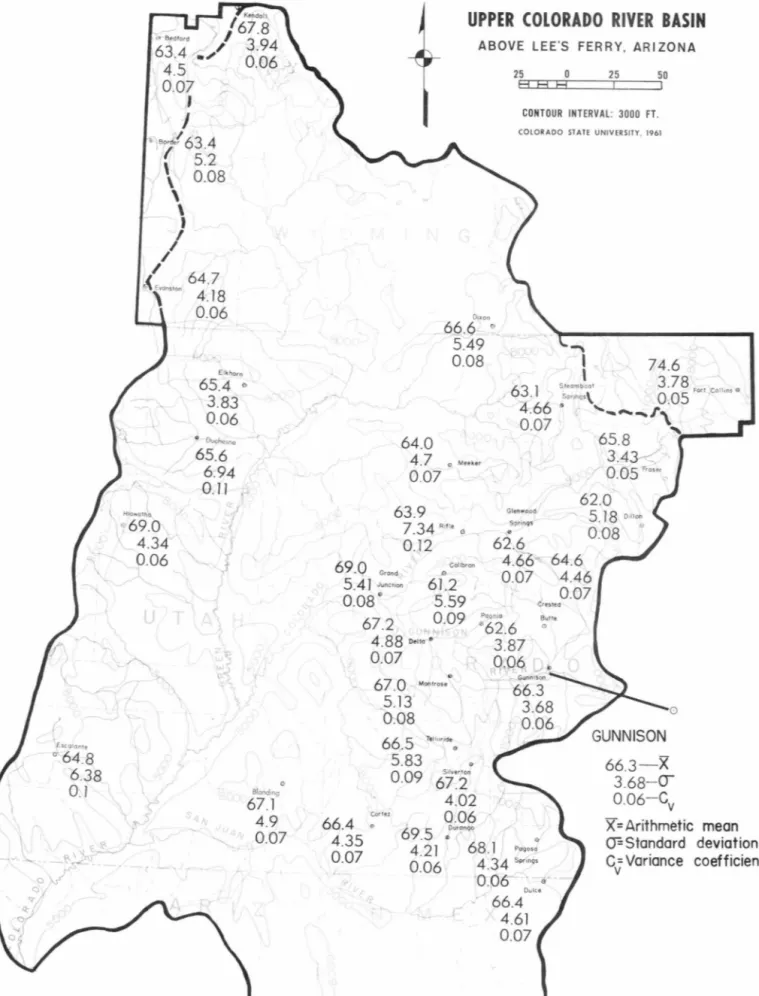
C. PERCENTAGE OF STORM PERJODS
GIVING VARIOUS FRACTIONS OF
TOT AL ANNUAL RA]:NF ALL
1. Percentage of Storm Periods Giving 25 Per Cent of the Annual Rainfall for the Water Year
The percentage of the number of storm periods required to give one-fourth of the annual rainfall for the year is shown in Figure 7. Figure 7 shows the skewed nature of the annual precipita-tion amounts. In every case approximately 65 per cent of the storm periods are required to produce
25 per cent of the annual rainfall. Conversely,
75 per cent of the annual rainfall is contributed by only 35 per cent of all storms.
Fort Collins, a station on the eastern slope of the Continental Divide, requires an exceptionally high percentage, 74. 6 per cent of all storms, to produce 25 per cent of its annual precipitation.
2. Percentage of Storm Periods Giving 50 Per Cent of the Annual Rainfall for the Water Year
For all the stations analyzed, approximately
85 per cent of the storm periods are required to produce 50 per cent of the annual rainfall for the water year. The other 50 per cent is produced by only 15 per cent of all storms. (Figure 8).
3. Percentage of Storm Periods Giving 75 Per Cent of the Annual Rainfall for the Water Year
Approximately 95 per cent of the storm periods are required to produce 75 per cent of the TABLE IV
COMPARISON 0F GROUP MEAN OF AVERAGE! MONTHLY PRECIPITATION AND GROUP MEAN
OF MEDIAN MONTHLY PRECIPITATION FOR THREE ELEVATION GROUPS (See Fig. 2)
Oct Nov Dec Jan Feb Mar Apr May June July Aug Sept
High Level Stations
Average 1. 69 1. 36 1. 77 1. 94 1. 86 2, 18 2.04 1. 65 1. 34 2, 25 2, 16 1. 59
Median 1. 45 1. 18 1. 47 1. 64 1. 59 1. 95 1. 76 1. 51 1. 03 2. 10 1. 82 1. 37
Difference . 24 . 18 . 30 . 30 . 27 . 23 . 28 . 14 . 31 . 15 . 34 . 22
Middle Level Stations
Average 1. 36 . 99 1. 29 1. 35 1. 24 1. 37 1. 36 1. 40 1. 03 1. 47 1. 62 1. 18
Median 1. 16 . 88 1. 08 1. 10 1. 03 1. 23 1. 19 1. 26 . 77 1. 23 1. 39 . 96
Difference . 20 . 11 . 21 . 25 . 21 . 14 . 1 7 . 14 . 26 . 24 . 23 . 22
Low Level Stations
Average 1. 17 . 74 ,93 . 95 . 84 . 92 . 95 . 92 . 61 1. 03 1. 35 1. 08
Median . 99 .54 . 77 . 78 . 73 . 78 . 79 . 70 .40 . 88 1. 17 . 89
10
annual rainfall for the water year. Therefore, the other 25 per cent of the annual rainfall comes from about 5 per cent of all storms.
The extreme case is again Fort Collins,
where 25 per cent of annual rainfall is produced by only e9' per cent of all storms. (Figure 9}.
"I Escolan1e
"'
64.8
6.38
0
.
1
\ / Kendall1
67
.
8
,., B,dfo,d3 94
6It
--;.
,/
o
."
06
0
.
07
r'
J
I"a
t
63.4
\
5
.
2
\
0.08
\
\
I
I
/I
/
64.7
.(
r
sto,
4
.
18
0
.
06
Elkhorn65.4
03.83
0.06
• Duchesne65
.
6
6
.
94
r0
.
11
.
H1ow01ho I 069
.
0
/
4
.
34
0
.
06
s'1
Biond1ng.,,
067
.
l
4
.
9
0
.
07
64
.
0
UPPER COLORADO R
I
VER BASIN
ABOVE LEE'S FERRY, ARIZONA
D11011
66.9
°
5.49
0
.
08
25 0 25 50HRH
CONTOUR INTERVAL: 3000 FT.COLORADO STATE UNIVERSITY. 1961
~
l
74
.
6
63 1
St,omboot3
.
78
\ Fort Colhns 0 - · .s.,,,.,0
.
05
4
0
.
.
66
07
, ...
--J\
, ___
_
65
.
8
4
.
7
El Meeker3.4
,'
0
.
05
frown0
.
07
63.9
7.34
R,fle 00
.1
2
Glenwood Springs•
62
.
6
62
.
0
5
.
18
0,11000
.
08
°
69
.
0
G,o,d5
.
41
J'""'°" Collbran <>61.2
5
.
59
0
.
09
4
.
66
0
.
07
64
.
6
4.46
0
.
07
0
.
08
°
67.2
4
.
88
Oello •0
.
07
67.0
Mootrnse5
.
13
0
.
08
.
66.5
Ttlturides Cortez5
.
83
&0
.
09
l'
/'
2
"
4
.
02
0.06
Crested Poon10 Butte 062
.
6
"
3
.
87
q
,
Q6
.... .,. Gunnison66.4
•
4
.
35
0
.
07
6
9
.
5
«>Our2ogo a4
.
21
68
.
l
Pagosa0
.
06
4
.
34
Sp,,ogs0
.
06
Dulci'
"
0GUNNISON
66.3-X
3
.
68-<T
0
.
06
-
Cv
X=Arithmetic
mean
O=Standard deviation
C
=Variance
coefficient
VEscolonte 0
84.5
4
.
19
0
.
05
\. ~'
/ Kefldol/'
/ 85.6
10 Btdfo,d /2 3
,83
.
2
.,
·
3.48.
0.0.J
,j.>1
0
.
04
rJ
I
I D"
7
'
83.3
\
3
.
33
\
0
.
04
t
'
\
I
//
/
84
.
2
. ( E,ooSloo2
_
86
\
0
.
03
w
y
0
'v1
< (N
·r
-..,
Efkhorn84
.
3
e3
.
38
0
.
04
8 Duchesne84.7
4.72
..0
.
06
JJ
'-1
J
1 L~·
~
) I, f 5
,~'
1
.._ ,,, I /1
83
.
5
UPPER
COLORADO RIVER
BASIN
ABOVE LEE'S FERRY, ARIZONA
G
84
.
~",
,.
,
-3
.
99
0
.
05
25 0 25 50HRH
CONTOUR INTERVAL: 3000 FT.COLORADO STATE UNIVERSITY. 1961
'"'\
I
89.4
I
3
.
09
82 8
SteombootO 03
Fort Collins ef • Soooo•\. •