Thesis
Analysis of multiple new-particle growth pathways observed at the US DOE Southern Great Plains field site
Submitted by Anna Hodshire
Department of Atmospheric Sciences
In partial fulfillment of the requirements For the Degree of Master of Science
Colorado State University Fort Collins, Colorado
Fall 2016
Master’s Committee: Advisor: Jeff Pierce Kelley Barsanti Delphine Farmer Sonia Kreidenweis
Copyright by Anna Hodshire 2016 All Rights Reserved
Abstract
Analysis of multiple new-particle growth pathways observed at the US DOE Southern Great Plains field site
New-particle formation (NPF) is a significant source of aerosol particles to the atmo-sphere. However, these particles are initially too small to have climatic importance and must grow, primarily through net uptake of low-volatility species, from diameters 1 nm to 30-100 nm in order to potentially impact climate. There are currently uncertainties in the physical and chemical processes associated with the growth of these freshly formed particles that lead to uncertainties in aerosol-climate modeling. Four main pathways for new-particle growth have been identified: condensation of sulfuric acid vapor (and associated bases when available), condensation of organic vapors, uptake of organic acids through acid-base chem-istry in the particle phase, and accretion of organic molecules in the particle phase to create a lower-volatility compound that then contributes to the aerosol mass. The relative impor-tance of each pathway is uncertain and may vary by geographic location and atmospheric conditions. Assessing the relative importance is the focus of this work.
The 2013 New Particle Formation Study (NPFS) measurement campaign took place at the DOE Southern Great Plains (SGP) facility in Lamont, Oklahoma, during spring 2013. Measured gas-and particle-phase compositions during these new-particle growth events sug-gest three distinct growth pathways: (1) growth by primarily organics; (2) growth by pri-marily sulfuric-acid/ammonia; and (3) growth by pripri-marily sulfuric-acid/bases/organics. To supplement the measurements, we used the particle-growth model MABNAG (Model for
Acid-Base chemistry in NAnoparticle Growth) to gain further insight into the growth pro-cesses on these three days at SGP. MABNAG simulates growth from (1) sulfuric-acid con-densation (and subsequent salt formation with ammonia or amines); (2) near-irreversible condensation from non-reactive extremely-low-volatility organic compounds (ELVOCs); and (3) organic-acid condensation and subsequent salt formation with ammonia or amines. MAB-NAG is able to corroborate the observed differing growth pathways, while also predicting that ELVOCs contribute more to growth than organic salt formation. However, most MAB-NAG model simulations tend to underpredict the observed growth rates between 10-20 nm in diameter; this underprediction may come from neglecting the contributions to growth from semi-to-low-volatility species or accretion reactions. Our results suggest that in addition to sulfuric acid, ELVOCs are also very important for growth in this rural setting. We discuss the limitations of our study that arise from not accounting for semi- and low-volatility or-ganics, as well as nitrogen-containing species beyond ammonia and amines in the model. Quantitatively understanding the overall budget, evolution, and thermodynamic properties of lower-volatility organics in the atmosphere will be essential for improving global aerosol models.
Acknowledgements
I would like to extend my sincere thanks and gratitude to my many co-authors who have greatly contributed to this work in terms of data, model support, and helpful writing edits: • Michael Lawler, who was in charge of the TDCIMS at SGP and helped me learn how
to understand and properly filter TDCIMS data;
• Jun Zhao and Coty Jen, who worked on the Cluster CIMS at SGP;
• John Ortega, who processed the PTR-MS data and provided helpful insights into our decision to discard its data;
• Taina Yli-Juuti, who provided continual support with running MABNAG;
• Jared Brewer and Jack Kodros who ran GEOS-Chem to provide modelled monoterpene concentrations;
• Kelley Barsanti, who taught me how to run the MABNAG model and whose chemistry insights were invaluable;
• Dave Hanson, who was in charge of the AmPMS at SGP and contributed greatly to my knowledge of amines;
• Pete McMurry, who was in charge of the SMPSs at SGP and who always contributed the steady, gentle guidance and wisdom that this work benefited greatly from;
• Jim Smith, who was in charge of the TDCIMS, the PTR-MS, and the endlessly enter-taining cow cam at SGP;
• and last but certainly not least, my advisor and co-author Jeff Pierce, who has been endlessly patient with me and the best mentor I could ask for. His excitement to pass on his boundless knowledges of particle growth and interactions as well as our
continual conversations about all things music has made my time so far at Colorado State University a true joy.
This research was supported by the U.S. Department of Energy’s Atmospheric System Research, an Office of Science, Office of Biological and Environmental Research program, under Grant No. DE-SC0011780 and Grant No. DE-SC0014469. Coty Jen was supported under a NSF AGS Postdoctoral Fellowship. Taina Yli-Juuti was supported by the Academy of Finland Centre of Excellence (grant no. 272041) and strategic funding from University of Eastern Finland.
I would also like to thank my mother for proofreading the small beastie that you have in front of you—her discerning eye has saved us all from many the comma error and other grammatical sins. And, of course, I would like to thank my mother, family, and friends for bearing with me and supporting me as I move upwards and onwards.
“Through meditation, I program my heart to beat breakbeats and hum basslines on exhalation.”
This thesis is typset in LA
Table of Contents
Abstract . . . ii
Acknowledgements . . . iv
List of Tables . . . viii
List of Figures . . . ix Chapter 1. Introduction . . . 1 Chapter 2. Methods . . . 8 2.1. Measurements . . . 9 2.2. ELVOC estimate . . . 12 2.3. Model description . . . 14
2.4. Growth rate calculations . . . 22
2.5. HYSPLIT back trajectories . . . 25
Chapter 3. Results . . . 26
3.1. April 19: Growth by primarily organics . . . 26
3.2. May 9: Growth by primarily sulfuric acid and ammonia . . . 32
3.3. May 11: Growth by sulfuric-acid/bases/organics . . . 37
3.4. Synthesis across days . . . 42
3.5. Limitations of This Study . . . 44
3.6. The Southern Great Plains: Comparison to other campaigns . . . 46
Chapter 4. Conclusions . . . 49
Bibliography . . . 54
Appendix A. List of abbreviations . . . 80
Appendix B. Growth Rate Methods . . . 81
Appendix C. All SGP data collected from April 19-May 23. . . 85
List of Tables
2.1 Gas-phase concentration and temperature inputs to MABNAG for each day. . . 18 2.2 Chemical properties for each species input in MABNAG. . . 19 2.3 Observed growth-rate ranges between 10 and 20 nm for each day. . . 24
D.1 Breakdown of the % dissociations of the acids and bases in MABNAG for April 19, 2013.. . . 121 D.2 Breakdown of the % dissociations of the acids and bases in MABNAG for May 9,
2013. . . 122 D.3 Breakdown of the % dissociations of the acids and bases in MABNAG for May 11,
List of Figures
2.1 Growth events and associated HYSPLIT trajectories for our case days. . . 9
3.1 Measurements and model prediction for April 19, 2013. . . 28
3.2 All MABNAG cases for April 19, 2013. . . 29
3.3 Measurements and model prediction for May 9, 2013. . . 34
3.4 All MABNAG cases for May 9, 2013. . . 35
3.5 Measurements and model prediction for May 11, 2013 . . . 39
3.6 All MABNAG cases for May 11, 2013. . . 40
B.1 Growth rate methods for April 19, 2013 . . . 82
B.2 Growth rate methods for May 9, 2013 . . . 83
B.3 Growth rate methods for May 11, 2013 . . . 84
C.1 SGP data collected for April 19, 2013. . . 85
C.2 SGP data collected for April 20, 2013. . . 86
C.3 SGP data collected for April 21, 2013. . . 87
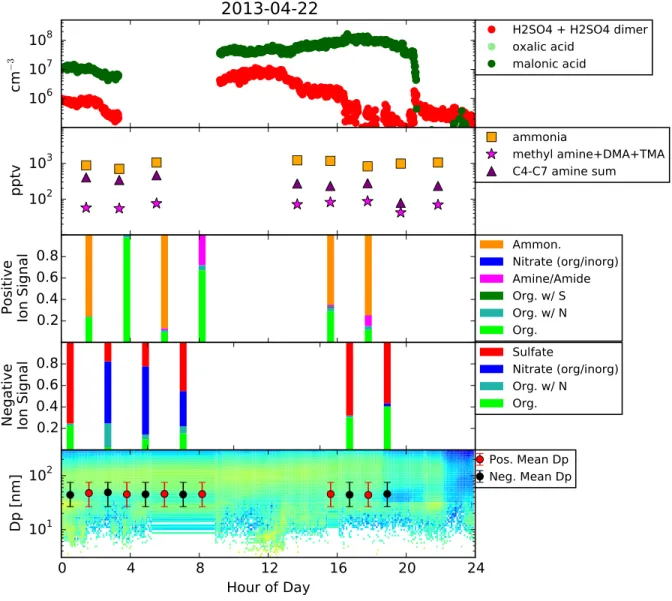
C.4 SGP data collected for April 22, 2013. . . 88
C.5 SGP data collected for April 23, 2013. . . 89
C.6 SGP data collected for April 24, 2013. . . 90
C.7 SGP data collected for April 25, 2013. . . 91
C.8 SGP data collected for April 26, 2013. . . 92
C.9 SGP data collected for April 27, 2013. . . 93
C.11 SGP data collected for April 29, 2013. . . 95
C.12 SGP data collected for April 30, 2013. . . 96
C.13 SGP data collected for May 1, 2013. . . 97
C.14 SGP data collected for May 2, 2013. . . 98
C.15 SGP data collected for May 3, 2013. . . 99
C.16 SGP data collected for May 4, 2013. . . 100
C.17 SGP data collected for May 5, 2013. . . 101
C.18 SGP data collected for May 6, 2013. . . 102
C.19 SGP data collected for May 7, 2013. . . 103
C.20 SGP data collected for May 8, 2013. . . 104
C.21 SGP data collected for May 9, 2013. . . 105
C.22 SGP data collected for May 10, 2013. . . 106
C.23 SGP data collected for May 11, 2013. . . 107
C.24 SGP data collected for May 12, 2013. . . 108
C.25 SGP data collected for May 13, 2013. . . 109
C.26 SGP data collected for May 14, 2013. . . 110
C.27 SGP data collected for May 15, 2013. . . 111
C.28 SGP data collected for May 16, 2013. . . 112
C.29 SGP data collected for May 17, 2013. . . 113
C.30 SGP data collected for May 18, 2013. . . 114
C.31 SGP data collected for May 19, 2013. . . 115
C.33 SGP data collected for May 21, 2013. . . 117 C.34 SGP data collected for May 22, 2013. . . 118 C.35 SGP data collected for May 23, 2013. . . 119
CHAPTER 1
Introduction
Atmospheric aerosols can affect climate directly, through the absorption and scattering of solar radiation (Rosenfeld et al., 2008; Clement et al. 2009), and indirectly, by modifying cloud properties (Charlson et al., 1992). Both of these effects depend on aerosol particle size, with particles with diameters larger than 50-100 nm dominating the effects. Larger particles scatter and absorb radiation more efficiently than smaller particles (Seinfeld and Pandis, 2006), and particles with diameters larger than 50-100 nm have the potential to act as cloud condensation nuclei (CCN; a full list of all abbreviations used in the paper is listed in Appendix A) (e.g., Seinfeld and Pandis, 2006). CCN number and activity are instrumental in determining cloud properties, including precipitation and albedo (Rosenfeld et al., 2008; Forster et al., 2007). The predictions of these aerosol impacts on climate remain amongst the largest uncertainties in climate models (Boucher et al., 2013). Thus, in order to better constrain the climate effects of aerosols, atmospheric particle size distributions must be accurately modeled.
The majority of atmospheric aerosols originate from photochemically driven new-particle formation (NPF) (e.g., Spracklen et al., 2008; Pierce et al., 2009). NPF is regularly observed to occur throughout the troposphere (e.g. Kulmala et al., 2004; Kuang et al., 2010). We distinguish between nucleation and NPF as follows: Nucleation is the formation of stable particles 1 nm in diameter from gas-phase sulfuric-acid molecules and stabilizing vapors that could include water, ammonia, amines, diamines, and oxidized organic molecules (e.g. Kirkby et al., 2011; Chen et al., 2012; Almeida et al., 2013; Riccobono et al., 2014; Jen et al., 2016). NPF, however, includes the growth of these stable nuclei to sizes frequently
observed in the atmosphere (larger than 3-10 nm). In order to grow to climate-relevant sizes, new particles must grow through uptake of vapors while avoiding being lost to coagulation by larger particles. This competition between growth and coagulational scavenging depends primarily on initial and final particle size, growth rate, and the concentration of pre-existing aerosols (Kerminen et al., 2004; Pierce et al., 2007; Kuang et al., 2010; Westervelt et al., 2013; Westervelt et al., 2014). Large impacts of NPF on CCN are most favorable under conditions of fast particle growth rates and low pre-existing aerosol concentrations (small coagulation sinks). Thus, it is important to understand both particle growth and the time-evolving particle size distributions in order to model the resulting CCN concentrations from new-particle events accurately. In this work, we focus upon the growth of particles from these NPF events.
Particle growth from NPF events is chemically complex and poorly understood. Irre-versible condensation of sulfuric acid vapor (produced through gas-phase oxidation of SO2
by the hydroxyl radical) is known to be a major contributor to growth. The effective equilib-rium vapor pressure of sulfuric acid in the presence of tropospheric water vapor is negligible compared to ambient sulfuric acid concentrations (Marti et al., 1997), and sulfuric acid read-ily condenses to the smallest stable particles, often forming inorganic salts with associated bases when available.. However, observed particle growth often exceeds that which can be explained by the condensation of sulfuric acid alone (Weber et al., 1997; Stoltzenburg et al., 2005; Riipinen et al., 2007; Iida et al., 2008; Kuang et al., 2010; Smith et al. 2010; Pierce et al., 2012). These and other studies have shown that the uptake of low-volatility organic va-pors is also important and even explains the majority of growth for some regions (e.g., Smith et al., 2008; Kuang et al., 2009; Riipinen et al., 2011; Bzdek et al., 2014; Xu et al., 2015).
Growth by organics may involve a large number of species and multiple growth pathways (Ri-ipinen et al., 2012). We propose that particle growth rate can be modelled as the sum of the following processes: irreversible condensation of sulfuric acid (GRH2SO4), reversible or nearly
irreversible condensation of semivolatile or low-volatility organic compounds (GRorg−cond), uptake of organic acids through acid-base chemistry in the particle-phase (GRacid−base); and
growth from the accretion of two or more organic molecules in the particle phase to form a lower-volatility compound that can then contribute to aerosol mass (GRaccret):
GR= GRH2SO4+ GRorg−cond+ GRacid−base+ GRaccret
(1)
The contribution of atmospheric vapors to observed growth rates through condensation of these organic vapors (without reactions in the particle phase) depends heavily upon the volatility of the organics in the gas phase. It is estimated that the equilibrium vapor pressure required for near-irreversible condensation of vapors onto nanoparticles (defined here to be aerosol particles with an ambient diameter less than 50 nm) must be around 10−7 Pa ( 10−12
atm) or less, corresponding to a saturation concentration of 10−4-10−3 µg m−3 (Donahue et
al., 2011; Pierce et al., 2011).
The presence of essentially non-volatile organic vapors in the atmosphere, referred to here as extremely low-volatility organic compounds (ELVOCs), defined to have saturation concentrations of around 10−4 µg m−3 or less (Murphy et al., 2014), have been detected in
both laboratory and ambient measurements (Ehn et al., 2012; Zhao et al., 2013, Jokinen et al., 2015). Ehn et al. (2014) proposed a possible chemical pathway in which large atmo-spheric organic parent molecules (e.g. terpenes) undergo initial oxidation to form peroxy radicals followed by rapid autoxidation (self reaction), creating highly oxygenated, yet still
large (e.g., 10 carbons) molecules. This pathway has since been confirmed by Jokinen et al. (2014) and Rissanen et al. (2014). Jokinen et al. (2015) determined ELVOC yields from five major biological volatile organic compound (BVOC) species from both ozonolysis and OH oxidation, including isoprene and 4 monoterpenes (limonene, alpha-pinene, myrcene, and beta-pinene). The ELVOC yield for isoprene from the two oxidation pathways is low (0.01% and 0.03%, respectively); however, since isoprene emissions are the highest among all non-methane BVOCs (Guenther et al., 2004), these pathways could contribute an appreciable amount of ELVOCs in high isoprene-emitting regions (e.g., Yu et al., 2014). The monoter-penes have much higher ELVOC yields, ranging from 0.12% to 5.3%, dependending on both the monoterpene structure and oxidation pathway. Subsequent global aerosol simulations have indicated that the ELVOCs produced from the observed monoterpene yields increased NPF and growth globally, which in turn increased total number concentrations across most of the continental regions and moderately increased the number of CCN (Jokinen et al., 2015).
Ammonia can form inorganic salts in atmospheric particles with sulfuric acid and nitric acid (Jaeschke et al., 1998; Seinfeld and Pandis, 1998); these reactions shift the equilibrium of ammonia (the partitioning species) to the particle phase, as the inorganic salts are lower in volatility than their individual constituents (Pankow, 2003; Pinder et al. 2007). Amines (nitrogen-containing bases with at least one carbon) and organic acids also are observed in growing new atmospheric particles (e.g., Mkel et al, 2001; Smith et al., 2008; Smith et al., 2010; Wang et al., 2010; Tao et al., 2015). Since the vapor pressures of these compounds are higher than is favorable for contributing to new-particle growth by non-reactive condensation alone, the formation of organic salts (formed from organic acids reacting with either amines or ammonia) has been suggested as a potential mechanism for reducing the volatility of these
compounds (Barsanti et al., 2009). The presence of these organic-acid and base species in the particle phase depends on the thermodynamic properties of these species (volatility and pKa) (Barsanti et al., 2009) as well as the amount of sulfuric acid, which will preferentially react with bases.
Accretion products are formed from a large variety of reactions through which organic molecules may contribute to particle mass by reactions between organic molecules that reduce the volatility of the parent molecules (Barsanti and Pankow, 2004; Pun and Seigneur, 2007). Assessing the tendency of atmospheric molecules to undergo accretion reactions via ther-modynamic considerations showed that glyoxal and methylglyoxal and acetic, malic, maleic, pinic, and likely other similar mono- and di-carboxylic acids have the thermodynamic poten-tial to contribute significantly to particle growth under the right kinetic conditions (Barsanti and Pankow, 2004; 2005; 2006). Matsunaga et al. (2005) found that small multifunctional compounds (e.g. methylglyoxal) in the ambient atmosphere had a much higher particle-phase affinity than predicted by their Henrys law constants; they proposed oligomerization as a possible pathway. Several laboratory studies have confirmed the presence of accretion products in secondary organic aerosols (SOA) formed from a variety of precursor species (Limbeck et al., 2003; Tolocka et al., 2004; Heaton et al., 2007; Wang et al., 2010). On a mass basis, polymers and oligomers have been found to account for up to 50% of the SOA formed from ozonolysis (Gao et al., 2004; Kalberer et al., 2004; Hall and Johnston et al., 2011). Wang et al. (2010) directly observed oligomers from glyoxal reactions in growing particles from 4-20 nm in diameter, indicating that accretion products have the potential to contribute to new-particle growth. While there are studies showing that accretion could be an important process for particle growth, there are still many uncertainties associated with it.
Despite the growing body of evidence for multiple growth pathways for new-particle growth, current global and regional model studies of aerosol impacts focus on growth through the condensation of vapors only, generally sulfuric acid and lumped organics (e.g. Yu et al., 2011; D’Andrea et al., 2013; Jokinen et al., 2015; Scott et al., 2015). Often, global and re-gional models with online aerosol microphysics have made simplified assumptions about SOA yields and the size-dependent uptake of organic vapors to particles. Many microphysics mod-els assume fixed SOA yields (e.g., Pierce et al, 2009; Spracklen et al., 2010; Spracklen et al., 2011; Westervelt et al., 2013), as size- and volatility-resolved vapor condensation/evaporation is a computationally burdensome system; others explicitly include volatility-dependent yields (e.g., Zaveri et al., 2008; Yu et al., 2011). The fixed-yield models either treat SOA as ideally semi-volatile, with the assumption that organic vapors reach instantaneous equilibrium with the aerosol and condense proportionally to the pre-existing particle mass distribution, or the models assume that the SOA is effectively non-volatile and condenses proportionally to the pre-existing Fuchs-corrected surface area (Pierce et al., 2011; Riipinen et al., 2011; Zhang et al., 2012a).
Generally, regional and global models do not account explicitly for the possible particle-phase reactions (organic acid-base chemistry and oligomerization) with some exceptions (e.g. Carlton et al 2010). To our knowledge, no regional or global modelling study has investi-gated the role of these particle-phase reactions on new-particle growth. The studies discussed above are simply attempting to account for all growth via traditional non-reactive gas-phase condensation. On the other hand, there are several process-based box models that implicitly or explicitly simulate particle-phase processes in addition to condensation and non-reactive partitioning, including the oligomer formation framework of Pun and Seigneur (2007) and Ervens et al. (2010); the kinetic modelling framework of P¨oschl et al. (2007), extended
by Shiraiwa and co-workers to build multi-layer kinetic models of gas-aerosol interactions (Shiraiwa et al., 2009; 2010; 2012); and the Model for Acid-Base chemistry in NAnoparticle Growth (MABNAG; Yli-Juuti et al. (2013)), a single-particle growth model that simulates particle-phase acid-base reactions as well as condensation/evaporation. (MABNAG has since been extended to include oligomerization reactions (T. Yli-Juuti, personal communication).) These detailed, process-based aerosol models may be used to determine the relative contribu-tions of the various potential growth pathways (GRH2SO4, GRorg−cond, GRacid−base, GRaccret)
but to our knowledge have not been used extensively in conjunction with detailed measure-ments of growth events. Ultimately, well-tested and measurement-informed process-based models should be used in the future to create next-generation particle-growth schemes for more realistic global and regional aerosol models.
In this study, we seek to understand the species and mechanisms that drove the growth of new particles observed during the Southern Great Plains (SGP) New Particle Formation Study (NPFS) in April-May 2013 in Oklahoma, USA. We attempt to find closure in particle growth rates and particle composition between a state-of-the-art process-based growth model (MABNAG) and detailed measurements of particle growth, particle composition, and gas-phase species. We consider GRH2SO4, GRorg−cond, and GRacid−base. We do not consider
GRaccret as we do not have sufficient measurements to constrain these rates. Through this
closure process, we provide estimates of the dominant species and mechanisms for three specific growth events observed during the study. Section 2 provides an overview of our measurement and modelling methods. Section 3 closely examines three NPF events observed during the NPFS at SGP and compares these events to modelling results using MABNAG. Conclusions and future work are discussed in Section 4.
CHAPTER 2
Methods
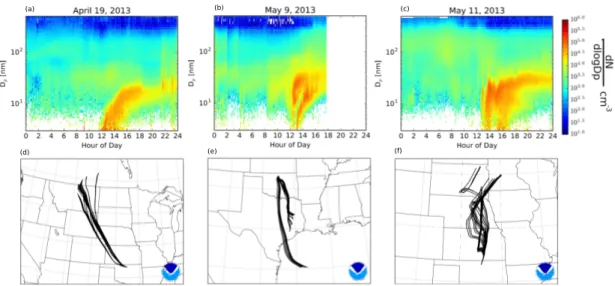
The Southern Great Plains (SGP) New Particle Formation Study (NPFS) took place from April 13 to May 24, 2013 (http://www.arm.gov/campaigns/sgp2013npfs). The pri-mary objectives of the campaign were to study the formation and evolution of aerosols and the impacts of the newly formed particles on cloud processes. The majority of the measure-ments (and all of those used in this work) took place at the US Department of Energy (DOE) Atmospheric Radiation Measurement (ARM) SGP Central Facility in the Guest Instrument Facility. The site is representative of the large Great Plains region, with agricultural activi-ties, such as cattle and pig husbandry, as well as oil and gas extraction. To our knowledge, nucleation and growth in the Great Plains region have not been studied in detail. For more information on the site and campaign, visit the DOE and campaign report websites (http://www.arm.gov/sites/sgp and http://www.arm.gov/campaigns/sgp2013npfs). Thir-teen new-particle formation events were observed during the NPFS. In this paper, we focus on three new-particle formation events that occurred on April 19, May 9, and May 11; these were the days where NPF was observed and all the available equipment was operating prop-erly. Figure 2.1 shows the observed size distributions and derived back trajectories from the HYbrid Single-Particle Lagrangian Integrated Trajectory (HYSPLIT) model (Draxler and Rolph, 2012; Rolph, 2012) for these three days. These data will be described in detail later. Appendix C contains figures for all of the data collected at SGP for April 19-May 23.
(a) (b) (c)
(d) (e) (f)
Figure 2.1. (a-c) The growth events for April 19, May 9, and May 11, 2013, as captured by a scanning mobility particle sizer at SGP. Each plot shares the same colorbar. (d-f) The associated 48 hour HYSPLIT back trajectories for each day as calculated using the NOAA Hysplit Model with NAM meteoro-logical data, initialized at 250 m AGL.
2.1. Measurements
During the 6-week campaign, 13 new-particle formation events were observed at Lamont by a battery of three Scanning Mobility Particle Sizers (SMPS) operated in parallel. They included the DEG SMPS (a TSI 3085 Nano DMA operated with a laboratory prototype laminar flow diethylene glycol condensation particle counter detector; Jiang et al.(2011); 1.9-13.6 nm mobility diameter), a Nano SMPS (a TSI 3085 Nano DMA operated with a TSI 3025A laminar flow ultrafine butanol CPC detector; 2.8-47 nm mobility diameter), and a conventional SMPS (a home-built long column DMA with dimensions similar to the TSI 3071 with a TSI 3760 CPC detector; 23-528 nm mobility diameter). For all systems, filtered ambient air was used for the DMA sheath air, without adjusting the water vapor partial pressure. Therefore, the relative humidity was close to ambient relative humidity, and particle water content was close to that in the atmosphere.
Nanoparticle composition data were collected using the Thermal Decomposition Chemi-cal Ionization Mass Spectrometer (TDCIMS) (Voisin et al., 2003; Smith et al., 2004). For the observations reported here, we used the recently developed time-of-flight mass spectrometer version of the instrument (TOF-TDCIMS) (Lawler et al., 2014). The TDCIMS measures the molecular composition of size-selected atmospheric nanoparticles in near-real-time. It performs this measurement by first charging and size-selecting nanoparticles using unipolar chargers and differential mobility analyzers, respectively. Charged, size-selected particles are collected by electrostatic precipitation onto a platinum filament for approximately 30 min. Following this, the filament is moved into the ion source of a chemical ionization mass spectrometer and undergoes a current ramp to reach an estimated maximum temperature of 600 ◦C.This heating thermally desorbs and/or decomposes the sample to produce gas phase
analyses. Two different chemical ionization reagents are used to detect the chemical species desorbed from the sample: H3O+(H2O)n(n=0-3), hereafter referred to as positive ion
chem-istry, detects base compounds such as ammonia and amines as well as carbonyl-containing compounds and some alcohols; O2−(H3O)n (n=0-3), hereafter referred to as negative ion
chemistry, detects organic and inorganic compounds with acid groups, as well as other oxy-genated compounds with high electron affinities. During the campaign, the instrument cycled roughly hourly between positive and negative ion chemistry. We classify the detected ions into the following categories: ammonia, amine/amide, organics with sulfur, organics with nitrogen, organics without sulfur or nitrogen, sulfate, and nitrates that are either oxidized (no carbons) or inorganic (see Figures 3.1-3.5, panels c-d). At the present time, we have not identified marker compounds for the condensation of ELVOCs; however, a prior laboratory study has shown that the detection of organic acids in nanoparticles correlates with the early growth of nanoparticles from the oxidation of a-pinene (Winkler et al., 2012). We are also
unable to distinguish between the oxidized nitrates and the inorganic nitrates; thus we have grouped these ions together (the nitrate(ox/inorg) category in Figures 3.1-3.5, panels c-d).
Ambient gas-phase sulfuric acid (both monomers and dimers), malonic acid, and oxalic acid were measured with the Cluster CIMS using nitrate core ion (present primarily as dimer, HNO3·NO3−) as the chemical ionization reagent ion (Zhao et al., 2010). Sulfuric acid,
mal-onic acid, and oxalic acid were detected at m/z 160, 166, and 152 respectively (the molecules clustered with a nitrate ion). The Cluster CIMS measures those acids with unit mass res-olution. The detection of sulfuric acid in the CIMS has been quantified and calibrated,and the uncertainties for the concentrations of the monomers and dimers of sulfuric acid are estimated to be factors of 1.5 and 3, respectively (Chen et al., 2013). However, the detection of oxalic acid and, to a much lesser extent, malonic acid may not be as efficient as sulfuric acid due to gas-phase proton affinities of the organic acids compared to that of nitric acid. A calibration comparison with a different Cluster CIMS using acetate (CH3CO2H·CH3CO2−)
as the reagent ion (Jen et al., 2015) showed up to two orders of magnitude higher inferred oxalic acid concentration and approximately similar malonic concentrations as the nitrate Cluster CIMS. Therefore, the estimated systematic uncertainty in the oxalic acid concentra-tion measured via nitrate chemical ionizaconcentra-tion is approximately up to a factor 100 times lower than reported, indicating that the actual concentration could be up to 100 times higher than observed. We explore the sensitivity of the model to these organic-acid uncertainties in this paper.
Ambient gas-phase amines and ammonia concentrations were measured using the Ambi-ent pressure Proton transfer Mass Spectrometer (AmPMS) (Hanson et al., 2011; Freshour et al., 2014), a quadrupole instrument (unit mass resolution) with high sensitivities for ammo-nia and amines. Signals at the protonated parent masses for methylamine, dimethylamine,
and trimethylamine (C1-C3 amines) were assigned with confidence; also detected was a suite of larger alkylamines with four to seven carbons (C4-C7). Less is known about the specia-tion of these larger amines, as ambient measurements of amines larger than C3 are not often made (e.g. Ge et al., 2011). Contribution of amides to the signals at the masses of the larger amines may also be significant; as such, no structure information was assigned to the C4-C7 amines, as many isomers are possible. Uncertainties in the AmPMS data for this campaign is discussed further in Freshour et al. (2014) and is estimated to be +150/-60%, overall.
A Proton Transfer Reaction Mass Spectrometer (PTR-MS) based on the design of Hanson et al. (2011) was operated unattended during the campaign and was set to measure a suite of volatile organic compounds (VOCs), including isoprene and monoterpenes. However, only one calibration was done for the PTR-MS on May 18, 35 days into the campaign, and during processing, unexplainable spikes were seen in the data at irregular intervals. Further, monoterpene mixing ratios were nearly always unreasonably high (often ranging between 10-100 ppbv). For comparison, a field site in Manitou, Colorado, comprised of a ponderosa pine stand, had maximum monoterpene mixing ratios of 1-2 ppbv during the mid-summer (Ortega et al., 2015), and we expect the monoterpene emissions near the SGP (with few trees) site in April and May to be lower than the forested Manitou site in summer. We thus lack confidence overall in the VOC data obtained by the PTR-MS, so we use an alternative method for estimating monoterpene concentrations, which is described below.
2.2. ELVOC estimate
Rather than using the PTR-MS for VOC data, which suffered from calibration issues, we estimate monoterpene emissions and concentrations using the Model of Emissions of Gases and Aerosols from Nature version 2.1 (MEGAN2.1) (Guenther et al, 2006; Guenther
et al, 2012; Sindelarova et al., 2014) in the Goddard Earth Observing System chemical-transport model (GEOS-Chem; http://geos-chem.org). We ran MEGAN2.1 in GEOS-Chem at a 2x2.5 degree resolution to estimate monoterpene emissions rates (monoterpenes are not tracked as prognostic species in these GEOS-Chem simulations). The specific monoterpenes estimated are α-pinene, β-pinene, limonene, sabinene, myrcene, 3-carene, ocimene, and the lumped sum of other monoterpenes (see Guenther et al., 2012 for a complete list). These GEOS-Chem simulations use GEOS-FP meteorological fields generated by the Goddard Modeling and Assimilation Office (GMAO, http://gmao.gsfc.nasa.gov/) and include biogenic emission-factor updates to MEGAN2.1 based on Guenther et al. (2012) and Sindelarova et al. (2014). For a discussion on the uncertainties associated with emissions from MEGAN2.1, see Guenther et al. (2012). We estimate pseudo-steady-state monoterpene concentrations by assuming that the emitted monoterpenes are well mixed up to the boundary-layer (BL) height measured at SGP, and that emissions are balanced by chemical loss by ozonolysis. (The BL height measurements were obtained by the ARM value-added product radiosonde (PBLHTSONDE) at the SGP Central Facility.) For ozonolysis, we used a rate constant, k, of 8.1 x 10⁻¹⁷ cm3 molecule−1 s−1 for all monoterpenes, from IUPAC (http://www.iupac.org).
For the ozone concentrations, we used hourly ozone monitor measurements from the closest EPA monitoring site, at Dewey, OK, which is 120 miles (∼190 km) SW of the SGP site. The uncertainty in ozone concentration due to the distance between measurements is a source of potential error in our monoterpene concentration calculation; however, since we expect ozone concentrations to be relatively homogeneous regionally, we expect other errors (such as ELVOC yields), to be more significant sources of ELVOC uncertainty.
We estimate the gas-phase ELVOC from the oxidation of the monoterpene (MT) con-centrations obtained from MEGAN, assuming a pseudo-steady state between its chemical
production and loss by irreversible condensation (Pierce and Adams, 2009) and neglect-ing dry deposition as the condensation sink timescales are faster than the dry-deposition timescales (Pierce and Adams, 2009):
[ELV OC] = 0.03k[O3][M T ] CS (2)
where CS is the condensation sink, calculated from the SMPS aerosol size-distribution mea-surements. We note that the SMPS measurements only go up to 650 nm mobility diameter, so the condensation sink calculated represents a lower limit on the actual condensation sink. The prefactor, 0.03, is the ELVOC molar yield from the α-pinene + ozone reaction found in Jokinen et al. (2015). α-pinene represents 30% of the MEGAN-estimated monoterpenes present at SGP during the campaign, which is the largest fraction by any of our estimated monoterpene species. Thus, we assume the α-pinene yield to be representative of all of the monoterpenes; in reality, some monoterpene species have higher or lower yields. We do not know the ELVOC yield from oxidation processes for all monoterpene species; thus, this esti-mate of the ELVOC concentration should be taken as one possible outcome of monoterpene oxidation. We also acknowledge that our modelled monoterpene concentrations depend on the modelled ozone concentrations, whereas we used the measured ozone concentrations to determine the ELVOC yield. The errors in this assumption are likely small compared to our uncertainties in the ELVOC yield.
2.3. Model description
The Model for Acid-Base chemistry in NAnoparticle Growth (MABNAG) has been de-veloped by Yli-Juuti, et al (2013) to simulate the growth and composition of a single particle
resulting from both condensation of low-volatility vapors and acid-base reactions in the par-ticle phase. The version of MABNAG used for this study accepts as inputs the gas-phase concentrations and properties of water, sulfuric acid, a representative organic acid, ammo-nia, a representative amine, and a representative non-reactive organic, taken here to be an extremely-low-volatility organic compound (ELVOC). The organic compounds are rep-resented in MABNAG with the chemical properties (e.g. pKa, molecular mass, equilibrium vapor pressure) of one organic acid, one amine, and one ELVOC; thus, we must make as-sumptions about the properties of the organic acid, amine, and ELVOC inputs that are representative for the wide ranges of organic-acid, amine, and ELVOC species. MABNAG also requires an initial particle size and composition; for simplicity in this study, the initial particle is formed from 20 molecules of each input species, creating a particle approximately 3 nm in diameter. The choice of molecules in forming the initial particle has negligible influ-ence on the growth rate and composition in the 10-20 nm size range. We assume a particle density of 1.5 g cm−3 and a surface tension of 0.03 N m−1. A sensitivity case using 0.05
N m−1 for the surface tension did not affect our results at the particle diameters where we
compare to measurements (above 10 nm).
The uptake rates of sulfuric acid, the organic acid, and the ELVOC are calculated as gas-phase-diffusion-limited mass transfer based on their ambient vapor pressures, equilibrium vapor pressures, and gas-phase diffusivities. Water and the bases are assumed to instantly reach equilibrium between the gas and particle phases due to their higher diffusivities and pure-species vapor pressures. Upon uptake, subsequent acid dissociations and base protona-tions in the particle phase are calculated by the Extended Aerosol Inorganics Model (E-AIM) (http://www.aim.env.uea.ac.uk/aim/aim.php, Clegg et al., 1992; Clegg and Seinfeld, 2006a, b; Wexler and Clegg, 2002). It is assumed that the ELVOC does not dissociate in the
particle phase. This vapor pressure is low enough that uptake of ELVOCs is essentially irreversible, even at the smallest simulated particle sizes. We do not consider any additional particle-phase reactions beyond the acid-base reactions: this includes possible accretion re-actions that could contribute to growth. The version of MABNAG that includes accretion reactions (T. Yli-Juuti, personal communication) requires as additional inputs the gas-phase concentrations and properties of two semi-volatile organic compounds (SVOCs), organics with saturation concentrations of 100-102 µg m−3 (Murphy et al., 2014). We have estimated
ELVOC concentrations as they have been shown to have a direct oxidation pathway from monoterpene species to ELVOC species (e.g. Jokinen et al., 2015). On the other hand, the estimations of the concentrations of semivolatile organic compounds (SVOCs), organics with saturation concentrations of 100-102 g m-3 (Murphy et al., 2014), and the contribution to growth from oligomerization is much less constrained: one must know how the SVOCs are reversibly partitioning to the full aerosol size distribution (as 35 opposed to irreversible con-densation to the concon-densation sink for ELVOCs), and oligomerization rates and the involved SVOC species are highly uncertain. For these reasons, we will not attempt to estimate the SVOC concentration present at SGP and will neglect oligomerization reactions in this work. SVOCs may also directly contribute to particle growth through condensation, as can low-volatility organic compounds (LVOCs), organics with saturation concentrations of 10−1-10−3
µg m−3 (Murphy et al., 2014). The condensation of SVOCs and LVOCs depends on particle
size; the likelihood of irreversible condensation increases with increasing particle size (Pierce et al., 2011). Pierce et al. (2011) estimates that SVOCs and LVOCs can begin contributing to particle growth at diameters as small as ∼10 nm and ∼3 nm, respectively, but there are still considerable uncertainties as to the extent in which LVOCs and SVOCs partition to these smaller particle sizes. Thus, omitting LVOCs, SVOCs and resultant condensational growth
and/or oligomerization reactions from SVOCs that contribute to growth is a limitation of this study and will be discussed further in the conclusions.
MABNAG assumes that species that enter the particle are instantaneously and homo-geneously mixed into a liquid particle phase. This ignores potential particle-phase diffusion limitations that can arise from heterogeneous particle phases. SOA has been observed to have solid and semi-solid phases in both the laboratory and the field (Virtanen et al., 2010; Virtanen et al., 2011). Riipinen et al. (2012) estimated the importance of potential diffusion limitations as a function of size: they argue that diffusion does not limit growth for particles smaller than 20 nm diameter but is potentially important for particles 20-50 nm. However, this remains an uncertainty, and we will address this later.
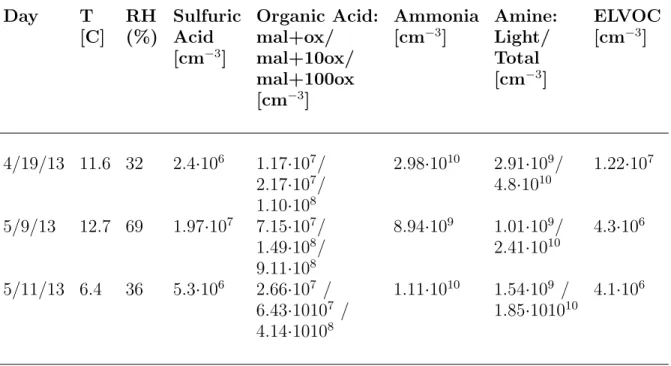
2.3.1. Model inputs. Inputs to MABNAG were: the gas-phase concentrations from observations or MEGAN-based modelling (Table 2.1) and chemical properties (Table 2.2) of water, sulfuric acid, ammonia, an amine, an organic acid, and a non-reactive organic. Rel-ative humidity (RH) is used as a proxy for the water concentration and was obtained from the 60-m tower data maintained by ARM at the Central Facility. Atmospheric temperature was also obtained from the 60-m tower data. The SGP measurement data described earlier provides the gas-phase concentrations of sulfuric acid; ammonia; a suite of amines; and two organic acids, malonic and oxalic acid. The non-reactive organic input will be our ELVOC concentration estimate from the MEGAN monoterpene emissions. ELVOCs consist of a large range of high-molecular-weight compounds with currently unknown structures (Ehn et al., 2014). We assume that our representative ELVOC is one of the dominant ELVOC monomer peaks seen in the mass spectra measured by Ehn et al. (2014), C10H16O9, molecular weight
and 3 OH groups. (Chemical structure is required for the UNIFAC activity coefficient calcu-lations in E-AIM in MABNAG.) However, as the vapor pressure of this ELVOC is extremely low (assumed to be 10−14 atm), simulations are generally insensitive to ELVOC chemical
structure. No direct measurements have been made for the saturation vapor pressure of ELVOCs; we assume a saturation vapor pressure of 1·10−14 atm (corresponding to a
satu-ration concentsatu-ration (C*) of 1.2·10−4 µg m−3 at 283 K). This vapor pressure is low enough
that uptake of ELVOCs is essentially irreversible, even at the smallest simulated particle sizes.
Table 2.1. Gas-phase concentration and temperature inputs to MABNAG for each day.
Day T RH Sulfuric Organic Acid: Ammonia Amine: ELVOC
[C] (%) Acid mal+ox/ [cm−3] Light/ [cm−3]
[cm−3] mal+10ox/ Total mal+100ox [cm−3] [cm−3] 4/19/13 11.6 32 2.4·106 1.17·107 / 2.98·1010 2.91·109 / 1.22·107 2.17·107 / 4.8·1010 1.10·108 5/9/13 12.7 69 1.97·107 7.15·107 / 8.94·109 1.01·109 / 4.3·106 1.49·108 / 2.41·1010 9.11·108 5/11/13 6.4 36 5.3·106 2.66·107 / 1.11·1010 1.54·109 / 4.1·106 6.43·10107 / 1.85·101010 4.14·10108
MABNAG currently simulates one amine and one organic acid, so we ran a suite of sensitivity cases to assess the range of atmospheric acid and base conditions that could help explain observed particle growth. For the amine input, we tested the chemical properties
Table 2.2. Chemical properties for each species input in MABNAG.
Species Molar pKa pKa Vapor Henry’s Law Diffusion
Mass 1 2 Pressure Constant Coefficient
[g of pure [mol kg−1 [m2 s−1]
mol−1] compound atm −1]
(µg m−3)
Sulfuric acid 98.1 -3 1.99 0 n/a 9.4·10−6
Malonic acid 104.1 2.85 5.7 4·10−5 (1.8·10−5) n/a 8.4·10−6a
Oxalic acid 90.03 1.46 4.4 4·10−3 (1.5·10−3) n/a 8.4·10−6b
Ammonia 17.03 9.25 n/a n/a 60.7c n/a
DMA 45.1 10.7 n/a n/a 31.41d n/a
TMA 59.1 9.8 n/a n/a 9.6d n/a
ELVOCe 280 n/a n/a 1·10−9 (1.2·10−3) n/a 5·10−6 aCalculated using the Fuller et al., method (Eq. 11-4.4 in Poling et al., 2014) bAssumed to be the same as malonic acid
cHaar and Gallagher, 1978
dhttp://webbook.nist.gov/chemistry/ eAssumed properties of the ELVOC species
of two amines with single amino groups: dimethylamine (DMA) or trimethylamine (TMA). We denote these cases as DMA and TMA. The pKas of these species are 10.7 (DMA) to 9.8 (TMA), so amines within this pKa range are represented in our sensitivity studies. We tested the sensitivity to the amine concentration input by using the sum of the light amines only (methylamine, DMA, and TMA only; denoted as Lam) or the sum of all the amines measured (including the C4-C7 amines but excluding the diamines; denoted as Tam) as the input. For the L cases, we used the chemical properties of DMA or TMA (denoted DMA Lam and TMA Lam, respectively). We assumed the larger amines, which made up over 50% of the total amines (by mass), have a lower pKa than the light amines, and therefore use properties similar to that of TMA for the Tam cases (denoted TMA Tam). This prevents the over-estimation of the potential contribution of large amines due to salt formation. The assumption that all larger amines behave similarly with low pKas is likely
true for alkylamines with a single amino group but does not apply for diamines. Future studies need to examine how diamines react with acids (e.g. dicarboxylic acids to form nylons) and contribute to nanoparticle growth. Regardless, the range of amine pKas and concentrations examined here illustrate the sensitivity of particles to various parameters. For the organic-acid input, we tested using the chemical properties of oxalic or malonic acid, as these were the organic-acid species measured at SGP. These cases are denoted as OX or MAL. We acknowledge that there is a large range of organic acids in the atmosphere, and other monocarboxylic and dicarboxylic acids have been measured in ambient particles (e.g. Rogge et al., 1993; Sempere et al., 1994; Khwaja et al. 1995; Kawamura et al., 1996; Limbeck and Puxbaum, 1999). However, aerosol data from urban, rural, and remote regions has shown that malonic acid tends to be among the dominant organic-acid species in the particle phase, with oxalic acid as the dominant organic-acid aerosol species at all measurement locations (e.g. Grosjean, 1978; Kawamura and Ikushima, 1993; Rogge et al., 1993; Sempere et al., 1994; Kawamura et al., 1995; Khwaja et al.,1995; Kawamura et al., 1996; Kawamura and Sakaguchi, 1999; Limbeck and Puxbaum et al., 1999; Kerminen et al., 2000; Narukawa et al., 2002; Mochida et al., 2003; Sempere and Kawamura, 2003). Thus, we estimate that the contribution of organic acids predicted by MABNAG represents a lower bound of the total contribution of organic acids to particle growth but might be a reasonable estimate.
There is uncertainty in the saturation vapor pressures of organic acids. A review of dicarboxylic acids and complex mixtures compiled by Bilde et al. (2015) shows the best fit saturation vapor pressure of the subcooled liquid states of malonic and oxalic acid as functions of temperature (Figures 7 and 8 of the review). As there are variations between different reported measurements at the same temperature, we have selected to use the satura-tion vapor pressure values for the subcooled liquid states of oxalic and malonic acid obtained
from the best-fit functions in Bilde et al. (2015). Additionally, we include a sensitivity case of reducing the saturation vapor pressures by one order of magnitude below the values shown in Table 2.2. This reduction is within the range of uncertainty in Bilde et al. (2015). We denote simulations using the properties of oxalic acid with the saturation vapor pressure re-duced by one order of magnitude as OX LoVP; we use similar notation for the malonic-acid cases ( MAL LoVP).
We further performed sensitivity studies for the concentration of oxalic acid. Due to the uncertainty in the acid detection efficiency from the Cluster CIMS, the real oxalic-acid concentration could be up to 100x the reported concentration (Figures 3.1, 3.3, and 3.5, panel a). Thus, we ran three sets of concentration input tests: the sum of the reported malonic and oxalic acids (denoted as 1ox) , the sum of the reported malonic and 10x the oxalic-acid concentration (denoted as 10ox), and the sum of the reported malonic and 100x the oxalic-acid concentrations (denoted as 100ox). Note that since our simulations include the sum of the oxalic-acid and malonic-acid concentrations, the scaling of the oxalic-acid concentrations implicitly also allows for testing uncertainties in malonic-acid uncertainties, although we believe these to be smaller (Eisele and Tanner, 1993). Thus, we tested three dimensions of sensitivities for the organic-acid inputs: pKa, vapor pressure, and organic-acid concentrations.
In total, there are 36 sensitivity cases for each day (Figures 3.1-3.6). We present the case MAL/10ox/DMA Lam as the base case for each day, to which other cases will be compared to (Figures 3.1, 3.3, and 3.5, e-f). The choice of this case is somewhat arbitrary, but it generally gives intermediate results relative to other simulations, as will be shown later. For each case, we set MABNAG to run until the particle reaches 40 nm in diameter or, if
the mean particle growth rate is below 3.3 nm hr−1, the model will stop after 12 hours of
simulated time.
2.4. Growth rate calculations
2.4.1. Observed growth rate (SMPS). We have calculated the observed growth rates from the SMPS data (Figure 2.1, a-c). This size range is used since we constrain our analysis of particle composition to the TDCIMS data. During the NPFS campaign, the TDCIMS was set to measure at 40 nm mode diameter when new- particle formation events were not ongoing. Then, when the onset of a new-particle formation event was detected, the TDCIMS was set to measure smaller particle sizes, around 20 nm mode diameter, in order to determine what species were in the freshly growing particles. Thus, our growth rate calculations represent the size range that the TDCIMS measured in during the events of our analysis.
The plots for May 9 and May 11 indicate that there could be two separate nucleation events, whereas April 19 shows one event. Similarly to May 9 and May 11, the SMPS data for May 12 (Figure 2.1, c) shows what appears to be two nucleation events occurring at the surface where the SMPS collected size distributions. Tethered-balloon flight profiles for May 12 indicate that nucleation potentially occurred aloft. hese observations will be described in detail in a manuscript currently in preparation but are briefly described here: The balloon payload consisted of two portable condensation particle counters (model 3007, TSI, Inc.) operating at different minimum size-cut points, which allowed the vertically-resolved measurement of 10 to 20 nm diameter particle number concentrations, N10−20nm. On May 12, high concentrations of particles in this size range were detected at 600 m above ground level, exactly coincident with, or slightly prior to, ground-level observations of
high concentrations of N10−20nm. We hypothesize the following explanation for the double nucleation events observed on May 9, 11, and 12: Nucleation and growth begins to occur aloft in the residual layer. Once the mixed-layer depth grows into the residual layer, these new particles (that may have already grown to ∼10 nm) then mix down and are measured at the surface. This hypothesis is supported by the presence of a high concentration of larger particles (Dp = 10-30 nm) that have already undergone growth at the beginning of the first
event as measured by the SMPS on May 9 and May 11. Then, the second event, which presumably begins near the surface, shows a high concentration of freshly growing particles (3-5 nm, close to the limit of the SMPS detection) before larger particles appear.
As a result, we decided to calculate the growth rate based only on the second growth event for May 9 and May 11, as the second growth events are likely more representative of our ground-based measurements. There is considerable noise in the SMPS data (Figure 2.1, a-c), especially for May 9 and May 11, due possibly to the hypothesized mixing down of particles and possible inhomogeneities in the air mass. For this reason, we have calculated the growth rate between 10-20 nm for each using three different methods. The first method, referred to here as the leading-edge method, is adapted from Lehtipalo et al. (2014) and finds the time at which the binned aerosol distribution between 10-20 nm reaches one half of its maximum dN/dlogDp for each bin. A linear fit between the bins median diameter and
the associated time determines the growth rate. The second method, referred to here as the Dp-mode method, tracks the change in diameter of the maximum dN/dlogDp of the aerosol
size distribution between 10-20 nm; a linear fit between the diameters and time determines the growth rate. When plotted against the size distribution (see Appendix B, Figures B.1 - B.3), it is seen that the leading-edge and Dp-mode method both do not always track the growing size distribution well. For this reason, we have included a third method, which we
call the visual method, in which we have made a linear growth rate between 10-20 nm for each day based upon visual inspection of the size distribution (see Appendix B, Figures B.1 - B.3), using Eq. (3): GRobs = dDp dt ≈ ∆Dp ∆t (3)
This method yields a range of growth rates (Table 2.3) for the particles between 10-20 nm; the specific results for each day will be discussed in Chapter 3. We do not attempt to provide uncertainty estimates for each method, due to the overall noise in the data. Instead, we present the ranges of calculated growth rates as a possible range of the actual growth rates. May 9 and May 11 tend to have higher growth rates: this could be from the influence of the continued mixing down from nucleation aloft and not actually representative of the growth rates of the particles forming near the surface.
Table 2.3. Observed growth-rate ranges between 10 and 20 nm for each day.
Day Leading Edge Dp-mode Visual
method method method
[nm hr−1] [nm hr−1] [nm hr−1]
April 19 8.8 1.6 3.3
May 9 11.3 2.4 5.0
May 11 7.5 5.6 8.3
2.4.2. MABNAG growth rate. MABNAG provides the wet diameter as a function of time: we calculated the rate of change of these diameters using Eq. (3) to get the modelled growth rate. Growth rates in MABNAG generally increase with size due to the reduction
of the Kelvin effect with size (gas-phase concentrations are held fixed). The growth rates generally do not change much at diameters larger than 10 nm, so we provide the average growth rate between diameters of 10-20 nm, the same range used to determine the observed growth rates.
2.5. HYSPLIT back trajectories
In order to assess the influence of air mass source upon each event, the NOAA HYbrid Single-Particle Lagrangian Integrated Trajectory (HYSPLIT) model (Draxler and Rolph, 2012; Rolph, 2012) with NAM meteorological data was used to obtain 48-hour air mass back trajectories (Figure 2.1d-f). The model was initialized at ∼250 m above ground level (AGL) at the time of the observed NPF onset for each trajectory; a total of 24 trajectories were output for each event day using the HYSPLIT ensemble feature that perturbs the start height by small increments vertically and horizontally.
CHAPTER 3
Results
3.1. April 19: Growth by primarily organics
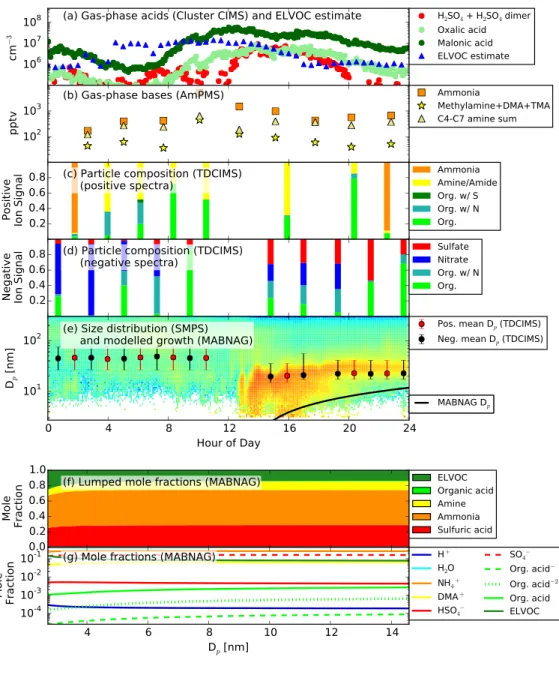
On April 19, 2013, a NPF event was recorded by the SMPS beginning around 12:00 Cen-tral Daylight Time (CDT) (Figure 2.1a); the three growth rate methods provided a possible growth rate range of 1.6- 8.8 nm hr-1 (Table 2.3). The gas-phase concentrations of each measured species, averaged through this 10-20 nm diameter growth period, are presented in Table 2.1, and the timeseries of these observations in Figure 3.1a-b. Note that oxalic acid was not measured by the Cluster CIMS for this day. The ratio of measured oxalic-acid con-centration to measured malonic-acid concon-centration was approximately 0.1 throughout the campaign when oxalic acid data were available; thus, we assume that a baseline concentra-tion of oxalic acid was present at 0.1 times the measured concentraconcentra-tion of malonic acid for this day. Some notable features of the gas-phase data for April 19 (Figure 3.1a-b) include rel-atively low sulfuric-acid concentrations (∼2·106
cm−3), which should only contribute growth
rates of about 0.08 nm hr−1 (assuming kinetic regime growth, an accommodation coefficient
of 1, and a temperature of 283 K), about 10% of the observed rates. Conversely, the con-centrations of ammonia and amines are sufficiently high (100-1000 pptv) that they could play a role in sulfuric-acid neutralization and organic-salt formation. The TDCIMS particle-phase ion-fraction data (Figure 3.1c-d) shows primarily organics with some amines present in the particle phase, indicating that growth by acid-base reactions of organic acids and amines and/or irreversible condensation of ELVOCs is possible. As mentioned previously, we currently have no unequivocal way to distinguish between organic acids and ELVOCs or higher-volatility non-reactive organics in the TDCIMS. The organics categories presented
(organics, organics with S, and organics with N) should be taken as the sum total of organics (excluding amines) detected by the TDCIMS. The TDCIMS also shows a presence of nitrate (the nitrate (ox/inorg) category) later on in the growth event. We do not expect to see significant inorganic nitric acid in the growing of sub-50 nm particles, as ammonium nitrate tends to undergo equilibrium-limited growth in submicron particles and partition propor-tionally to the particle mass distribution (Zhang et al., 2012b). The possibility that much of the observed ox/inorg nitrate signal arises from decomposition or ion-molecule reactions of organic nitrates cannot be excluded. Furthermore, the TDCIMS shows heightened sensi-tivity to inorganic nitrate with respect to sulfate (Smith et al., 2004; Lawler et al., 2014). Due to all of these uncertainties, we hesitate to attribute significant growth from inorganic nitrate.
The 48-hour HYSPLIT trajectory for April 19 (Figure 2.1d) shows the flow coming from the northwest. The predicted trajectories appear to be subsiding from the free troposphere over the time period and thus likely only experience surface emissions during the last 18 hours before passing through the Central Facility at Lamont, OK. The surface emissions would likely be coming from central/western Kansas, through primarily agricultural regions and no major urban areas, consistent with the low sulfuric acid concentrations. Based on these back trajectories, we hypothesize that the air mass obtained biogenic SOA precursors from the region north of the SGP site as well as high levels of gas-phase bases due to emissions from agricultural practices.
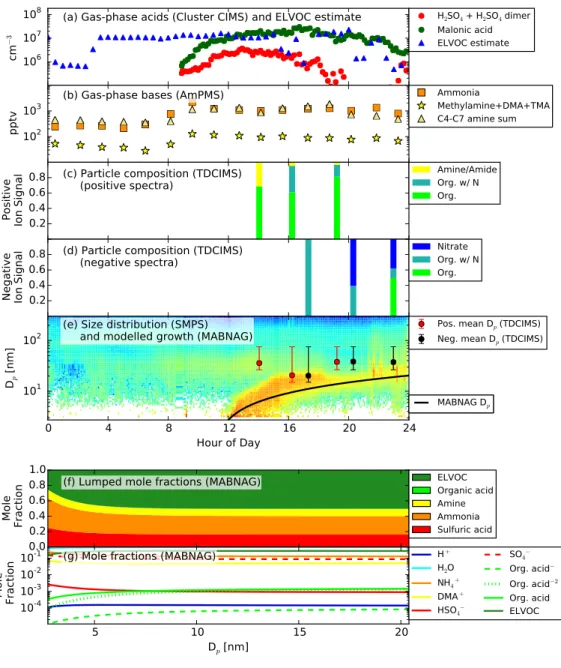
The MABNAG simulations for this day are able to corroborate the predominance of organics in the particle phase. Our base simulation, MAL/10ox/DMA Lam (Figure 3.1e-g; Figure 3.2) predicts a growth rate of 1.4 nm hr-1 with 16% mole fraction from sulfuric acid; <<1% from organic acid, 24% from ammonia; 9.1% from amines; and 50% from ELVOCs.
Figure 3.1. Measurements and MABNAG predictions for the base-case sim-ulation, MAL/10ox/DMA L, for April 19, 2013. (a) Gas-phase acids and ELVOC estimate. Oxalic acid was not measured for this day; the cluster CIMS was not operational before 9:00 CDT for this day. (b) Gas phase bases. (c)-(d) Particle-phase data. The TDCIMS was not operational before 14:00 CDT (e) Size distribution from the three merged SMPSs with the modeled growth rate (black line). Overlaid is the mean collection diameter from the TDCIMS for the positive (red points) and negative (black points) signals . (f)-(g) Modelled particle composition as a function of size. (f) shows the lumped mole fractions (excluding water) of each species, including any dissociation products. (g) shows the individual mole fractions of each species and its dis-sociation products. NH3 and DMA are not shown as both species dissociate
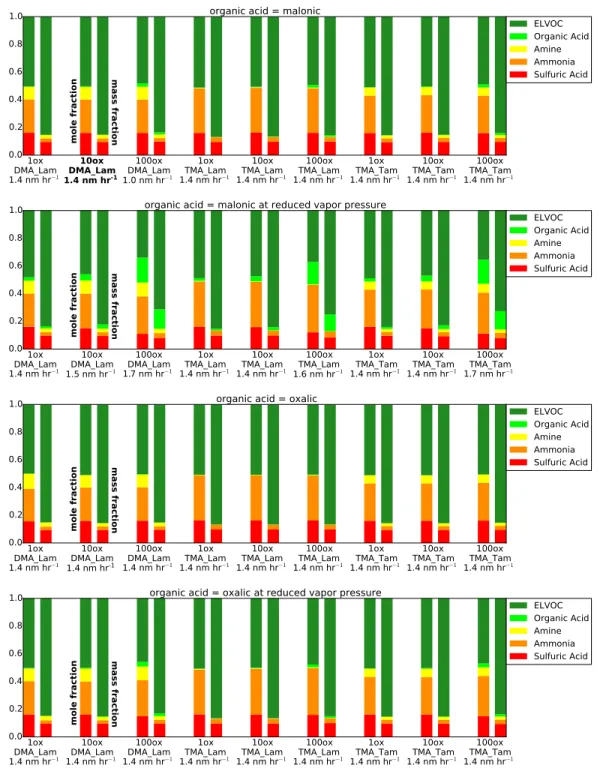
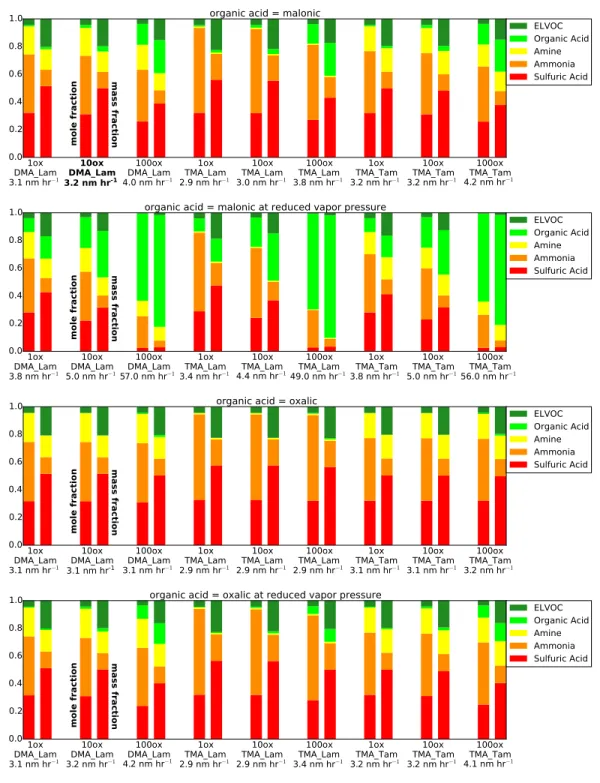
Figure 3.2. The final dry particle composition for each sensitivity case for April 19, 2013, as both lumped mole fraction (left-hand bars) and lumped mass fraction (right-hand bars). Refer to Section 2.3.1 for an explanation of each case label. The bottom row of each case label shows the growth rate for that case in nm hr−1. The bolded case label (first row, second case) represent
Figure 3 shows the final dry particle compositions by mole fraction (left-hand bars) and mass fraction (right-hand bars) across our sensitivity cases. Details of MABNAG-predicted ion concentrations are given in Appendix D, Table D1. Across our sensitivity cases (Figure 3.2), MABNAG shows negligible (<5%) amounts of organic acid in the particle phase, except for MAL LoVP/100ox cases (an upper bound for organic-acid uptake due to lowered vapor pressure and increased gas-phase concentration), which show up to 18% of the particle was composed of organic acid. Malonic acid has a lower vapor pressure than oxalic acid, and thus more malonic acid is able to enter the particle-phase than oxalic acid. The ELVOC mole fraction tends to be around 50% for most cases, with a smaller (around 35%) mole fraction predicted for the high organic-acid cases. Since we do not know the actual contributions to growth from ELVOCs (or higher-volatility non-reactive organics) versus organic acids from the TDCIMS data, we cannot determine the accuracy of these individual species predictions. However, as the TDCIMS shows very small particle-phase contributions from bases even though high gas-phase base concentrations were also observed, this corroborates that the growth may be dominated by non-reactive organics. We see that MABNAG predicts that approximately 16% of the particle is composed of sulfuric acid by mole (with associated ammonia). No sulfuric acid appears directly in the TDCIMS ion spectra: thus, MABNAG appears to overpredict the contribution of sulfuric acid (and associated ammonia) for this day relative to the TDCIMS ion fractions. However, since sulfuric-acid vapor concentrations were non-zero, we expect some sulfuric acid in the particle phase. The most likely reason for the discrepancy is low signal-to-noise in the TDCIMS during this period, resulting from low collected particle mass. The TDCIMS data shows some amine/amides in the particle phase: the most amine was predicted with DMA Lam cases (9-11% by mole) and this compares most closely to the TDCIMS ion fractions of the amine particle-phase predictions. All TMA Lam
cases predict less than 1% amines by moles in the particle phase and thus likely are not realistic inputs for this day. The majority of our simulations predict that less than 1% of the particle is organic acid by mole; thus, the contribution to particle growth from organic salt formation would be negligible, even when including the contribution from associated bases. Thus, we expect the majority of growth from organics to be coming from non-reactive organics (ELVOCs in our simulations) for this day.
The modelled growth rate is around 1.4 nm hr−1for most cases with a few cases (MAL LoVP/
100ox cases) reaching up to 1.7 nm hr−1. When we compare the modelled growth rates to
our three growth rate methods that attempt to capture the observed growth rates, we see that the leading-edge method gave the highest growth rate estimate at 8.8 nm hr−1 and the
Dp-mode method gave the lowest estimate, at 1.6 nm hr−1. However, a visual inspection
of the best-fit lines of these two methods (Figure S1) shows that the leading-edge method appears to overpredict the growth rate (the slope of the best fit line is the growth rate in nm hr−1). The D
p-mode method could be slightly underpredicted the growth rate, but is
not an unreasonable estimate. The visual method predicts a rate of 3.3 nm hr−1. Therefore,
we are more inclined to believe that the growth lies between these two latter estimates, e.g. 1.6-3.3 nm hr−1. Thus, all MABNAG cases come close to or slightly underpredict the
observed growth rates. We do note that the organics with N and N (ox/inorg) ion cate-gories dominate the overall TDCIMS spectrum; as MABNAG currently does not account for nitrogen-containing species beyond ammonia and amines, this could account for some of the potential discrepancies in the particle growth rate and composition between model and observations. As organics are a very important part of this days particle growth, our results are sensitive to our precursor and yield assumptions of ELVOCs, and for this day where ELVOCs dominated growth, a 50% uncertainty in ELVOC yield would correspond to
close to a 50% uncertainty in growth rate (ELVOCs dominate the simulated volume frac-tion). Having more-direct measurements of VOCs and associated ELVOC yields will better constrain the ELVOC budget. However, even a 50% underprediction of the contribution from ELVOCs to growth would lead to a maximum growth rate of 2.1 nm hr-1, which is on the low end of the growth-rate range that we have calculated from the measurements. Thus, our low bias in growth rate for this day may not be from the ELVOC concentration uncertainties alone. Our lack of LVOCs, SVOCs, and accretion reactions from SVOCs likely also contribute to our potential underprediction, as these species will contribute more with increasing particle size.
Overall, the observations from April 19 clearly show that organic species contribute heav-ily to growth: the MABNAG results corroborate this, and further the MABNAG simulations show that ELVOCs dominate over organic acids for all sensitivity cases. As the TDCIMS shows small amounts of particle-phase ions from bases even though high gas-phase base concentrations were also observed, this corroborates that the growth may be dominated by non-reactive organics. Furthermore, as ELVOCs are larger molecules than the other species considered here, their contributions to growth rates are even larger than their contribution to mole or ion fractions. Finally, we hypothesize that LVOCs, and perhaps SVOCs or accretion reactions, are contributing to growth within the 10-20 nm diameter range, as MABNAG underestimates growth without these species/reactions.
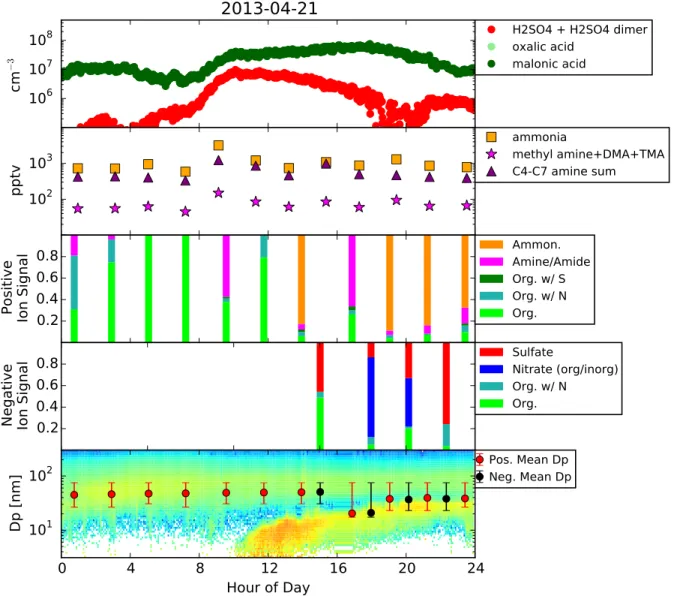
3.2. May 9: Growth by primarily sulfuric acid and ammonia
On May 9, 2013 (Figure 3.3), two growth events were observed; we focus our analysis on the second event, which began around 13:00 CDT. The SMPSs and Cluster CIMS both experienced instrument failure from 17:30 CDT onwards on this day; the Cluster CIMS
was also not operational before 12:00 CDT. However, the two instruments captured enough of the event to inform our analysis and provide modelling inputs. By 17:30, the three growth rate methods provide a possible growth rate range of 2.4-11.3 nm hr−1. The Cluster
CIMS measured high sulfuric acid for this day (∼2·107
cm−3), sufficiently high for sulfuric
acid to contribute significantly to condensational growth. The ammonia concentrations are somewhat higher than the amine concentrations. The TDCIMS shows a high amount of ammonia and sulfate, indicating the presence of ammonium sulfate contributing strongly to the growth of the particles. A small, but non-trivial amount of organics and amines are seen in the particle phase as well.
The HYSPLIT back trajectory for May 9 (Figure 2.1e) shows flow from the south, through much of central/east central Texas. The predicted trajectories are entirely in the boundary layer, allowing for the possibility of the air mass experiencing surface emissions throughout the entire previous 48 hours. Many of the possible trajectories pass over or near the major metropolitan Dallas/Fort Worth region and extend into the industrial gulf-coast region; some of the trajectories extend towards the major metropolitan region of Houston. Both possible trajectory paths could contribute SO2 emissions to the air mass. Local agricultural
practices could have contributed ammonia and amines to the air mass, explaining the high base concentrations present at the SGP site.
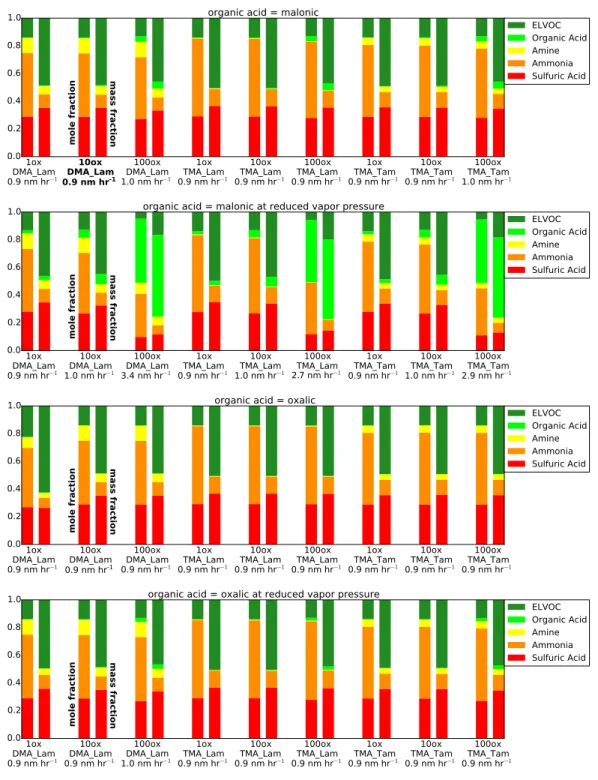
The MABNAG simulations for this day are able to capture ammonium-sulfate formation as the dominant growth pathway. Our base simulation, MAL/10ox/DMA Lam, (Figure 3.3 e-g; Figure 3.3) predicts a growth rate of 3.2 nm hr−1 with 31% of the particle composition
by moles from sulfuric acid; 2.2% from organic acid; 42% from ammonia; 20% from amines; and 4.3% from ELVOCs. Most sensitivity cases (Figure 3.4) predict approximately 60-90% of the particle is composed of sulfuric acid and ammonia by mole fraction. Only the
Figure 3.3. Measurements and MABNAG predictions for the base-case simu-lation, MAL/10ox/DMA L, for May 9, 2013. (a) Gas-phase acids and ELVOC estimate. The Cluster CIMS was not operational between 17:30-23:00 CDT for this day. (b) Gas phase bases. The AmPMS was not operational between 2:00-6:00 CDT for this day.(c)-(d) Particle-phase data. The TDCIMS was not operational before 9:00 CDT for this day. (e) Size distribution from the three merged SMPSs with the modeled growth rate (black line). Overlaid is the mean collection diameter from the TDCIMS for the positive (red points) and negative (black points) signals. The SMPSs were not operational after 17:30 CDT for this day. (f)-(g) Modelled particle composition as a function of size. (f) shows the lumped mole fractions (excluding water) of each species, includ-ing any dissociation products. (g) shows the individual mole fractions of each species and its dissociation products.
Figure 3.4. The final dry particle composition for each sensitivity case for May 9, 2013, as both lumped mole fraction (left-hand bars) and lumped mass fraction (right-hand bars). Refer to Section 2.3.1 for an explanation of each case label. The bottom row of each case label shows the growth rate for that case in nm hr−1. The bolded case label (first row, second case) represent our