N
m
O')
FlLD
N
N
x
0
>:..
Hh
35 U)*"
nicalpmpertiesofbitumen .
roadba
sf
f
-Paperpresented at the 4th International Rilem
SymposmmMTBM Lyon France May1997
Safwat . sa,-d ,. *
SvanteJohanssonSwedish National Road Administration
1000
_ SMA 25
_ AG25
Init ia l st ra in , ue 1001 E+4 1 E+5 1 E+6
No. of applications
Swedish National Road and
VT
I
sä
rt
ry
ck
27
5
-1
99
7
Mechanical properties of bitumen
roadbase mixes
*
Paper presented at the 4th International Rilem
Symposium-MTBM, Lyon, France, May 1997
Safwat E Said, VTI
Svante Johansson, Swedish National Road Administration
4th International Rilem Symposium-MTBM, Lyon, France, May 1997 Mechanical properties of bitumen roadbase mixes
S.F.Said
Swedish Road and Transport Research Institute (VTI), Linköping, Sweden
S.Johansson
Swedish National Road Administration (SNRA), Borlänge, Sweden
ABSTRACT: Recently alternative mixes have been marketed for roadbase layers. In order to study the performance of these layers, eight test sections each having a length of 200 meters have been built into a newly constructed road. The test results presented here are focused on the stiffness and fatigue properties of a large aggregate bituminous mix, and a conventional roadbase mix consisting of a bituminous gravel (AG 25) as a reference mix. Experiments in the laboratory and in a Circular Test Track constitute the first part of this work. Stiffness and fatigue properties of cores drilled from the circular test sections have been determined in the laboratory using Indirect Tensile Test. Both the test track and laboratory tests are carried out at a temperature of 10°C. The laboratory results of the tests on the mixes are compared with the results obtained from the Test
Track.
l INTRODUCTION
The increase in traffic volume, loads and tyre pressure has led to the need for road structures and materials to withstand the heavy loads and provide
additional stability and durability. Recently
alternative mixes have been deveIOped for roadbase layers. In order to examine the performance of these mixes, eight test sections have been built into a newly constructed road. These sections are located on highway E18 between Köping and Arboga in the middle of Sweden. Each section has a length of 200 meters. All eight test sections have similar structures with the exception of the roadbase layers. Two of the test sections were built with a conventional bituminous gravel mix type AG 25 as a reference sections. Two of the sections consist of a modified stone mastic asphalt denoted SMA 25 and used as a large aggregate roadbase mix. The maximum aggregate size is 25 mm. Two of the sections were
built with grouted macadam (IM 100) and two
sections with a stone rich mix, which is a modified AG 25.
In addition to the road sections, similar structures
were tested in a Circular Test Track (CTT) at Neste
in Finland. Due to the lack of space only three of the roadbase mixes were tested viz. AG 25, SMA 25 and
[M 100. Experiments in the laboratory constitute the first part of this investigation. In this paper the stiffness and fatigue properties of specimens from CTT-pavements using Indirect Tensile Test (ITT) are compared to the results obtained from the test track.
2 EXPERIMENTAL DESIGN
2.1 Materials
The bituminous materials used in the test pavements of the CTT were delivered from Sweden. They were from the same materials as used in the road sections. The reference roadbase layer consisted of a typical roadbase mix type AG 25 (Swedish specifications
1984). It contains a binder type of the B180 (pen 180) with a content of 4.2 percent by weight and a void ratio of 6 percent on average. The maximum aggregate size is 25 mm.
The modified stone mastic asphalt (SMA 25) with a maximum aggregate size of 25 mm and a high void ratio between 15 to 20 percent.This mix is produced by the NCC company and it is a part of the development of a mix marketed under the name of Viacobase.
The grouted macadam (IM 100) with an aggregate size of 32 63 mm. After sealing it is coated with an
open graded asphalt concrete with a maximum aggregate size of 8mm.
2.2 Circular Test Track (CTT)
The test track of Neste Oy, Finland has been used for accelerated testing (Figure 1). The size of the con
struction is 2 x 2 metres (width x depth). The
dia-meter of the track is 3.7 metres. The construction of pavements, installation of load cells and strain gages and the follow-up of the deterioration of the test pavements have been done and reported by Neste Oy
and VTT (Technical Research Centre of Finland) (Pienim'aki and Pihlajam'aki, 1995). The bitumen
bounded layers were compacted by a 400 kg vibrator plate which may not be enough specially for the compaction of the SMA mix. The compaction in the CTT will be compared later with the compaction of the road sections in-situ.
Figure 1. The Circular Test Track of Neste (CTT).
The tests were run under the following conditions: ' test temperature 10°C
0 speed 20 km/h
0 single wheel load 40 kN . tyre in ation pressure 800 kPa 0 watertable level 1 .2 m
Before the start of the test track, the effect of test
variables was examined in zero measurement.
Figure 2 shows the average of initial transversal strains at the bottom of bituminous layers at a temperature of 10°C. 400 SMA _..-* """" * ä 300 ' . A_______ Å" ' E.":$ A'. ' AG n &; 200 ~~ = : (A I E% E 100 O ( l i % f j 25 30 35 40 45 50 55 Wheel load, kN
Figure 2. Strains in bituminous layers versus wheel load (Pienim aki and Pihlajamaki 1995).
The SMA section shows a greater strain than the reference section under the same test conditions.
Therefore, the SMA-structure should be weaker than
the AG structure.
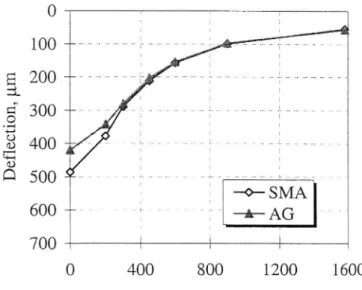
A FWD has been used for measurement of the deflection. It has a load of 50 kN with a loading plate of 300 mm in diameter. It has only two accelero meters, one in the centre of the loading and the other is movable to a desirable distance from the loading plate. The FWD-measurements have been repeated in order to find out the deflection basin. Figure 3 shows the deflection basins of the zero measurements at a temperature of 11°C. The FWD results indicate that there are only differences between the upper parts of the pavements. The differences in deflections are getting smaller as the distance is increased from the loading centre. In other words, there are no differences between the structures beneath the roadbase layers which was expected as those were equal for the two constructions.
E j.
g.
.9 23£9.
LH CD ; + SMA 600 . : " we AG700
l
0 400 800 1200 1600Distance from load, mm
The SMA structure has shown greater strain and
deflection than the reference (AG) structure, which means that the reference section is stronger than the section with the SMA layer against traffic loading.
The conclusion of the authors (Pienm'aki and
Pihljamäki 1995) after almost 6 million wheel load applications confirms the prediction done by the ana-lysis of initial measurements.
2.3 Indirect Tensile Test (ITT)
The ITT has been used for evaluating the resilient modulus and fatigue properties of basecourse layers. This method has been chosen due to its convenience for routine measurements. The VTls Material Testing
System (VMS) is a servohydraulic system with
closed-loop control from the MTS corporation. The loading device for ITT with a couple of extenso meters mounted on the specimen is shown in Figure
Figure 4. Specimen with extensometers in the loading device for indirect tensile test (ITT).
2.4 Resilient modulus
The resilient moduli were measured on cored speci mens from the bituminous basecourses of the CTT sections. The number of specimens were seven cores per section and they were tested at a temperature of
10°C according to Swedish standard (FAS 454). The
average of the resilient moduli for the reference sec
tion (AG 25) and the SMA 25 section are 4300 MPa
and 2400 MPa, respectively. The moduli are low for both mixes. The resilient modulus for the cores from basecourse layer of type AG 25 mix is normally
about 8000 MPa at 100C (Said 1996). The cause of
low moduli could be due to the difficulties of compaction in the CTT.
The comparison between the test sections in respect to their moduli confirms the conclusions from
the initial measurements of the test track that the
structure with the SMA basecourse layer is weaker than the structure with the conventional basecourse layer.
2.5 Fatigue strength
Fatigue tests were performed on the cored specimens from test sections of the CTT, which had been used for the resilient modulus measurements. The ITT had been used for measuring the fatigue resistance of roadbase layers.
Constant stress mode was conducted on cylindri cal specimens with 100 mm in diameter. They were subjected to a periodically repeated load with 0.1 sec. loading time and 1.4 sec. unloading time. The fatigue life is defined as the total number of applications that cause a fracture of the specimen. The strain at the centre of the specimen is calculated from the total horizontal deformation, which is the maximum deformation under the loading period.
1000 ..; igs :? ;;; 1; . ' ' i: (_l:) '. i; | AG 25 f 5 "2:21; ::; i- _ _
5
;; 100 ';';»; 335. 555255 zsgss 35 ':'£ å'f: {sfsf- jsf ifs-ssff j _ gj; få ' n=2,58 __ _.%
k=1 ,1 65 iii : :: iii: ::iéijj fii 2:31? iii? åii ii it ?; fifi? iii ?; it:? äl?
**
10
R2=o,95 i: ' : - w
; i;i;5;;: '1 E+4 1 E+5 1 E+6 1 E+7
No. of applications
a
' '" "
.aazä-"ffaezälSMA ZSlf-g
afå
k=1,3E11
__
'_' R2=0,93 j ; ; 100 ' ' :1E+4 1E+5 1E+6
No. of applications
N _ k (l)
f _ eFigure 5. Relationships between tensile strain VS no. of load applications for reference mix AG 25 and SMA 25 at 10°C.
Fatigue results of the roadbase layers AG 25 and
SMA 25 with their regression coefficients are shown
in Figure 5.
It is obvious that the SMA-layer should have a longer fatigue life than the AG-layer if they are subjected to the same strain level which is not the case in practice due to the difference in their stiff-nesses.
3 COMPARISON BETWEEN CTT AND ITT
RESULTS
The comparison has been done with respect to tensile strains at the bottom of roadbase layers of the CTT
sections. On the one hand, the tensile strains have
been measured under the wheel passage by strain gages (Figure 2) and on the other calculated from FWD measurements. The following relationship
(Jansson 1994) is used for the calculation of the
strains from deflection measurements:
8 = 37.4 + (988xD0 533xD300 502xD600) / 1000 where
& is the tensile strain at the bottom of a bituminous
layer in 0.8 l 000 0.) :S. a +5; Strain e
i?;
FWD
E Hang e 100 1E+4DO, D300 and D600 are deflections at 0, 300 and
600 mm from the centre of the loading plate.
The deflection basins were measured at only one location per test section. The tensile strains of the AG layer and SMA layer are 220 us and 279 us, res pectively. Consequently the pavement with the SMA layer is weaker than the pavement with the AG layer. This is in agreement with the ranking done from
strain gage measurements (Figure 2).
Fatigue relationships of the roadbase layers pre sented in Figure 5 are redrawn in Figure 6. Fatigue lives of the AG and SMA-layers have been calcula-ted using the regression equations (Figure 5) with respect to the method of finding out the strains. See Table 1.
Table 1. Fatigue life with respect to the method of finding out strains.
AG 25 SMA 25 Strain Nf Strain Nf (HE) (HE) Strain gage 200 134200 300 104800 FWD 220 105000 279 125200 _SMA 25 1E+5 AG25 n=2,58 K=1,16E11 R2:0,95 n=2,46 K= 1 ,3 1E11 R2=0,93 1E+6 No. of applications Figure 6. Comparison between roadbase layers.
The calculated fatigue lives using strains mea-sured by gages show longer fatigue life for the AG layer than the SMA layer. This is in agreement with the conclusion done from the accelerated testing (CTT). However, contradictory results have been found when using strain calculated from FWD de ections. The difference in strain between AG and SMA layers using FWD-measurements is smaller than the difference measured by strain gages. The load of the FWD and the wheel load are 50 kN and 40 kN, respectively. It gives rise to larger strain in the AG-layer yet not in the SMA layer using FWD, see Table 1 and Figure 6. The low resilient modulus of
the SMA (2400 MPa) could have led to incorrect
strains calculated from FWD deflections. It should also be kept in mind that the FWD-measurements have been done only at one location per section, which may not be enough. However, four strain gages were instrumented per section.
As there are no strain gages in the road sections in the field, strains will have to be calculated only from FWD measurements.
4 CONCLUSIONS
The conclusions here are based on the laboratory
tests (Circular Test Track and Indirect Tensile Test).
These results shall be verified through following up the deterioration of the road sections under a five years period.
Due to uncertainty in the strains calculated from
the FWD measurements, the results are analysed in
respect to the strains obtained by strain gages.
l. The conventional mix type AG 25 has shown longer fatigue life and higher stiffness than the tested SMA 25 mix at +100C.
2. The results found by the indirect tensile test are in agreement with the conclusions from the circular test track.
3. The indirect tensile test has shown practical in routine use.
REFERENCES
Pienimäki, M. & Pihlajam aki, J 1995. Fatigue testing in Neste circular test track, Neste Oy Research Report 89/95, Finland.
Said, SF 1996. Fatigue and sti ness properties of roadbase layer using indirect tensile test. The Euroasphalt & Eurobitume Congress, Strassbourg, France.
Jansson, H 1994. A simple structural index based on
FWD measurements. Proceedings of the 4th Int. Conf. on the Bearing Capacity of Roads and