How do persons with brain fatigue after brain injury interact
within a social media community?
Results from a content and social network analysis
Author: Ulrika Hamidi
Degree thesis, 30 CreditsAuthor: Ulrika Hamidi
Main supervisor: PhD. Candidate, Aboozar Eghdam, Department of Learning Informatics, Management and Ethics
Co supervisor: Prof. Sabine Koch, Department of Learning Informatics, Management and Ethics
Examiner: PhD. Maria Hägglund, Department of Learning Informatics, Management and Ethics
2
Affirmation
I hereby affirm that this Master thesis was composed by myself, that the work contained herein is my own except where explicitly stated otherwise in the text. This work has not been submitted for any other degree or professional qualification except as specified; nor has it been published.
Stockholm, 17th of August 2016
__________________________________________________________
3
How do persons with brain fatigue after brain injury interact
within a social media community?
Results from a content and social network analysis
Abstract
Background: Social media has been shown to be a potentially beneficial tool for the
well-being of individuals with chronic medical conditions. However, there is a lack of knowledge on how individuals identified Mild Acquired Cognitive Impairment (MACI) communicate through social media. MACI refers to a non-progressive mild cognitive impairment after an acquired brain injury.
Objective: The objectives of this study were to describe the content and to visualize the
user involvement in a social media community aimed for people with brain fatigue, a common symptom for persons identified with MACI.
Methods: A content- and a social network analysis of the communication of 1092
individuals with brain fatigue, participating in a social media community, were performed. Both quantitative and qualitative methods were used for data analysis.
Results: To acknowledge a “like” was the most common form of the studied
communicative interactions. Social support (especially informational, but also emotional, and esteem support), and socialization in different forms, were common main themes in the posts and comments. A few individuals were found to be very involved while most of the others were poorly involved in the communication. The involvement followed a long tail distribution. The patterns of produced content themes, and the social media communication features used also varied among the members in the group.
Conclusion: This study indicates that a social media group could be a beneficial tool in
MACI rehabilitation, because the participants, in varying ways and degrees, socialized and exchanged social support. Such information exchange has been shown to be beneficial in MACI rehabilitation. The results in this study could, in combination with further studies, be analyzed by relevant domain experts in different fields. This could be one step to fill the gap of knowledge on how individuals with MACI are communicating in social media groups.
Keywords: brain injury, social support, social media, mild acquired cognitive impairment,
4
Acknowledgements
I would especially like to thank my main supervisor PhD candidate Aboozar Eghdam for continuously being very supportive during the whole process. I would also like to thank my co-supervisor Professor Sabine Koch for valuable feedback, and Professor Aniko Bartfai for providing important information and for giving useful comments on this project. I am also very grateful for the support from family and friends.
5
Table of Contents
List of Figures ... 8
List of Tables ... 9
List of Social Network Graphs ... 10
Glossary/List of abbreviations ... 11
1. Introduction ... 12
1.1 Acquired Brain Injuries ... 12
1.2 Cognitive Impairment ... 12
1.2.1 Mild Acquired Cognitive Impairment ... 12
1.2.2 Mental Fatigue / Brain Fatigue ... 13
1.3 MACI Rehabilitation and Peer-to-Peer Social Support ... 13
1.4 Social Media ... 14
1.4.1 Social Media Groups and Chronic Disease Management ... 15
1.5 Social Network Analysis ... 15
1.5.1 Social Network Graphs and Concepts ... 15
1.6 The Problem Definition ... 17
1.7 Aim and Objectives ... 18
1.8 Research Questions ... 18
2. Methods ... 19
2.1 A Social Media Group Related to MACI ... 19
2.2 Data Collection Method ... 19
2.3 Participants / Sampling ... 19
2.4 Data Collection Software ... 20
2. 5 Data Analysis... 20
2.6 Content Analysis ... 21
2.6.1 Familiarization ... 22
2.6.2 Coding with Initial Codes ... 22
2.6.3 Adding Codes ... 23
6
2.6. 5 Calculating Code Frequencies ... 24
2.7 Social Network Analysis ... 24
2.7.1 Social Network Concepts and Graphs ... 26
2.7.2 Software for the Description and Visualization of the Participants´ Interactions ... 28
2.7.3 The ForceAtlas2 Algorithm ... 28
2.7.4 The Construction of Social Network Graphs ... 29
2.8 Research Ethics ... 30
3. Results ... 31
3.1 The Size of the Studied Network ... 31
3.2 Different Kinds of Interactions ... 31
3.3 The Main Themes in the Posts ... 31
3.4 The Main Themes in the Comments... 33
3.5 With How Many, and How Frequently the Participants Communicated ... 34
3.6 Kind of Interactions Performed per Centrality Group ... 36
3.7 The Most Frequent Post Publishers ... 39
3.8 The Most Frequent Commenters ... 42
3.9 The Most Frequent “Likers” ... 44
3.10 Who was Communicating with Whom? ... 44
3.11 The Social Network Graphs ... 44
4. Discussion ... 46
4.1 The Overall Content ... 46
4.2 Central Actors ... 46
4.3 Different Kind of Interactions ... 47
4.4 The Most Frequent Publishers, Commenters and “Likers” ... 47
4.5 Could Social Media be a Supplemental Tool in MACI Rehabilitation? ... 48
4.6 Limitations ... 50
4.6.1 Collecting Data from Facebook Profiles ... 50
4.6.2 Potential Users ... 50
7
4.6.4 Participants Explored at an Individual Level ... 51
4.7 Further Research ... 51
5. Conclusion ... 53
8
List of Figures
Figure 1. A dyad ... 16
Figure 2. Local centrality and weighted local centrality of node A ... 17
Figure 3. The data analysis methods ... 21
Figure 4. The phases of the content analysis ... 22
Figure 5. The design of the social network analysis ... 25
Figure 6. A part of the edge table ... 26
Figure 7. A part of the node table ... 26
Figure 8. The parts of the study that were addressed by the different aspects of the social network analysis ... 27
Figure 9. The frequency of main themes in all the posts, n = 180 ... 32
Figure 10. The frequency of main themes in all the comments, n = 537 ... 34
Figure 11. A graph with the amount of nodes (y-axis) per centrality value (x-axis), n = 1092 ... 35
Figure 12. A graph with the amount of nodes (y-axis) per weighted centrality value (x-axis) , n = 1092 ... 35
Figure 13. The frequency of main themes in the posts by the participants A, B and C, n = 3 ... 40
Figure 14. The frequency of main themes in the comments by the participants D, L M and x, n = 4 ... 44
9
List of Tables
Table 1. The social support codes and definitions [from Cutrona and Suhr (28)] ... 13
Table 2. The additional initial codes and their definitions [defined by Gaysynsky et al. (45)] ... 23
Table 3. The codes derived from the initial code miscellaneous ... 24
Table 4. The size of the network, n = 1092 ... 31
Table 5. The amount of different kinds of interactions, n = 1092 ... 31
Table 6. The frequencies of provided and sought social support in relation to all the posts, n = 180 ... 33
Table 7. The participants grouped after centrality values, the amount of participants per group, and the range of weighted centrality values within these groups, n = 1092 ... 36
Table 8. The frequency of participants per centrality group, who only produced one kind of interaction (posts, comments or “likes”), n = 1091 ... 37
Table 9. The amount of made and received interactions per individual for the participants A-R and x and y, n = 20 ... 38
Table 10. With how many and how frequently each of the very-highly and highly-connected participants, in addition to x and y, exchanged directed interactions, n= 20 ... 38
Table 11. The main themes, or groups of main themes, in posts published by participant A and the received “likes” to those categories, n = 1 ... 41
Table 12. The main themes, or groups of main themes, in posts published by participant B and the received “likes” to those categories, n = 1 ... 41
Table 13. The main themes, or groups of main themes, in posts published by participant C and the received “likes” to those categories, n = 1 ... 41
Table 14. The received “likes” to the main themes, or groups of main themes, in all the posts, n = 180 ... 42
10
List of Social Network Graphs
Graph 1. The whole network, n = 1091 ... 45 Graph 2. Only the A, B, C, D, L, M, x and y nodes, and their mutual
edges, n = 8 ... 45 Graph 3. The portion of the network the A, B, C, D, L, M and the x and y nodes have edges to, are colored red, n = 1091 ... 45 Graph 4. The portion of the network the A, B and C nodes have edges to, are colored red, n = 1091 ... 45 Graph 5. The network exclusive the A, B, C, D, L, M, X and Y nodes and their edge, n = 1083 ... 45 Graph 6. The network exclusive the A, B, and C nodes, n = 1083 ... 45
11
Glossary/List of abbreviations
ABI: Acquired Brain Injury
Centrality: short for local centrality, which represents how many others a participant was
in contact with through comments and "likes" directed to posts.
Directed interactions: the comments and "likes" to posts
Edges: a representation of all the comments on, and "likes" to posts exchanged between
two participants.
Edge weight: the sum of the comments and "likes" per edge Interactions: the comments, the "likes", and the posts Leaf node: a node which only has one edge
"Like": to acknowledge content on the Facebook wall with a thumbs-up symbol.
Lurker: social media users who were following the communication in the group without
themselves adding content.
MACI: Mild Acquired Cognitive Impairment MCI: Mild Cognitive Impairment
Nodes: a representation of the participants´ Facebook profiles in the social network
analysis
Socialization related codes: the codes socialization, banter and non-verbal cues in the
content analysis
TBI: Traumatic Brain Injury
Weighted centrality: the amount of comments and "likes" to posts that a participant was
12
1. Introduction
Social media is a technology which allows users to socialize and exchange information with each other online (1). The growth of social media both affects how people socialize and how information and knowledge in our modern culture are created and distributed (2). Social interactions and information exchange are important parts of the rehabilitation after acquired brain injuries causing decreased cognitive abilities, but only marginally impaired physical functions (3,4). Persons suffering from such conditions have also been shown to be interested in using social media (5).
1.1 Acquired Brain Injuries
Acquired brain injuries (ABIs) are a public health concern demanding therapeutic interventions (6,7). The term ABI can be defined as a traumatic or non-traumatic injury to the brain which occurs after birth. Non-traumatic injuries may be caused by strokes, non-traumatic hemorrhage, tumor, infectious diseases, anoxia, metabolic disorders, or toxic exposure (8). An ABI can be classified as mild, moderate, or severe. The classification can for example be based on the Glasgow Coma Scale score, which is a rapid assessment of the ABI patient´s consciousness and response to stimuli. In Sweden about 70 000 patients per year are diagnosed with an ABI. The ABIs which leave a permanent mark on the patients are mostly caused by stroke (9). About 30 000 patients are diagnosed with stroke in Sweden every year. Over 20 000 patients per year suffer from a Traumatic Brain Injury (TBI) after an head injury (9) and 57 900 patients sought treatment for head injuries at emergency units year 2010 in Sweden (10). In the United States over 1 million TBIs occur per year. A literature review of mild TBI states that mild TBI comprises 70%–80% of all TBIs. The majority of patients who have had a mild TBI recover fully within one year. A nontrivial minority however (1-20%) develop persistent cognitive, emotional, behavioral, and physical impairments (11). In addition to this, there may also be an unreported group of patients suffering from cognitive impairments induced by a mild TBI, or other ABIs, since these symptoms may have an onset a long time after the injury. The cognitive impairment may therefore not be connected to the actual ABI (12).
1.2 Cognitive Impairment
For patients with ABI it is the cognitive impairment rather than the physical disability that often limits community reintegration (13). Cognitive symptoms can even at a mild level disable persons with ABI to return to normal life and work (4).
Mild Cognitive Disorder, often also termed as Mild Cognitive Impairment (MCI), can be defined as: “A disorder characterized by impairment of memory, learning difficulties, and reduced ability to concentrate on a task for more than brief periods” (14,15). Despite varying definitions it is mainly agreed that MCI refers to mild cognitive deficits that are not related to normal aging or dementia (16). The term MCI can be utilized for classifying patients who do not fulfil the criteria to be diagnosed as having, but have a risk of developing, dementia (17). These patients´ cognitive abilities are expected to decline.
1.2.1 Mild Acquired Cognitive Impairment
Mild Acquired Cognitive Impairment (MACI) is a new term to describe a MCI which is non-progressive and acquired from an ABI (18). Patients suffering from MACI in other
13 words have an MCI which is assumed to not decline over time (18). The term ABI can in addition to the description above be defined as a non-degenerative injury (14), but both progressive and non-progressive cognitive impairments can be a sequelae of an ABI (19– 21).
An ABI can be classified after its severity, however the acquired impairments in different areas and the recovery process after a brain injury varies greatly from patient to patient (22). The term MACI is therefore focused on the mild non-progressive cognitive outcome instead of the severity of the ABI. A MACI patient is also assumed to have non- or only minor functional dysfunctions induced by the ABI. The largest group of patients fulfilling the criteria to be identified with MACI have a mild TBI and the second largest group have had a stroke (18).
1.2.2 Mental Fatigue / Brain Fatigue
A very common symptom after TBI, stroke (23), or other ABIs (24) is mental fatigue. Mental fatigue is also often present for patients with MCI (25). It can therefore be expected to be a common symptom for patients with MACI as well. Mental fatigue can last for many years and it often causes difficulties maintaining social activities and the return to work (26). It has been pointed out that the consequences for daily life of mental fatigue for patients with mild ABIs often are underestimated (4). A more colloquial term for mental fatigue is brain fatigue (24,27).
1.3 MACI Rehabilitation and Peer-to-Peer Social Support
Since the term MACI is a new term there are no previous studies explicitly on MACI rehabilitation. Nevertheless a group rehabilitation program for patients fulfilling the criteria for having MACI, has been shown to be beneficial; the patients were reported to gain a better acceptance and adaption to their condition and they perceived improved cognitive ability (4). This rehabilitation included peer-to-peer social support. Peer-to-peer refers to patients exchanging information directly with each other. Social support can, according to the social support behavior codes by Cutrona and Suhr, be classified in the following support categories: informational, emotional, esteem, network and tangible. The definitions of these categories can be seen in Table 1.
Table 1. The social support codes and definitions [from Cutrona and Suhr (28)]
Code Definition
Informational Providing information about the stress itself or how to deal with it
Emotional Communicating love or caring
Esteem Communicating respect and confidence in abilities
Network Communicating belonging to a group of persons with similar interest and
concerns.
Tangible Providing or offering to provide goods or services needed in stressful situations
Informational peer-to-peer support was exchanged within the group rehabilitation program for the patients fulfilling the criteria for being identified with MACI. These patients received knowledge on brain injuries, and on compensatory strategies for dealing with their acquired deficits from each other (4). In other words, they were provided with information
14 about any stress they might experience and on ways to deal with it. The main source of their stress was their cognitive impairment.
The patients also gained esteem support from each other, which made them more confident in their abilities. The exchange of experiences on how to use strategies to compensate for deficits due to MACI enabled the patients to redefine their own strategies in relation to the others. This helped them to become more aware of their own behavior, to get a wider perspective of possible strategies and to sort out inadequate strategies (4).
The sharing of experiences in the group rehabilitation program can also be described as network support, because the participants belonged to a group of persons with similar concerns (4).
There are also studies on positive effects of social support for patients with conditions which can be related to MACI. The amount of social support, regardless of type, has been shown to have had a positive influence on the recovery over time for patients who have had
a stroke (29). After a TBI, strategies to deal with impairmentsand perceived social support
have been shown to be strong and unique covariates of resilience. In other words, these factors most likely enable a better acceptance and adaption to their condition. The aim of MACI rehabilitation is also that of resilience since the focus is on coping and adapting to the cognitive impairment rather than gaining improved cognitive ability. The perceived improvement in the rehabilitation group could possibly be due to improved strategies to deal with the cognitive impairment rather than actual improved cognitive abilities (30). Socializing and in general to be in contact with similar others are, in addition to social support, important for people with MACI (30). Similar others refer to individuals sharing comparable situations. The patients in the group rehabilitation expressed that sharing experiences made them feel less alone and that despite clinical differences “they had a common feeling of understanding”. Many patients experienced a lack of understanding from family, friends and caregivers. MACI, or MCI in general, is not well understood by the general public nor non-specialized clinicians (30,31). The patients in the rehabilitation program had cut down their social contacts with family and friends (4). Not being understood combined with attention deficits may cause people with MACI to withdraw from their previous social contacts. Attention deficits can make it difficult following a conversation (30). Decreased social life can affect the health. Health is not only the absence of illness but it also includes social well-being (32). It has been recommended that energy and resources in the rehabilitation process of individuals with TBI, should be focused upon their psychosocial health (33). The medical definition of psychosocial is: “relating social conditions to mental health” (34). Psychosocial difficulties are more consistently verified after a TBI than physical difficulties are (35).
The group rehabilitation program described above was based on face-to-face communicative interactions. However today the World Wide Web (web) has introduced other potential communication channels which can be supplements to traditional face-to-face (or telephone) communication.
1.4 Social Media
Social media is, in addition to socializing, also commonly used for gaining knowledge from others as well as sharing experiences (in this study regarded as informational support) (1). Facebook and Twitter have become very popular social media sites among adult internet users in emerging and developing nations (36,37). The most popular social media site
15 worldwide is Facebook (38). In Sweden, 91% of the population (above 12 years old) are internet users, and 72% of them have at least once visited a social media site, and as many as 70% have visited Facebook. Social media, in addition to enabling users to publish material, also assists users to have online social interactions in different forms (39). Some social media sites have group sites for people with a certain interest, where people can publish material and perform online social interactions with each other within the group. 53% of the social media users in Sweden are members of social media group communities, such as Facebook groups (39). There are also social media groups for people dealing with the same, or a similar, health condition (40).
1.4.1 Social Media Groups and Chronic Disease Management
Studies on the use of social media groups within chronic disease management show that they can support patients to provide each other with social support, to better understand their conditions, and to exchange experiences (40,41). It has also been shown that the use of social media groups in chronic disease rehabilitation can have psychosocial benefits for the users (40).
The communication format provided by social media groups could be favorable for individuals with MACI. It has been suggested that communication on social media in general can be beneficial for individuals with cognitive impairment caused by TBI or other conditions. The reason is they can choose whether to be passive and view others´ contributions, or to actively take part in the communication by contributing with content. It is also possible to absorb given information as well as produce it at one´s own pace (42,43). These benefits are also valuable for people suffering from MACI (30).
It has also been concluded that Facebook groups have become popular support-seeking-tools for patients with breast cancer (44). Patients with HIV have been shown to seek and provide each other with social support, within a studied Facebook group. These patients with HIV also, for example, used the group for socialization (with text, non-verbal cues or by the use of banters) (45). These kinds of social interactions among persons with a similar condition could also be beneficial for the social well-being of persons with MACI (30).
1.5 Social Network Analysis
A social network analysis can reveal patterns of the activities within social media groups (46). The above mentioned studies on social media groups were mainly focused on what the members in the groups were communicating. In a social networks analysis, the focus is on how they are connected to each other. In other words, how involved the members are in the communication within the group. A social network analysis is a set of methods which for example can describe with how many, how often and with whom the members of a group are communicating (47). The aim is to understand human behavior through their relationships or interactions with each other within a social network (48). A social network is comprised by actors and the relations between these actors (47). Members of a social media group can be conceptualized as actors and their communicative interactions can incorporate the relations between them. A social network analysis includes social network graphs and social network concepts.
1.5.1 Social Network Graphs and Concepts
The social network concepts and graphs are based on graph theory (49). Data on the actors and their relationships within a network are in a social network analysis organized in
16 matrices. For moderate to large sized data sets these matrices becomes large and complex, and the visual appreciation of the data becomes lost (49). Graph theory translates the matrix data into concepts and graphs that describe the network. The logic behind the different concepts and graphs has fortunately been described in scientific literature in a way which do not require the reader to be a mathematician, and the mathematical calculations can be performed with available open source software (49,50). In graph theory, the representation of the actors and their relations in the matrices can be translated into points and lines. In social network analysis the points are termed nodes, and the lines are termed edges (49). Graphs can be undirected or directed. In undirected graphs the edges only represent the presence of a relationship between actors (Figure 1). In directed graphs the edges additionally represent the direction of the interactions in a relationship (49). Only undirected graphs are further discussed in this report unless something else is explicitly expressed.
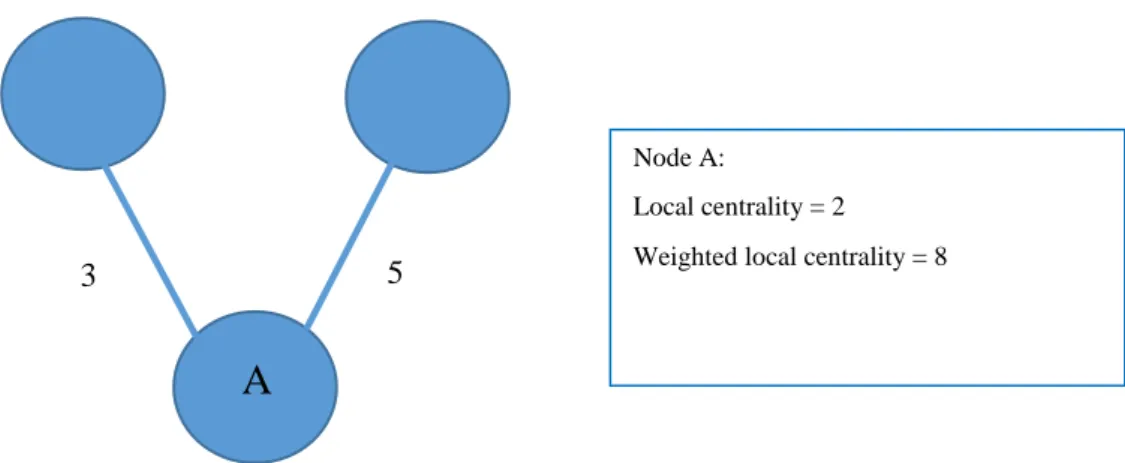
Two nodes connected by an edge is a dyad (51). A dyad is shown in Figure 1.
Figure 1. A dyad
Social network graphs can be constructed of dyads (pairs) of nodes. The same node can be a part of several dyads. The nodes which are connected by edges are termed adjacent nodes (49).
The edges in a social network graph can be given weight factors. These can for example represent the amount of interactions an edge incorporates (49).
The most basic measure in social network analysis is termed local centrality. The local centrality is the number of edges a node has, thus showing how many other nodes the node is connected to. The local centrality can also be calculated by including weight factors of the edges, and it can then be termed weighted local centrality (47). The local centrality and the weighted local centrality in a social network graph is shown in Figure 2.
Edge
17
Figure 2. Local centrality and weighted local centrality of node A
In Figure 2 the node A has two edges and therefore the local centrality is 2. These two edges have the weight factors 3 and 5. Therefore the weighted local centrality for node A is 8 (3+5). In Figure 2 it can additionally be seen that local centrality only refers to the information flow between nodes that are in direct contact through an edge. It does not concern any further spread of information. There are as well other kinds of centralities which can be used in a social network analysis. These include the flow of information between nodes which through other nodes are connected to each other. In this study only the local centrality was explored and therefore it is in the rest of this report only termed centrality.
1.6 The Problem Definition
There is a lack of knowledge on how individuals with MACI communicate in social media groups.
It has been shown that social support, like informational support, and socialization within in a group of similar others can be beneficial in MACI rehabilitation (4). Social media groups can be a tool for exchanging social support and socialization, as well as it can be beneficial for the psychosocial well-being (40,45,52). There is research on the use of social media groups by individuals with different health conditions but not MACI (18,41,44,45). In one study, a large portion of individuals with TBI were reported to be using Facebook on regular basis, and half of the non-users would like to learn how to use it (53). Patients with a common cause for having MACI have in other words a positive attitude toward using Facebook. In addition the communication format of social media groups can be favorable for individuals with cognitive impairment (42). However, in a systematic review on information communication technology tools, which also covered social media, no research was found on social media groups aimed for individuals with MACI (18). To address this lack of knowledge this study explores both what people with MACI are communicating, and how involved they are in the communication, in a social media group.
A
3 5
Node A:
Local centrality = 2
18
1.7 Aim and Objectives
The aim is to explore how people with MACI communicate in a social media group. The objectives are to describe the content in addition to visualize the group members´ involvement.
1.8 Research Questions
The main research question is: What do people with MACI communicate in a social media group and how do they interact?
The sub questions are:
What kind of information is exchanged?
With how many members, how frequently, with whom and by which kind of interactions do members communicate?
19
2. Methods
2.1 A Social Media Group Related to MACI
In this study, an open Facebook group aimed for Swedish speaking individuals with the symptom brain fatigue after a brain injury was explored. To the authors knowledge it did not exists any social media group aimed for individuals with MACI in Sweden. However, the studied group was aimed for persons with a symptom assumed to both be common for persons with MACI, and a potential obstacle for their return to a normal life.
To the authors knowledge there are no studies on how individuals, with mental fatigue after a brain injury, are communicating in social media groups. A search, which did not result in
any relevant hits, was done the 25th of November 2015 with the search term mental fatigue
or brain fatigue combined with the term social media or Facebook. It was performed in the following databases; PubMed (54), Web of Science (55), IEEExplore (56) and ACM Digital Library (57).
Users of, the in this study explored group, could communicate by producing and viewing content on a Facebook group wall. To produce content on the wall, users had to through a Facebook profile be a member of the group. However, any individual who has a Facebook profile could have viewed all the content on the wall without having to be a member. The content on the wall was comprised by posts, comments and “likes”. The latter in the form of a thumbs-up-symbol. The posts could only be published directly on the wall, while the comments had to be directed to posts, and the “likes” to either posts or comments.
2.2 Data Collection Method
This was an observational study. In observational studies data is collected from the participants´ in their usual environment without altering it (58). Content, and relational, data from the existing Facebook group wall was collected during a time window without interfering with the participants. An advantage with collecting data directly from the Facebook group wall, was the data was on the actual communication. Interviews or questionnaires for example only collect data on what individuals claim they do, which may not be as accurate (59).
The content data was the texts, pictures and videos in posts and comments, as well as the “likes” (in the form of the symbol). The relational data was the members´ involvement in the communication, hence when members were communicating through the collected content on the wall.
The data was collected at 21 October 2015. The time window for the data collection was set to one year, from 1 September 2014 until 31 August 2015.
The members were represented by their Facebook profiles since those were exposed on the wall. No data from the profiles properties (like name, gender, etc.) was collected.
2.3 Participants / Sampling
At the end point of the data collection time window the Facebook group had in total 1310 members. The amount of members over time could not be collected since the Facebook
20 group did not have any activity log for showing this information, which was confirmed by querying the Facebook´s Help Center.
This study had 1092 participants. The target population in this study was all the members of the group, who during the time window published posts, wrote comments on, or acknowledged “likes” to posts. It was for practical reasons not possible to include if members acknowledged “likes” to comments. The members who were not participants did either not produce any content at all within the group during time window, or they did only acknowledge “likes” to comments.
All the members in the target population were included in the studied sample, because collection of relational data requires both the involved members in the relation to be participants (49,60). Participants could otherwise have had relations (comprised by comments and/or “likes”) with members of the group who were not included in the sample. There could however still exist missing data on relations extending over the start and end points of the time window. To reduce the ratio of this potential missing data, the time window was set to a whole year. Another reason a whole year was chosen was to avoid seasonal effects, because seasonal effects can affect individual behavior (61).
2.4 Data Collection Software
In this study Netvizz v1.25 was the data collection software (62). To manually collect the data in this study would have been a time consuming task, but there are software for collecting data from social media (63). There are a large number of analytic tools targeting Facebook page owners for monitoring marketing campaigns. However, there are only a few software designed for empirical research on Facebook groups. Two software for Facebook group data extraction are NodeXL Pro and Netvizz (63,64). NodeXL is a template for Microsoft Excel and the Pro version provides a data importer for open Facebook groups (64). Netvizz is a Facebook application that allows researcher to collect data from open Facebook groups (63). Netvizz has been described in the literature as collecting data only on when a user comments on or “likes” another member´s post while NodeXL Pro in addition collects data on when a user “likes” another user´s comment (63). To be able to include the latter the software NodeXL Pro was first explored for the data collection in this study (64). It was however found that parts of the time window was not covered by the data downloaded with NodeXL. Therefore, Netvizz was used and this is the reason for why the “likes” to comments were excluded in this study for practical reasons. The collected data by Netvizz was obtained in tab separated (TAB) and Graph Data File (GDF) format. The TAB files contained the texts in the posts and comments, as well as the links to the posts. The GDF files had tables with relational data on the participants´ involvement with each other and the engagement around the posts.
2. 5 Data Analysis
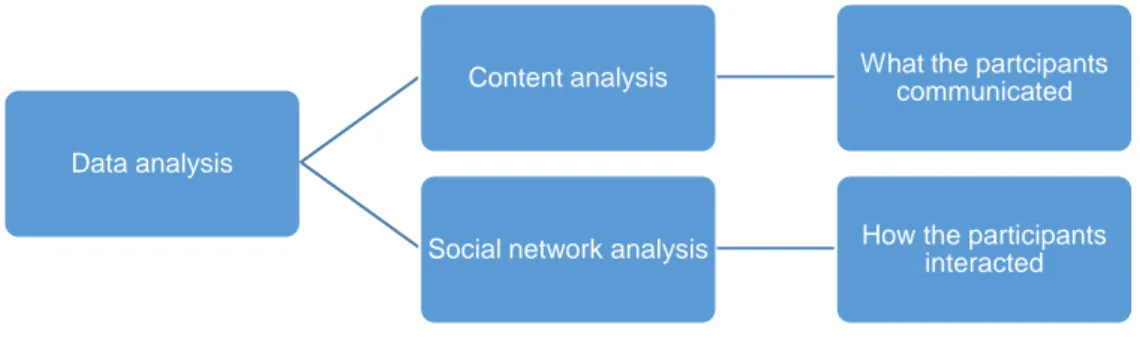
The data analysis was a combination of a qualitative content analysis and a quantitative social network analysis. The content analysis described what the participants communicated in the Facebook group and the social network analysis described and visualized how they interacted with each other (Figure 3).
21
Figure 3. The data analysis methods
The data analysis was applied both to the group as a whole and to some of the individual participants. These individual participants were the most frequent publishers of posts, commenters and "likers". This choice was based on that these individuals were frequent users of the Facebook group and hence played large roles in the communication. It also covered the frequent use of different kinds of communication features.
2.6 Content Analysis
The content analysis described what kind of information was exchanged within the Facebook group. A content analysis reduces qualitative data into a quantified form (65). In this study a thematic content analysis was performed to describe the semantics of the posts and the comments. Each post and each comment were linked to one specified code based on its main theme. Themes are units of meaning (66).
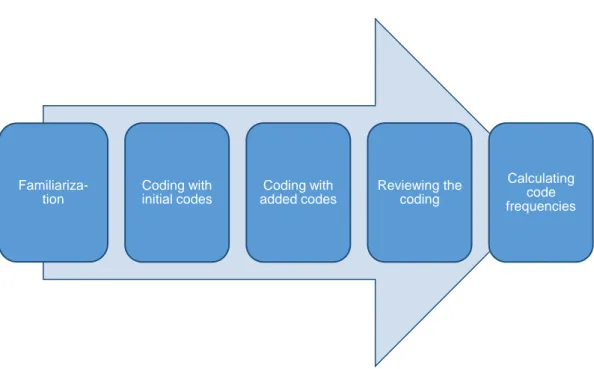
This analysis was a directed content analysis. In a directed content analysis the initial starting codes for the themes are retrieved from literature (67). It has been argued that this increases the probability of being consistent in the coding process, since the codes are well defined from the beginning (45). The content analysis process is shown in Figure 4.
Data analysis
Content analysis What the partcipants
communicated
22
Figure 4. The phases of the content analysis
2.6.1 Familiarization
The comments were aggregated with the posts they were directed to. The author started with reading all the posts and comments, and with following the links to the posts to view videos and picture. This was done to get an overview and to get familiar with what the participants were communicating to each other within the group.
2.6.2 Coding with Initial Codes
The first step in the coding process was to link the main themes in the posts and comments to a set of initial codes. The initial codes were retrieved from the content analysis of the Facebook group for HIV patients which is mentioned in the introduction section (45). The social support codes are defined above in Table 1, and the additional initial codes and their definitions can be seen in Table 2.
Familiariza-tion Coding with initial codes Coding with added codes Reviewing the coding Calculating code frequencies
23
Table 2. The additional initial codes and their definitions [defined by Gaysynsky et al. (45)]
Codes Definition
Expression of gratitude Thankfulness to another user or the whole group
Offering congratulations Expression of joy, acknowledgement of another´s achievement or
good future
Administration Administrative engagements
Socializing Discussion of interacting outside the group, greeting, invitations to
events, photos of the group, news about personal achievements
Non-verbal cues Expression of non-verbal, such as facial expression
Banter Humor or nonsense
Group cohesion Text on how a user feel about the group
Community protection Aim to maintain an atmosphere of support or enforce group norms
Negative interactions Disrespectful or sarcastic text directed at other users, or a statement of being hurt
Miscellaneous Statement which is not applicable to other codes
Expression of gratitude and Offering congratulations were initial codes. These have been suggested to be facilitators of online exchange of social support within self-help groups (68). The code Administration described the administrational engagement. The administrators in the Facebook group in this study were healthcare professionals, but the group was not connected to any specific rehabilitation program or treatment. The code Socialization referred to socialization through written text, but socialization can also be performed with verbal cues or with banters, which were codes of their own (30). In this report socialization related codes refers to these three codes. In this group there were, as an example, pictures with banters on how it is to suffer from brain fatigue. Group cohesion was a code which was mainly used when the participants expressed how pleased they were that the group existed. An example of community protection was when participants warned each other that a commenter or post-author probably had commercial interests. Negative interactions could describe if the participants were treating each other in respectful manners or not. All the themes that did not have any applicable code were coded as miscellaneous.
2.6.3 Adding Codes
The second step in the coding process was to revise the initial codes. The code miscellaneous was split into several codes. This is shown in Table 3
24
Table 3. The codes derived from the initial code Miscellaneous
Initial Code Added Codes Definition
Miscellaneous
Advertising Indirect or direct advertisement
Questions Questioned asked within the group which could not be
coded according to any other of the codes.
Own comment Comments made, by the author, on the
post-authors own posts.
Miscellaneous Statement which is not applicable to other codes
Table 3 shows that three new codes were created for common main themes in the posts or comments that initially were coded as miscellaneous. These new added codes were Advertising, Question and Own-comment. Advertising was added since there were some content on the wall which contained information on participants´ positive perceived effects of a product in combination with that the participants also were the suppliers of the product. The code Questions was added because it was noticed by the author that there were comments on posts which contained questions to the post-author, which were not applicable to any of the other codes. An example of such a question was to ask the author to clarify something. The code Own Comment was needed since there were post-authors who commented on their own posts, and this was according to the author´s judgment mainly done to either further clarify their text in their post, or to give a comment to a comment on their post (the group did not have any comment on comment feature). These comments were excluded from the presentation of the semantics, since these were only coded based on that they were directed to the same participant who had made the comment, not on the actual semantics. The posts were found to in some occasions be written to seek support. These posts were, in addition to coded according to their main theme, also coded as seeking support. All posts with social support which were not coded as seeking support were here together with all comments with social support conceptualized as providing support.
2.6.4 Reviewing the Performed Coding
The coding of all the post and comments were reviewed by the author and another person (the supervisor). A third person was also involved, but just for the coding of posts and comments that not already were given the same code by the other persons. To have several persons involved in the coding process increased the reliability of the results.
2.6. 5 Calculating Code Frequencies
The frequencies of posts and comments per code within the whole group were calculated. In addition, the codes of the posts produced by the most frequent post publishers, and the codes of the comments by the most frequent commenters were calculated. These most frequent producers were found by conducting the social network analysis.
2.7 Social Network Analysis
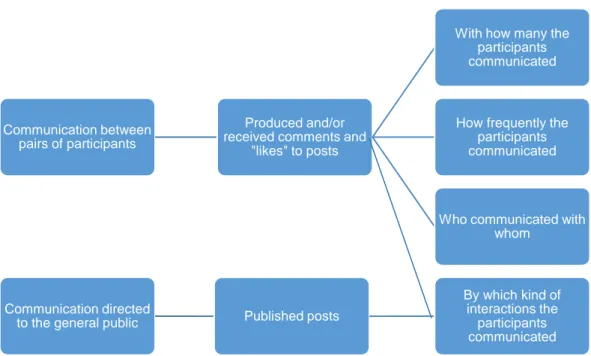
The social network analysis described and visualized how pairs of participants interacted with each other through the comments and “likes” directed to posts. In this study this was presented by with how many, how frequently, and with whom the participants communicated. The social network analysis also included by which kind of interactions the participants communicated in general. This also incorporated the posts (Figure 5).
25
Figure 5. The design of the social network analysis
In this report the term directed interactions refers to comments and "likes" directed to posts, while the term interactions refers to comments and "likes" to posts in addition to the published posts.
Each node in the social network was a representation of one unique participant. The edges represented all directed interactions between the pairs of communicating participants. Comments and likes to one's own posts were excluded from the social network analysis. The reason was that it would have been difficult to interpret to whom these directed interactions actually were meant to be directed.
The posts were not a part of the edges since these were not interactions between a pair of participants. The posts were instead conceptualized as directed to any of the members of the group (participants or not) or even to anyone with a Facebook profile. The data on the amount of published post per participant was available as a node attribute in the data tables in the GDF files. The GDF files had two kinds of tables; one for the nodes and one for the edges. The node table had attributes which showed the amount of all the different kinds of interactions each participant both had produced and received. A part of the edge table and a part of the node table are shown in Figure 6 and Figure 7. Some columns are collapsed to save space.
Communication between pairs of participants
Produced and/or received comments and
"likes" to posts
With how many the participants communicated
How frequently the participants communicated
Who communicated with whom
Communication directed
to the general public Published posts
By which kind of interactions the
participants communicated
26
Source Target Type Id Weight
baefad.. 34a17b.. Undirected 70 18
baefad.. 44d214.. Undirected 3032 9
baefad.. 572e99.. Undirected 2502 1
Figure 6. A part of the edge table
Id Actions Made-posts Made-comments Made-likes Rec.-Comments Rec.-Likes
baefad.. 174 11 88 75 70 364
88966.. 18 1 15 2 28 4
efd5f0.. 18 0 2 16 0 2
Figure 7. A part of the node table
2.7.1 Social Network Concepts and Graphs
The social network concepts used in this study were the local centrality and the weighted local centrality. Local centrality is, as already mentioned, only termed centrality in this report. It was applied to describe how many of the others each participant was in contact with through directed interactions. The centrality shows the number of other nodes a node has edges to, and the edges were comprised by directed interactions (69). The weighted centrality in this study additionally described how frequently each participant was involved in directed interactions, because the weight factors of the edges were the amount of the directed interactions. The weighted centrality in other words described the total amount of comments and "likes" to posts that each participant produced and received.
The social network graphs visualized the centrality and weighted centrality per node, as well as the edges and the edge weights. The edges and the edge weights showed who was in contact with whom and how frequently. The parts of the study that were addressed by the different aspects of the social network analysis is shown in Figure 8.
27
Figure 8. The parts of the study that were addressed by the different aspects of the social network analysis
Aspects of the Social Network Analysis
Parts of the Study
With how many the participants communicated
Centrality and social network graphs
How frequent the participants communicated
Weighted centrality and social network graphs
Who communicted with whom Social network graphs
By which kind of interactions the participants communicated
Aggregation of data in the node table
28 In this study, undirected graphs were constructed. The reason was that only the centrality of a node in an undirected graph could correspond to how many others a participant was in direct contact with. In undirected graphs a pair of adjacent nodes have one edge, but in directed graphs they instead may have one or two edges. (47). The direction of the information flow per participant was anyhow included as the above described attributes of
the nodes in the data tables, as seen in Figure 7. To make a comment or a “like” was to
direct the information flow to another participant, while receiving a comment or a “like” was to receive information. However only the direction of the general information flow was included. The direction of the social support between the participants was not. A post or a comment can be written to either provide or seek support (45). Both a commenter and a post author can hence be the source or the target of social support. All the comments in this study were as described above conceptualized as providing social support, but all the posts were not. A “like” could hence have been acknowledged to a post to provide social support in the form of encouragement, or it could have been acknowledged to show appreciation of received support (70).
2.7.2 Software for the Description and Visualization of the Participants´
Interactions
Gephi 0.8.2 beta, an open-source software in Java on the NetBeans platform, was used in this study for describing and visualizing the relational data (71). This software provides calculations of social network concepts as well as constructions of social network graphs (72). The reason for using Gephi was it is was an open-source software and it is known to be easy to use (73). It also provides the user with the opportunity to interact with the graph drawing algorithms. This makes it possible to in real time perceive the consequences of different settings which facilitate the understanding and control of the graph drawing process (73,74).
Force-directed graph drawing algorithms are popular techniques for the construction of social network graphs. These algorithms use aesthetic criteria for positioning the nodes and edges in the graphs to visualize patterns of relations (75). The patterns of relations was in this study the patterns of the directed interactions between the participants. Attractive and repulsive forces are assigned to the nodes and the nodes and the edges are plotted in the graph according to a sought global energy minimum (76). In these graphs, in contrast to graphs of variables, the Cartesian coordinates are therefore not of importance (49). The decision on which graph drawing algorithm to choose is a subjective task. It is advised to try several and to use the most, to the intended audience or analyst, comprehensible graph (77). Gephi 0.8.2 beta provides several force-directed algorithm alternatives.
2.7.3 The ForceAtlas2 Algorithm
In this study the ForceAtlas2 algorithm was used for the construction of the graphs. The ForceAtlas2 algorithm is based on the spring-electrical model (74). A spring-electrical algorithm compares a graph to a mechanical system with electrical charged steel rings connected by springs. The rings represent the nodes and the springs the edges. All nodes repel each other and only nodes connected by edges attract each other. The repulsive force is global and inversely proportional to the Euclidean distance between nodes. The attraction force is only between adjacent nodes and it is proportional to the Euclidean distance between them. The positioning of the nodes and edges is based on a sought equilibrium of the conflicting attractive and repulsive forces (76,78,79).
29 As advised, all the force-directed graph drawing algorithms were explored before deciding which algorithm to use. All the graphs constructed with different algorithms turned out to have a dense core, consisting of many nodes and edges. All graphs also had peripherally placed leaf nodes. Leaf nodes here refers to nodes which are at the boarder of a graph and which only have one edge to one other node in the graph.
The ForceAtlas2 algorithm was used because it could with modified settings visualize the dense core as a bit less nested and it could also in most cases visualize the edges to the leaf nodes.
Another advantage is that ForceAtlas2 is described in detail in scientific literature and therefore more transparent than most of the other algorithms in Gephi (74).
2.7.4 The Construction of Social Network Graphs
The GDF file with the relational data on the participants´ involvement was opened in Gephi as an undirected graph to create a base graph. The size of the nodes were ranked after the centrality and the ForceAtlas2 algorithm was run until the author perceived relatively stable and clear patterns. ForceAtlas2 have no auto-stop feature, it is a continuous graph drawing algorithm (74).
This algorithm has modifiable and additional optional settings. Before deciding on which values to modify and which of the optional settings to use, their impact on the visualization of the data in this study was explored. The option Prevent Overlap was chosen, because it made the graph less cluttered. It prevents the nodes from being placed on top of one and other (74). The settings with modified values are the edge weight influence, the scaling and the gravity. The edge weight influence was set to 0, instead of the default value 1.0, because it made the core of the graph a bit less dense. The default value 1.0 causes the attraction between connected nodes to be proportional to the edge weight. Higher values than 1 increases the edge weight effect on the attraction force, and lower decreases it. The value 0 represents no effect at all (74). The ForceAtlas2 algorithm has a centrality dependent repulsive force which pushes nodes with high centrality values further from each other than in a basic spring-electronical model. The combination of this increased repulsive force between high centrality nodes, and that it was possible to inactivate the attraction based on the eight weight, placed high centrality nodes at the boarder of the graph core instead of in the center. This enabled better visualization of the very nested core in addition to that the leaf nodes edges, which in many cases were connected to the high centrality nodes, did not drown in the nested pattern. The edge weight was hence not in the graphs visualized by how close adjacent nodes were placed to one another. This was however instead visualized by the thickness of the edges.
The Scaling was changed from the default 2 to 13 to have a larger graph which still was within the frame. The larger the scaling value the larger the graph (74).
The Gravity value was kept as the default 1.0. This value had only a minor effect on the social network graphs in this study. It attracts nodes to the center of the frame, but here the nodes were already so nested and therefore attracted to the core. The gravity prevents isolated nodes or groups of nodes from drifting away (74). In this graph there were no isolated groups of nodes. There was however one single node which did not have any edges at all. This node drifted away outside the boarder of the frame. The gravity setting was however not increased to have this node to be placed within the frame. The reason for this was, increasing the gravity does not affect nodes with centrality values of 0 (in other words,
30 which have no edges), because the gravity force calculation includes multiplication of the centrality (74).
2.8 Research Ethics
In this study, data was collected without interacting with the Facebook group members. There was no medical or physical risks for them to participate. Only data on the communication was collected from the Facebook group. No attributes from the participants´ Facebook profiles were collected. To have unique identifiers the participants were by the software for collecting data given automated anonymous Ids (Figure 7). To create a Facebook profile, the person must at least be 13 years old. Since age was not collected, it cannot be known for sure if this study only was including adults. However, this study was as mentioned not interacting with the participants and the study method and the data collection were approved by the regional ethics committee in Stockholm (ref. no. 2015/1287-31/5).
31
3. Results
3.1 The Size of the Studied Network
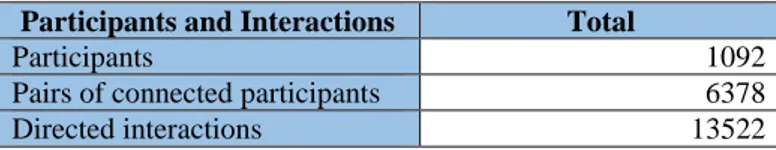
The size of the conceptualized social network is presented in Table 4. The size is presented in the form of how many participants, and how many pairs of connected participants there were in the network. Table 4 also shows the total amount of the directed interactions that these pairs of participants exchanged between each other.
Table 4. The size of the network, n = 1092
Participants and Interactions Total
Participants 1092
Pairs of connected participants 6378
Directed interactions 13522
In Table 4 it can be seen that there were participants who were involved in directed interactions with several of the others (they were a part of several pairs). The amount of pairs was a higher value than the double sum of participants.
3.2 Different Kinds of Interactions
The total amount of performed “likes” and comments to posts, as well as the amount of published posts, within the Facebook group during the data collection time window, can be seen in table 5.
Table 5. The amount of different kinds of interactions, n = 1092
Interaction Total
“Likes” to posts 10176
Comments on posts 3346
Posts 630
Total 14152
Table 5 shows it was more common to “like” than to comment on posts, and the least commonly used communication feature was to publish posts.
There were 180 (17%) of all the participants who published posts, 537 (49%) who wrote comments on, and 1014 (93%) who acknowledged likes to, posts.
3.3 The Main Themes in the Posts
The most common main theme in the posts was the social support category informational support (41%). The second most common theme was banter, closely followed by socializing. The socialization related codes represented 28% of all the posts. Although advertising and negative interactions did exist in the group, posts with these main themes were not frequent (2% contra <1%). The percentage of posts with the different main themes
32 can be seen in Figure 9. There were no posts at all with the main theme offering congratulations therefore this theme is greyed out in the descriptive text in Figure 9.
Figure 9. The frequency of main themes in all the posts, n = 180
More than half (57%) of all the posts were coded as one of the social support categories. The most common was informational support, since it was the overall most common main theme in the posts. Informational support was, like the overall social support, more frequently provided than sought.
In Figure 9 it can be seen that emotional support was the fourth most common main theme in the posts, and hence the second most common social support category. Emotional support was the only category which was more sought than provided. Network and Tangible support were nearly not, or not at all, provided or sought. The frequencies of the posts coded as providing or seeking any of the different social support categories in relation to all the posts can be seen in Table 6.
33
Table 6. The frequencies of provided and sought social support in relation to all the posts, n = 180
Social Support Seeking Providing Seeking and Providing
Informational 10% 31% 41% Emotional 5% 4% 9% Esteem <1% 4% 5% Network <1% 1% 1% Tangible <1% 0% <1% Total 17% 40% 57%
3.4 The Main Themes in the Comments
Most of the comments were, like the posts, also coded as informational support (34%). The informational support was followed by the codes emotional support (26%) and esteem support (18%). The socialization related codes were not as common main themes as in the posts, but still found in 12% of all the comments. The negative interactions had a very low frequency and were only directed to four posts. Two of these posts included information on benefits with narcotic drugs. The third had the text "We've got a life. It is up to us to make it good or bad". The fourth was a description of how much work load a person had managed despite her condition. There were no comments at all coded as advertising. Social support covered 78% of all the comments. All of the social support comments were here conceptualized as providing support. The percentage of the comments which had the different main themes can be seen in Figure 10.
34
Figure 10. The frequency of main themes in all the comments, n = 537
3.5 With How Many, and How Frequently the Participants
Communicated
There were many participants who were involved with only one or a small number of the others, and there were few who, on the contrary, were communicating with many. In addition, several participants were involved in few directed interactions, and only some were involved in high amounts of directed interactions. The distribution of how many the participants were involved with is presented in Figure 11, and the distribution of how frequently the participants were involved in directed interactions is shown in Figure 12. The amount of nodes per centrality respectively weighted centrality value are illustrated in these figures.
35
Figure 11. A graph with the amount of nodes (y-axis) per centrality value (x-axis), n = 1092
Figure 12. A graph with the amount of nodes (y-axis) per weighted centrality value (x-axis), n = 1092
36 Figure 11 and Figure 12 show that both the amount of nodes per centrality value, and per weighted centrality value, followed long tail distributions. (The dot with the coordinates 0,0 is the node which, as described in the methods section, drifted away, and could not be visualized in the social network graphs.) The aim with both Figure 11 and Figure 12 was to show the overall distribution, rather than individual values. The latter was not possible due to the large range of values. The long tail shape showed that these distributions could not, as a normal (Gaussian) distribution, be well characterized by a mean and a standard deviation. Therefore, in Table 7 the participants are instead presented as groups based on how many they were exchanging directed interactions with (their centrality values). This table also shows the range of the amount of directed interactions that the participants within each group were involved in (their weighted centrality values).
Table 7. The participants grouped after centrality values, the amount of participants per group, and the range of weighted centrality values within these groups, n = 1092
Centrality Group Participants per Group Centrality Weighted Centrality Zero-connected 1 (<1%) 0 0 Single-connected 297 (27%) 1 1-10 Bi-connected 155 (14%) 2 2-7 Sparsely-connected 381 (35%) 3-10 3-36 Intermediate-connected 240 (22%) 11-94 11-127 Highly-connected 15 (1%) 100-254 158-534 Very-highly-connected 3 (<1%) 411-516 1700-2308
Table 7 illustrates that, the level of how many the participants were in contact with roughly followed the degree of how many directed interactions the participants were engaged in. Although there were variations, in Table 7 it can for example be seen that some intermediate-connected participants were involved in fewer directed interactions than the sparsely-connected.
3.6 Kind of Interactions Performed per Centrality Group
For each group, based on how many the participants were in contact with, it was more common to “like” than to comment on a posts, and it was more common to direct “likes” or comments to posts than it was to publish the posts. This was the same behavior pattern as the group as a whole showed (Table 5).
There were participants who only "liked" or only commented others posts, and there were as well a few who only published posts. A very large portion of the single-connected only produced “likes”. The lower amount of others the participants were in contact with, the larger was the portion of participants who only communicated through “likes”. Table 8 shows the frequencies of participants who only produced "likes", comments or posts.
37
Table 8. The frequency of participants per centrality group, who only produced one kind of interaction (posts, comments or “likes”), n = 1091
Name of the Group of Participants Only Produced “Likes” Only Wrote Comments Only Published Posts Single-connected 243 (82%) 41 (2%) 1 (<1%) Bi-connected 112 (72%) 12 (1%) 1 (<1%) Sparsely-connected 85 (22%) 30 (1%) 3 (<1%) Intermediate-connected 20 (1%) 0 (0%) 3 (<1%) Highly-connected 0 (0%) 0 (0%) 0 (0%) Very-highly-connected 0 (0%) 0 (0%) 0 (0%)
All highly- and very-highly-connected participants were found to use all the different kinds of interactions: posts, comments and “likes”. However, the distribution of the use of these different interaction features differed among them. Some produced more posts than the others and some produced more comments or "likes" than the others. The three very-highly connected participants by far produced the highest amount of posts in the network. These were named A, B and C. The participants who belonged to the highly-connected were named D-R. The alphabetic order from A to R corresponded to the order of with how many each participant was in contact with. Table 9 shows the use of different interactions by A-R.
There were also two participants who did not belong to A-R, but who were among the most frequent producers of comments contra “likes” in the network. These two were named x and y (Table 9). x and y belonged to the intermediate-connected (Table 7, Table 10). Table 10 shows with how many and how frequently the A-R and the x and y participants were communicating through direceted interactions.
38
Table 9. The amount of made and received interactions per individual for the participants A-R and x and y, n = 20 Participant Made Posts Made Comments Made Likes Received Comments Received Likes A 66 66 110 313 1970 B 82 65 130 114 1869 C 72 50 45 451 1215 D 11 81 75 63 364 E 10 52 96 43 340 F 5 1 7 16 293 G 8 25 36 57 293 H 6 25 24 152 182 I 7 5 4 38 221 J 22 7 7 43 163 K 15 8 4 21 134 L 3 77 156 19 60 M 3 140 249 2 52 N 2 5 49 21 95 O 9 8 2 128 70 P 4 12 25 22 127 Q 10 24 28 30 101 R 12 16 7 78 67 X 0 82 82 0 0 Y 0 0 242 0 0
Table 10. With how many and how frequently each of the very-highly and highly-connected participants, in addition to x and y, exchanged directed interactions, n = 20
Participant Centrality Weighted Centrality
A 516 2308 B 426 2032 C 411 1700 D 254 534 E 250 503 F 219 312 G 205 391 H 196 364 I 146 265 J 121 215 K 114 160 L 113 293 M 111 432 N 108 164 O 104 202 P 103 170 Q 102 176 R 100 158 X 61 164 Y 66 242
39
3.7 The Most Frequent Post Publishers
Each of the three most frequent publishers of posts (A, B and C) published at least three times as many posts as any of the other participants. Their amount of posts can be seen in Table 9. Although these participants published the highest amount of posts per individual they more often responded to others´ posts than they published their own. All of them produced a higher sum of “likes” and comments than posts. C however produced much less "likes" both in comparison with A and B, and in relation to the amount of produced posts and comments by C (Table 9).
A, B and C were the most “liked” participants and they received many comments as well (Table 9).
These three also received the highest average of "likes" per post and individual. The average amount of "likes" per post by participant A, B and C were 1018, 975.5, and 643.5. The following fourth highest average value per individual (participant D) was much lower at 187.5 "likes" per post.
For the participants A, B and C the order of how many others they were in contact with followed the order of the amount of directed interactions they took part in. The participant who was in contact with the highest, second highest and third highest amount of others corresponded to the participant who was involved in the highest, second highest and third highest amount of directed interactions. This is visualized in Graph 1 by the alphabetic order of the letters and the color of the nodes. For exact values see Table 10.
The two most frequent publishers of posts, A and B, produced different patterns of main themes than the group as a whole. They had a higher merged frequency of the socialization related themes. A and B also provided less informational support compared to the group as a whole. Especially B showed a different pattern with a large amount of published banter. Participant C on the contrary showed a fairly similar pattern of themes compared to the whole group. C had a similar frequency of the main theme informational support and only a slightly higher frequency of posts coded as emotional support compared to the group as a whole. The proportions of the main themes in the posts by A, B and C can be seen in Figure 13. The themes that did not exist in any of these participants´ posts are greyed out.
![Table 1. The social support codes and definitions [from Cutrona and Suhr (28)]](https://thumb-eu.123doks.com/thumbv2/5dokorg/2765858.1631/13.892.189.790.865.996/table-social-support-codes-definitions-cutrona-suhr.webp)