2017; 3(1): 28-48
Published by the Scandinavian Society for Person-Oriented Research Freely available at http://www.person-research.org
DOI: 10.17505/jpor.2017.03
The Clinical Trials Mosaic: Toward a Range of Clinical Trials
Designs to Optimize Evidence-Based Treatment
Ty A. Ridenour
1,2, Szu-Han K. Chen
3,
Hsin-Yi Liu
3, Georgiy V. Bobashev
1, Katherine Hill
4, &
Rory Cooper
3,51
Research Triangle Institute, International, Research Triangle Park, North Carolina
2
School of Pharmacy, University of Pittsburgh
3
Department of Rehabilitation Science and Technology, University of Pittsburgh
4
Department of Communication Sciences and Disorders, University of Pittsburgh
5
Human Engineering Research Laboratories, Department of Veterans Affairs
Address Correspondence to: Ty A. Ridenour, PhD, MPE, Research Triangle Institute, International, 3040 E. Cornwallis Rd, PO Box 12194, Research Triangle Park, NC 27709-2194; phone: 919-248-8519; fax: 919-485-5555
Email address:
TRidenour@rti.orgTo cite this article:
Ridenour, T. A., Chen, S-H- K., Liu, H-S., Bobashev, G. V., Hill, K., & Cooper, R. (2017). The clinical trials mosaic: Toward a range of clinical trials designs to optimize evidence-based treatment. Journal for Person-Oriented Research, 3(1), 28-48. DOI:
10.17505/jpor.2017.03
Abstract
Objective: Dichotomizing clinical trials designs into nomothetic (e.g., randomized clinical trials or RCTs) versus idiographic (e.g., N-of-1 or case studies) precludes use of an array of hybrid designs and potential research questions between these extremes. This paper describes unique clinical evidence that can be garnered using idiographic clinical trials (ICTs) to complement RCT data. Proposed and illustrated herein is that innovative combinations of design features from RCTs and ICTs could provide clinicians with far more comprehensive information for testing treatments, conducting pragmatic trials, and making evidence-based clinical decisions. Method: Mixed model trajectory analysis and unified structural equations modeling were coupled with multiple baseline designs in (a) a true N-of-1 pilot study to improve severe autism-related communication deficits and (b) a small sample preliminary study of two complimentary interventions to relieve wheelchair discomfort. Results: Evidence supported certain mechanisms of treatment outcomes and ruled out others. Effect sizes in-cluded mean phase differences (i.e., effectiveness), trajectory slopes, and differences in path coefficients between study phases. Conclusions: ICTs can be analyzed with equivalent rigor as, and generate effect sizes comparable to, RCTs for the purpose of developing hybrid designs to augment RCTs for pilot testing innovative treatment, efficacy research on rare diseases or other small populations, quantifying within-person processes, and conducting clinical trials in many situations when RCTs are not feasible.
Keywords: Clinical trials, statistical analysis, trajectories, structural equations modeling, idiographic, nomothetic, treatment mechanisms, N-of-1, personalized medicine, pragmatic trials
The decades-long debate pitting nomothetic research (aggregating group data to generalize results to populations) versus idiographic research (using short-term, intensive, time series data from individuals to reveal within-person processes) has renewed in psychology and healthcare (Cat-tell, 1952; Guyatt et al., 2000; Kratochwill & Levin, 2010;
Molenaar, 2004; Nesselroade & Ghisletta, 2003; Shadish, 2014; Skinner, 1938). This debate is occurring primarily among statisticians, without consideration of evidence needed by clinicians and clinical researchers who stand to gain considerable rigor for treating clients/patients by an evolution in evidence-based, individualized treatment
29 (Davidson, Peacock, Kronish, & Edmondson, 2014; Khoury & Evans, 2015). Statistical foundations for nomothetic and idiographic strategies were laid by Cattell (1952) and soft-ware developments can quantify both strategies from one dataset using hybrid clinical studies (e.g., Beltz, Wright, Sprague, & Molenaar, 2016). This paper is to provide a clinician-oriented introduction and argument for developing hybrid combinations of features from both designs, using two studies to demonstrate the range of clinical knowledge that could emanate.
Regarding clinical studies, nomothetic research (e.g., randomized clinical trials or RCTs) could be considered a top-down approach that uses cross-sections, panels, or waves of population-level data to acquire evidence needed for population-level decisions (e.g., epidemiology, health policy, or developers of clinical products). One advantage of RCTs is an ability to detect small effect sizes (e.g., by using large samples). They might also reveal subpopulations of clients/patients characterized by categories of outcomes or other treatment-related characteristics to inform treatment strategy (Lei, Nahum-Shani, Lynch, Oslin & Murphy, 2012). A disadvantage of RCTs is their limitation for generalizing results to clinical settings, small subgroups, or individuals due to exclusion criteria, efficacy that is moderated by unanalyzed conditions, and heterogeneity of treatment re-sponses.
Traditional idiographic clinical trials (ICTs) termed N-of-1 or case studies, in contrast, focus intensely on individual-level data over shorter time spans to inform clinical decision-making for individual clients/patients. Rather than population estimates, idiographic techniques resemble a clinician’s milieu by carefully investigating individuals’ conditions, treatment-related processes and side effects, as well as dynamic person-treatment interactions over time (Molenaar, 2004). ICT advantages include an approach for evidence-based, personalized treatment (Guyatt et al., 2000) and when using medium- to small-sized samples they typically require far less resources and time compared to RCTs. ICT disadvantages include limitations to generalizing results especially when samples represent small proportions of a population or N=1. Indeed, the historical tradition in ICTs is not to analyze data statistically, and to generally limit investigations to focus on large effect sizes. ICTs might identify subgroups of clients/patients in terms of similar longitudinal patterns (e.g., homogeneous clusters) or similar outcomes, but doing so in a bottom-up manner (Gates & Molenaar, 2012; Raiff et al., 2016; Zheng, Wiebe, Cleveland, Molenaar & Harris, 2013).
The purpose of this paper is to describe and illustrate potential benefits to clinicians and their clientele that are offered by advancing rigorous ICTs and hybrid designs. For example, such designs might test treatment efficacy for a rare disease (there are several thousand rare diseases, which combined are estimated to affect 25 million U.S. citizens alone; National Institute of Health, 2014). Sample sizes needed for RCTs frequently cannot be recruited because the
population is too small. Yet, using an ICT approach, a large proportion of the population could be recruited (albeit using a small “N”) and studied to estimate efficacy.
ICTs have largely been neglected in favor of RCTs. In certain ways, this is unfortunate for clinicians because treatment requires (a) decision-making about how to best treat an individual using the available interventions while taking into account individual differences in response to interventions (whereas RCT evidence is largely limited to population- or large subpopulation-aggregate estimates of efficacy and effectiveness); (b) short- and long-term moni-toring of individuals (e.g., to confirm that a treatment is having the desired impact or to change treatment strategy); and (c) techniques, tools, and combinations thereof which are specialized to remedy an illness according to the needs of each individual client/patient. This need for evidence-based clinical decision-making and the limits of dichotomizing RCT vs ICT has led to (a) repeated calls to understand which treatments work for whom and under what conditions (Fishbein & Ridenour, 2013; Guyatt et al., 2000; Roth & Fonagy, 2006); (b) evolving medical home models (Fisher, 2008; Hunter & Goodie, 2010; Rosenthal, 2008; Tarter, Horner, Ridenour, & Bogen, 2013); and (c) movements to promote personalized and value-based medicine. To illu- strate, the Patient-Centered Outcomes Research Institute was founded in 2010 because “traditional medical research, for all of the remarkable advances in care it produces, hasn’t been able to answer many of the questions that patients and their clinicians face daily…” (PCORI, 2014).
Since the 1980s, nomothetic studies have dominated peer-reviewed research reports (Gabler, Duan, Vohra & Kravitz, 2011; Smith, 2012). Three recent trends have motivated a resurgence in ICTs: recognition of the limits of RCTs (Ferron, Farmer & Owens, 2010; Kratochwill et al., 2010; Van den Noortgate & Onghena, 2003); needs for patient-centered healthcare (Davis, Schoenbaum, & Audet, 2005); and development of statistical techniques that rigorously and elegantly analyze ICTs (Ferron, Bell, Hess, Rendina-Gobioff, & Hibbard, 2009; Ridenour, Pineo, Maldonado Molina, & Hassmiller-Lich, 2013; Molenaar, 2004; Zheng et al., 2013). However, dichotomizing RCTs vs ICTs is misguided because the essence of human clinical conditions is characterized by combinations of tools and treatments designed for populations, subtypes of persons, heterogeneity within those subtypes, within-person longi-tudinal change, and heterogeneity in response to treatment.
The ideal clinical trial dataset would reflect reality by in-cluding a large sample, randomization with subject-as-own control design features, and detailed time series data from each participant (Beltz et al. 2016; Cattell, 1952; Nessel-roade & Ghisletta, 2003). This dataset would provide RCT outcomes while understanding and accounting for within-person processes and individual differences that lead to heterogeneity of outcomes. Currently, however, researchers are largely limited to methods designed either for nomothetic investigation of long-term, population
average treatment outcomes (e.g., 6 or 12 months after administering treatment) or idiographic investigation of short-term outcomes and processes that occur during treat-ment administration in few persons.
Combinations of clinical trial methods could provide a mosaic of techniques for clinical research to sample far more regions of the ideal clinical dataset. To demonstrate this mosaic, certain methods traditionally limited to either ICTs or RCTs were integrated herein. Because of space constraints and existing comprehensive sources, only terse summaries are presented herein of (a) the ICT approach, (b) the RCT approach, (c) how clinicians and their clientele are poorly serviced by relying solely on RCTs, (d) current ICT limitations, and (e) the clinical trials design mosaic. Because far greater development has occurred for RCTs, this paper emphasizes advancing ICT and hybrid techniques to adeptly address important yet innovative clinical trials research questions.
Traditional ICT Approach to Inform Clinical Decisions ICT Designs. Kazdin (2011), Ottenbacher (1986), and others have written comprehensive presentations of ICT designs. Fundamentally, designs of ICTs collect time series data from each participant during both control and experi-mental study phases (hence the moniker “subject-as-own- control design”) in place of RCT randomization. ICT de-signs have the advantage of ensuring that “control” and “treatment” data come from exactly equal persons. Time series data from the baseline phase (i.e., control phase) quantify how an illness would progress under care as usual or without intervention.
ICTs most often utilize some variant of the multiple baseline design (Brossart et al., 2006; Gabler et al., 2011; Kazdin, 2011; Smith, 2012). In place of RCT randomization, a multiple baseline design controls for extraneous influences (e.g., historic events, participant practice, maturation) by randomly staggering the longevity of baseline phase among participants (Kratochwill & Levin, 2010), some of whom also could serve as true controls (e.g., in a “wait list” con-dition). This control for extraneous influences can be strengthened by enrolling participants on different dates and using statistical techniques described later. If a treatment has therapeutic impact, illness severity should abate during treatment phases, but only following onset of treatment in each participant. The treatment impact effect size is then estimated by differences between intercepts and/or slopes- over-time among study phases.
An alternative is the ‘reversal’ designs (e.g., ABAB), which are limited to special circumstances because treat-ment is withdrawn during a subsequent phase (e.g., the second 'A') to test whether treatment impact correspond-ingly wanes (Kazdin, 2011). One required circumstance is a rapid “washout” of treatment effect (e.g., sudden removal of a reinforcer or a drug with a short half-life) to show that treatment impact wanes soon after treatment is withdrawn to
rule out alternative explanations. Education and most psychotherapies typically cannot be unlearned and therefore could not be tested using a reversal design. A second circumstance is that sufficient time is needed for an outcome to “stabilize” after treatment is withdrawn; it may be unethical to withdraw treatment for the duration required for an outcome to re-stabilize. Variants of the statistical tech-niques described herein for multiple baseline studies also can be used with reversal designs (Ridenour et al., 2009).
Strengths. As illustrated later, ICTs provide techniques for homogenous samples; intensive investigation of within-person processes including treatment mechanisms or mediators that occur over the course of treatment admini- stration (rather than at 12-month outcomes); and experi-mental research when populations or funding are small such as: rare diseases (several thousand are known, National Health of Institute, 2014), emerging illnesses (e.g., Ebola), genetic micro-trials, hard-to-reach or underrepresented populations (e.g., Native American tribes), in-the-field treatments such as soldiers at war or emergency department patients (Ridenour et al., 2016), research in third world countries, pilot studies, and studies of policy changes that are comprised of few states or other regions. As illustrated and cited below, recent advances in adapting statistical tech- niques to psychology from aeronautics, econometrics, neu-roimaging, and animal husbandry (using small samples to N=1) promise to make ICTs more rigorous and informative.
Limitations. The greatest ICT limitation occurs with an N=1 study because the generalizability of results to others is inestimable. On the other hand, an N=1 design provides the strongest evidence for clinical decision-making regarding the client/patient whose data are analyzed (Guyatt et al., 2000). ICTs generally involve intensive data collection from individuals, thereby usually precluding large samples and thus population-level estimates for large populations. Nevertheless, meta-analysis techniques are available to aggregate multiple ICTs (Braver et al., 2014; Ugille, Moeyaert, Beretvas, Ferron, Van den Noortgate, 2012; Van den Noortgate et al., 2003; Zucker, Schmid, McIntosh, Agostino, Selker, & Lau, 1997). The sample sizes needed to adequately generalize results of ICTs to a population are unknown, including how homogeneity/heterogeneity of within-person processes at the population level ought to be accounted for in the sample design (Gates et al., 2012; Zheng et al., 2013). Another traditional limitation arises from how, historically, ICT researchers usually have limited data analysis to visual inspection. Recent reviews indicated that statistical analysis is employed in less than 1/3 of con-temporary psychology ICTs (Brossart, Parker, Olsen & Mahadevan, 2006; Smith, 2012).
Traditional RCT Approach to Inform Clinical Decisions RCT Designs. In the simplest RCT, participants are randomly assigned to either treatment or control (often care as usual) in the attempt to equate the groups on all
charac-31 teristics except the treatment. When randomization fails to sufficiently equate the groups, statistical techniques are used to account for group differences. Many variants of RCT designs exist including recent developments of SMART designs (Lei, Nahum-Shani, Lynch, Oslin & Mur-phy, 2012), MOST designs (Collins, MurMur-phy, & Strecher, 2007), and propensity scoring to refine efficacy estimates (Lee, Lessler & Stuart, 2010).
Strengths. RCTs offer a rich and sophisticated history of methods and evidence. RCT power analysis and other nomothetic techniques have been evolving for over 30 years. Sampling strategies and data weighting have been well-delineated. RCTs have become well-funded and gold-standards for many features of RCT research have been identified. The most common clinical use of RCTs is estimating an intervention’s efficacy or effectiveness at the population or subpopulation level.
Limitations. RCTs often require large samples (e.g., to detect small effect sizes and minimize confidence intervals) and resultant expenses lead to numerous scenarios when RCTs are not feasible. Fortunately, ICTs offer complemen-tary, rigorous alternatives for those scenarios (see ICT Strengths). Perhaps the greatest RCT limitation is that their efficacy estimates are often used to inform clinical decisions for individual clients/patients. However, to do so a clinician is nearly always forced to violate well- established limits of statistical generalization including the ecological fallacy, ergodicity theorem and Simpson’s para-dox (Simpson, 1951). Next, these phenomena are described and illustrated by physicians’ resultant dilemma in the con-text of treating diabetes.
Ecological fallacy occurs if inferences are made about subgroups or individuals based on large sample-level data when those persons are distinct from the prototype of the full sample (Piantadosi, Byar, & Green, 1988; Roux, 2002; Schwartz, 1994). Proofs of the ergodicity theorem specify the rare conditions under which the ecological fallacy does NOT occur (Birkhoff, 1931; Gayles & Molenaar, 2013; Molenaar, 2004): stationarity (statistical properties such as mean, variance and covariances among clinical characteris-tics are invariant over a given time interval) and homogene-ity across persons (no interindividual differences exist among the statistical parameters and models of individuals’ clinical characteristics). A common exercise in psychologi-cal and healthcare nomothetic research involves drawing inferences from a study’s results about the nature of indi-viduals (i.e., assume ergodicity), yet few aspects of human health or psychology meet the conditions of ergodicity.
Thus, efficacy results from RCTs generalize poorly to most individuals (everyone except the average). Indeed, situations have been demonstrated in which group averages (i.e., population estimates) fail to resemble any individuals (Miller & Van Horn, 2007). RCTs rarely present data to understand heterogeneity in treatment responses. As a result, person-centered, value-based medicine, and medical home model movements have risen in healthcare and psychologi-
cal treatment in attempt to enhance RCTs by obtaining treatment-related evidence specifically for clinical decision-making (Fishbein et al., 2013; Fisher, 2008; Guyatt et al., 2000; Hunter & Goodie, 2010; Rosenthal, 2008; Roth & Fonagy, 2006; Tarter et al., 2013), joining long-standing champions of ICTs (e.g., Ferron, et al., 2009; Kazdin, 2011; Kratochwill et al., 2010; Ottenbacher, 1986; Shadish, 2014) in recognizing the limits of RCTs for informing clinical decisions.
Clinicians’ dilemmas from RCTs
Treatments to control diabetics’ glucose level illustrate the clinical upshot of the ergodicity phenomenon. Weissberg-Benchall et al. (2003) conducted a high quality, widely-cited meta-analysis of 11 RCTs that compared mul-tiple daily injections to insulin pumps. Insulin pump therapy was associated with better glucose control on average in each study. The aggregate efficacy, Cohen’s d (the mean difference in treatment outcomes, computed as: [ T – C] / Variancepopulation) (Cohen, 1988), was quite large,
d = .95 (CI=.8-1.1), in favor of the insulin pump. It was concluded that, insulin pump therapy “… is associated with improved glycemic control compared with traditional insulin therapies … [without] significant adverse out-comes.” (p. 1079). However, complications of the insulin pump that were reported in the reviewed studies included dangerous glucose levels (both high and low), pump mal-function, and site infections. Also, 37.5% of insulin pump recipients discontinued its use in favor of injections (Weissberg-Benchall et al., 2003). Thus, a large efficacy supported using insulin pumps on average, but no guide-lines were provided to determine who benefits from insulin pumps vs. daily injections. Guidelines are still lacking to anticipate which treatment offers greater benefits for individual patients (Reznik, et al., 2014).
ICT Solution for the Clinician’s Dilemma. Physician Pineo’s recent dilemma illustrates how ICTs can supple-ment RCTs to inform clinical decisions (Ridenour et al., 2013). His nursing home patients with diabetes frequently experienced ketoacidosis while receiving the sliding scale method of glucose control (insulin levels are adjusted only bi-weekly). Although antiquated, the sliding scale is com-mon practice within nursing homes because insulin pumps are costly, easily damaged (e.g., while moving a patient between a bed and wheelchair), injurious to patients (e.g., due to misuse by patients with dementia), and can increase the aforementioned health risks. No research literature could be located regarding treatment of uncontrolled blood glucose in this population. Dr. Pineo developed an algo-rithm to use at each meal (accounting for blood glucose level and anticipated food consumption) to determine bolus doses of insulin for a nurse to administer (termed “manual pancreas”). A multiple baseline ICT pilot tested the manual pancreas with Dr. Pineo’s patients as they entered his care (N=4), which demonstrated statistical and meaningful
re-duction in blood glucose levels (Cohen’s d =.84) as well as the need for the individualized bolus dosing (Ridenour et al., 2013).
Clinical Trials Designs Mosaic
Historically, polarization of RCT vs. ICT has reflected differences in seven design features: effect size, sample size, number of observations per participant, length of study enrollment, randomization strategy, type of inference drawn, and analysis techniques. As mentioned, a dataset that provides the most comprehensive evidence for clinical decision-making would consist of the sample size of a tra-ditional RCT, the time series of a tratra-ditional ICT, randomi-zation scheme(s) to address the relevant treatment research question(s), and analytic techniques to simultaneously es-timate (a) efficacy/effectiveness and (b) within-person processes (Beltz et al, 2016; Cattell, 1952; Nesselroade & Ghisletta, 2003). Such a dataset has not yet been compiled due to the expense, copious effort, and singular focus required to conduct it. Even so, all extant studies could be considered subsets of this population of data, including RCT-ICT hybrid designs. One widely-used hybrid design that has combined features traditionally used in RCT or ICT designs is the double-blind, cross-over clinical trial using trajectory analysis (Hahn, Bolton, Zochodne, & Feasby, 1996).
Hybrid clinical trial designs would utilize combinations of the seven features of traditional ICTs and RCTs that best address a particular hypothesis and/or clinical deci-sion-making research question(s). Some benefits of doing so include: (1) optimal combination of features that are selected to address a particular research question; (2) strengths and limitations of each feature can be delineated by study, as per the research question(s) it is intended to answer; (3) the limitations of a study can be better specified and redressed in replication research; and (4) over time, a richer mosaic of studies could represent more segments of the aforementioned comprehensive dataset. Clinical decisions could consider how well/poorly the evidence in-forms an expected treatment outcome for an individual or even use an N-of-1 study for an evidence-based, individu-alized clinical decision.
Two investigations presented later illustrate the clinical trials designs mosaic. They use idiographic statistical tech-niques that have parallel techtech-niques in nomothetic research, thereby permitting results from RCTs and ICTs to be coa-lesced and potentially meta-analyzed. Elsewhere are demonstrations of ICTs in natural experiments, to test moderation/mediation effects of a treatment, and for researching treatment-by-subgroup interactions (Raiff, Barry, Jitnarin & Ridenour, 2016; Ridenour et al., 2013; Ridenour, Wittenborn, Raiff, Benedict & Kane-Gill, 2016). Prior to presenting the illustrations, the statistical models are succinctly described.
Methods: Statistical Techniques for Hybrid
Clinical Trials
Mixed Model Trajectory Analysis (MMTA). MMTA uses the hierarchical linear modeling approach with certain adaptations specifically for small samples (described later). An individual’s time series observations are quantified at level 1 while the aggregates of individuals’ data are ana-lyzed at level 2 (also providing a statistical test for individ-ual differences) (Bryk & Raudenbush, 1987; Curran, Howard, Bainter, Lane, & McGinley, 2014; Ferron et al., 2009 & 2010; Hedeker & Gibbons, 2006; Ridenour et al., 2013; Ridenour et al., 2016; Singer & Willet, 2003; Shadish & Rindskopf, 2007). Considerable evidence in using MMTA to quantify individual time series and outcomes is available from health and non-health fields (e.g., animal husbandry and genetics) in the context of best linear un-biased predictors (Henderson, 1963; Littell, Milliken, Stroup, Wolfinger, & Schabenberger, 2006; Robinson, 1991). Within-person MMTA can be represented using a single regression equation:
(1) Yit =ß0 + u0i + ß1(Time) + u1i(Time) + ß2Intxit + ß1(Intxit*Time)it + eit
where Yit is an outcome for individual i at time t; the inter-cept for individual i (in ICTs the interinter-cept may be when a baseline phase transitions to intervention) is a function of the average sample intercept (ß0) plus individual i’s devia-tion from this average (u0i, which is assumed to have a normal distribution and each time point is uncorrelated with all others, using an error covariance structure to parse out autocorrelation); change in the outcome over time is a function of the sample average trend (ß1[Time]) plus indi-vidual i’s deviation from that trend (u1i[Time], assumed to be normally distributed); differences between baseline and intervention phases are modeled as differences between phase intercepts (ß2Intxit) and trends (ß3(Intx*Time)it); and finally eit denotes random error (an aggregate term that can be parsed into multiple sources of error). This model can be expanded into vectors and matrices to accomodate multi-variate predictors.
The term “mixed model” refers to categorization of model variables into “fixed” or “random” effects. Fixed effects involve variables assumed to have no measurement error, are constant across individuals, and their values are equivalent across studies (e.g., most demographics, passage of time, study arm assignment). Random effects involve variables that represent random values from a larger popu-lation or involve generalizing inferences from the effect beyond the observed values (e.g., Gaussian psychological characteristics, an effect of time that varies across persons). While not discussed here due to space limits, this distinc-tion is fundamental both in terms of analytic techniques and interpretation of results (Borenstein, Hedges, Higgins, &
33 Rothstein, 2010). Within ICTs, fixed effects are typically of greatest interest whereas random effects serve as statistical controls.
Herein, maximum likelihood estimation and common fit statistics (likelihood-ratio 2, Akakie’s Information Criterion, Bayesian Information Criterion) tested whether competing predictors and error covariance structures provided best fit to the data using SAS 9.3. Results of MMTA fit tests are not reported herein to conserve space but are available from the first author. Misspecifying error covariance structures in MMTA can result in biased esti-mates of parameter confidence intervals, random effects, and possibly fixed effects (Ferron et al., 2009; Kwok et al., 2007; Sivo et al., 2005). Thus, multiple error covariance structures were tested (autoregressive, heterogeneous auto-regressive, autoregressive moving average, and toeplitz, each with a lag 1).
One of MMTA’s adaptations for small samples is to ob-tain model parameters using restricted maximum likelihood estimation because the full maximum likelihood under- estimates parameter variance components (due to how df are allocated) (Dempster, Laird & Rubin, 1977), which is particularly problematic for small samples (Kreft et al., 1998; Patterson et al., 1971). The second adaptation is using the Kenward-Roger adjusted F-test (when an F-test is used) to reduce potential for Type I error (Ferron et al., 2009; Kenward & Roger, 1997; Littell et al., 2006).
Unified Structural Equations Modeling (USEM). Conceptually, USEM is a form of state-space modeling which resembles SEM in many ways, but models day-to-day changes (or more generally timet to timet+1) of
multiple variables while accounting for autocorrelation (e.g., Figure 2, later). Chow and colleagues (2010) thoroughly review similarities and differences between SEM and state-space models, but demonstrate that each is a special case of the other (depending on model constraints) – consistent with the aforementioned ideal dataset. Proto-typical SEM best models “simultaneous structural relations among latent variables and possible interindividual differences in such relationships” whereas prototypical state-space techniques best model “more complex intrain-dividual dynamics, particularly when time points are great-er than sample size” (such as ICTs) (p. 310). Table 1 briefly compares three statistical modeling approaches with poten-tial for analysis of hybrid and ICT studies. The analytic
model that is employed in any particular study should be selected according to the objectives, hypotheses, assump-tions, and design of the particular study. Herein, USEM was chosen for time series data, emphasis on short-term (e.g., day-to-day) change, and an assumption that contem-poraneous and lagged associations among variables would not change over the course of the study, except by study phase.
USEM is among the least used techniques for clinical trials. Indeed, few studies to date have analyzed ICT data using USEM (Kim, Zhu, Chang, Bentler & Ernst, 2007; Gates et al., 2012; Molenaar & Nesselroade, 2009; Ram, Brose & Molenaar, 2013; Ridenour et al., 2013; Zheng et al., 2013). Herein, USEM mathematical notation is based on the recently created set of analytic programs, Group Iterative Multiple Model Estimation (GIMME), because their features most resemble the ideal clinical trial dataset and individualized analytic options needed to inform clini-cal decisions (Beltz et al., 2016; Gates et al., 2012). Unlike other linear algebraic packages, within a single analysis GIMME-MS can parse variance and covariance among study variables into individuals’ own autocorrelation patterns, across-person common effects, individual-specific effects, and detection of subgroups of participants with similar individual-specific effects (Beltz et al., 2016).
Equation 2 presents the general USEM formula (with constant means fixed at zero) in which study variables are observed each day. Associations among variables are described as either contemporaneous (same-time) or lag 1 (effect from a preceding time point to the next time point). This model assumes that (a) only one solution best accounts for each individual’s data (including group- and individual-level effects) and that (b) autocorrelation with a lag of 1 [i.e.,
1(t)] fully accounts for unexplained correla-tion among each individual’s observacorrela-tions over time. Within GIMME, violation of the former assumption can be handled within GIMME-MS by its search for multiple solutions and violation of the latter assumption can be handled by allowing for additional autocorrelations (e.g., lags of 2 and/or 3) (Beltz et al. 2016). The error matrix for Equation 2 contains a diagonal covariance matrix with means of zero. Time points are notated as t = 1, 2, … T (with 1 indicating length of lag), study variables as , indi-viduals as the subscript i, and group-level effects as the superscript g.i(t) = (i + g)i(t) + (1,i + 1g)i(t – 1) + 1(t)
Variables to be explained (vector Contemporaneous relations among variables (matrix) Lagged relations among variables (matrix) Error; unexplained variance (matrix)
Table 1. Prototypical uses of three analytic techniques of longitudinal data GIMME State-Space Models
(USEM)
Hierarchical Linear Modeling (MMTA)
Bivariate ALT, Parallel Process Models (SEM) Introductory
References
Beltz et al. (2016); Gates et al. (2012)
Bryk et al., (1987); Ridenour et al., (2016); Singer, et al., (2003)
Bollen et al. (2004); McArdle (1988); Sher et al. (1996)
Objective
Quantify intraindividual dynamic relations in one, or among many, variable(s) over short time periods
Quantify/model one outcome trajectory; ICT quantifies para- meters changes in an experiment
Quantify interindividual structure relations among latent variables
over long time periods Design Small ‘N’, manifold ‘T’, short
lags between observations
Wide range of ‘N’, ‘T’, and ob-servation lag times
Large ‘N’, few ‘T’, long lags between observations
Assumptions
Error terms are normal, homosce-dastic, not autocorrelated, and don’t correlate with other model terms for
the same ‘Y’
Error terms are normal, homosce-dastic, not autocorrelated, and don’t correlate with other model
terms
Error terms are normal, homoscedas-tic, not autocorrelated, and not corre-lated with other terms for the same ‘Y’; exogenous variables are error free Traditional orientation Idiographic, autoregression Nomothetic, hierarchical
regres-sion
Nomothetic, structural equations modeling
Intended data type Multiple variables of time series
data Time series or panel data
Panel data with fewer than 10 waves spaced months or years apart Method for testing
com-peting models SEM fit statistics SEM fit statistics SEM fit statistics
Can test among
sub-groups or treatment arms Yes Yes Yes
Emphasis on correctly modeling error covari-ance structure
Error structures tested and de-termined prior to estimating other parameter coefficients
Error structures tested and deter-mined prior to estimating other
parameter coefficients
Error structure typically assumed to be heterogeneous autoregression (lag 1),
that is largely decayed due to time span between observations Can accommodate N=1
data? Yes Yes No
Heterogeneity in error
structure among persons? Yes Only in person-specific analyses No
Explicitly models parallel and same-time relations among multiple varia-bles?
Yes No Yes
Explicitly models lagged relations among multiple variables?
Yes No Yes
Explicitly models change in same-time, lagged relations?
Assumes same-time and lagged relations are equivalent for study duration
Assumes same-time and lagged relations are equivalent for study duration
Yes
Can test for fixed effects? Yes Yes Yes
Can test for random
effects? Yes Yes Yes
Note: Chow et al. (2010) describe general similarities and differences between structural equations modeling and state-space modeling, including how each can be a special case of the other given specific model constraints. N=sample size. T=number of measurement occasions (times). USEM=unified structural equations modeling. MMTA=mixed model trajectory analysis. SEM=structural equa-tions modeling.
35 Treatment mechanisms can be modelled, and moderation of them between baseline and intervention phases can be tested in terms of improved fit to the data between (a) forcing individuals’ model coefficients to be equal during control and treatment phases versus (b) freeing the coeffi-cients to differ among phases. Herein, Study 2 compared three competing models of treatment mechanisms using traditional SEM fit statistics for longitudinal data (likeli-hood ratio 2, Akakie’s Information Criterion, Bayesian Information Criterion) and AMOS 19.
The primary aim of Study 2 was to derive coefficients at the aggregate level rather than detailed individual differ-ences. Within this context, traditional SEM programs may be used to analyze data from each participant and per study phase as if they came from different subsamples (e.g., to account for clustering within individuals and differential weighting due to varying numbers of observations among participants). Fixing parameters to be equal among the sub- samples of data (not necessarily subsamples of participants) provides comparison fit statistics when no differences among study phases are modelled (i.e., H0). Then, by
free-ing the parameters to be estimated separately among the study phases (i.e., H1), the change in fit to observed data
provides a test of moderation. This approach assumes that the critical study interest is comparing between study phas-es, as in a clinical trial. When, in contrast, individual dif-ferences are the critical aspect of the analysis then an analysis program that is specifically designed for this pur-pose such as GIMME-MS is required (Beltz et al., 2016; Gates et al., 2012).
Recently, USEM in the form of P-technique more ac-curately modelled observed values compared to MMTA and time series analysis (ARIMA) with N=4, multiple baseline design, a time series of 400 observations per participant, and large intraindividual variability (Ridenour et al., 2013). However, compared to MMTA, USEM required such a large number of parameters that for single-person analyses it was unable to converge on a solution. Gates et al. (2012) and Zheng et al. (2013) provide examples of USEM for N=1. Another recent state-space modeling advance is a technique for testing mediation analysis within persons (Gu, Preacher, & Ferrer, 2014).
Study 1: Traditional N-of-1 Study Analyzed
with MMTA
Background
Autism spectrum disorders (ASD) are often first recog-nized because of delayed or abnormal speech or communi-cation. Approximately 1 in 68 children has an ASD (Baio, 2014), about 50% of whom develop limited or no speech (Johnson, 2004), and these deficits usually continue into adulthood (Howlin, Goode, Hutton, & Rutter, 2004). Augmentative and Alternative Communication (AAC)
technologies have been designed specifically for children with ASD (Hill, 2012). One recently-developed AAC in-tervention consists of teaching children to use a computer-ized, icon-based, touch-screen system that also generates digitized speech to strengthen verbal communication (Chen, Hill, Ridenour, Sun, Su, & Chen, 2015). The user interface allows icons to be hidden, so that more complex vocabulary can be introduced gradually and tailored to a child’s skill level, learning rate, and evolving interests. However, three barriers have largely precluded using RCTs to test efficacy of AAC technologies: limited funding, availability of only small samples, and large population heterogeneity (e.g., comorbidities).
The first hypothesis was that the AAC treatment provides growth in communication skills in children with severe communication deficits. A critical component of the AAC intervention is training family members to deliver AAC so that speech-language therapy can be more affordable, individualized, and flexible in delivery times and ‘dosage.’ Accordingly, the second hypothesis was that the communi-cation improvement associated with the AAC intervention would be equivalent among a speech language pathologist (SLP) and two family members, with the intervention deliverer being tested as a treatment mechanism (statistical moderation).
Methods
Study Design. The participant was a 6-year, 3-month-old boy, with an ASD, pervasive developmental disorder, moderate-to-severe speech disorder, and language delay; his communication level equaled a 10- to 18-month age range of normative development. He was recruited at the clinic where he had received traditional speech therapy for six months without improvement. Per the university IRB- approved protocol, the boy’s mother and grandmother were recruited as communication partners to deliver the AAC intervention in addition to his SLP. The baseline phase con-sisted of introducing the boy to the AAC system on a touchscreen laptop, which was placed on a desk in the intervention environment (home), but without further instruction. Communication partners also self-talked and used the AAC system at set intervals to encourage the boy’s usage of it. Baseline lengths of three, five, or seven sessions were randomly assigned among communication partners.
During intervention, communication partners imple-mented strict instruction and modeling protocols to teach AAC usage to the boy. Each correct touch of an icon and attempt to speak the corresponding word was reinforced with the boy’s favorite cookie, music, and verbal praise. Each intervention session was divided into 20 minute segments, starting with the grandmother as partner, followed by the mother, and then SLP. During grandmother- and mother-led sessions, the SLP guided the others’ intervention when needed.
37 Instrumentation. The outcome variable was a count of the number of times the participant correctly touched the AAC display and spoke to imitate the computerized speech output (Hill, 2004). Vocabulary evaluation allowed the participant to produce meaningful utterances that were more similar to his natural speech and language develop-ment than the pre-recorded computer digitized output (Hill et al, 2012). Sessions were video recorded; interrater relia-bility Pearson r = .82.
Results
Data analyses utilized only MMTA because there were too few observations for USEM. Data were missing for one of the grandmother’s sessions and three SLP sessions. Error covariance structures differed slightly among partners with autoregressive(1) fitting best for grandmother and SLP, but variance components structure for mother. Figure 1 presents observed time series data as solid lines, best fitting MMTA models as dotted lines, and the MMTA formulas to compute Y’. The Pearson correlation was r = .90 between predicted and observed outcomes. In individual and aggre-gate analyses, communication growth was statistically greater for AAC than Baseline (p<.05).
Random slopes, but not random intercepts, statistically improved fit to the data (p<.05), indicating that shape of trajectories differed among communication partners. Specifically, faster growth occurred with mother-led AAC intervention. Visual inspection suggested that improvement in communication during the grandmother and mother sessions begins at initiation of SLP intervention. Thereafter, curvilinear improvement in communication occurred with all three partners.
Conclusions
Results are consistent with both hypotheses, with two minor exceptions. First, although the AAC intervention was associated with improved communication with each partner, growth appeared to begin only after the SLP intervention was initiated. Second, the fastest growth occurred with the mother-delivered AAC intervention. Thus, AAC tech-nology functioned according to design, family members proved able to deliver AAC treatment, and evidence sup-ported expanding the testing of this AAC language-based system. Although not reported here, these findings have been replicated in a larger, school-based sample (Chen, Hill, Ridenour, Sun, Su, Chen, 2015).
MMTA models replicated the observed data well and provided proof-of-concept information regarding mecha-nisms of intervention effects. Replicating previous com- parisons between statistical techniques, MMTA proved to be viable with few study participants and observations (Ri-denour et al., 2013). For example, these data were much too sparse for USEM or time series analysis.
Documenting treatment efficacy and effectiveness in the field of AAC is challenging. One central barrier is showing
that gains in speech and language skills are due to the treatment rather than maturation. Another substantial barri-er is the hetbarri-erogeneity of the population needing AAC interventions, thus making accumulation of small sample or N-of-1 studies useful to advancing the evidentiary base to guide clinical practice.
Compared to traditional visual inspection methods, MMTA models provide rigorous evidence to answer a question often posed by third-party payers, “are the results due to treatment or merely the child’s maturation?” Data clearly show that AAC clinical services are warranted, especially in light of the lack of clinical progress over the six months preceding the study. Clinical services to train family members add significant value to payment for AAC treatment, since time spent on training family members helped to achieve the targeted communication outcomes without requiring the SLP to conduct all the sessions needed for progress (saving costs and increasing dosage). Finally, the child had unique co-morbidities related to his speech-language disorder that demonstrated the challenge of using RCTs for investigating AAC treatment.
Study 2: Randomization with Multiple
Baseline Design Using MMTA and USEM
BackgroundUsing a wheelchair for extended periods can lead to pressure sores, muscle spasms, altered blood pressure and flow, joint problems, muscle contractures, and painful discomfort. The team at the Human Engineering Research Laboratories has developed a series of devices to assist people with physical disabilities (Cooper et al., 2006; Cooper et al., 2010; Ding, Cooper, Pasquina, & Fici- Pasquina, 2011). The Power Seat (PS) was designed to re- lieve discomfort due to sitting in a wheelchair in one posi-tion for extended periods by allowing users to adjust wheel- chair positioning (Dicianno, Mahajan, Guirand, Cooper, 2012; Ding et al., 2010; Lacoste, Weiss-Lambrou, Allard, & Dansereau, 2003). Positions range from traditional 90 de-gree angles to nearly supine using adjustments to the foot-rest, seat bottom, and seatback. However, during a pilot study, PS users largely failed to comply with prescribed PS usage but rather relied on infrequent and small angle ad-justments to their seating position; they also continued to complain of pain and discomfort (Ding, et al., 2008; Lacoste, et al., 2003).
Two contributors to poor adherence were hypothesized: (1) confusion regarding PS usage and (2) neglecting to use the PS due to forgetting, failing to self-monitor discomfort levels, or low ‘buy in.’ To improve adherence, an extended education/assistance program was devised to improve understanding of PS functioning (termed Instruction). A second intervention, termed Virtual Coach, consisted of computer-delivered reminders to mindfully monitor physi-cal discomfort level at the proscribed intervals and alter PS
39
Note: “0” on the x-axis (also location of vertical dotted lines) denotes the end of baseline phases and beginning of intervention. Figure 3. Observed Power Seat Compliance Rates from Study 2
Compared to Baseline, both the Instruction and Virtual Coach interventions were hypothesized to be associated with (a) greater compliance with proscribed PS usage, (b) reduced discomfort, and (c) increased frequency of PS us-age and duration of large angle (>15°) positions (the theo-rized mechanisms of discomfort relief).
Methods
Participants. Consistent with the IRB-approved protocol, participants were recruited from the Pittsburgh region at an assistive technology clinic and a Veterans Administration wheelchair seating clinic by their clinicians. Interested cli-ents were introduced to a study investigator to provide ad-ditional information, answer questions, and administer in- formed consent. Inclusion criteria were: 18 years of age or older; use of a medically-necessary, electronic powered wheelchair; the client’s sitting surface could be examined daily for redness or pressure ulcers either by the client or another individual; no active pelvic, gluteal or thigh wounds nor a pressure ulcer in these regions within the past 30 days; and no more than 5 days of hospitalization in the previous month. The resultant sample (N=16) was 43.8% female; had a mean age of 51.5 years (SD=12.4 years); was 25% African-American and 75% Caucasian; weighed a mean 196 lbs (SD=43 lbs); was a mean 5’7” tall (SD=3”); 62.5% and 56.3% used a computer or smart phone, respec-tively; and had been using a wheelchair for a mean 22 years (SD=15 years).
Instrumentation. PS usage (adjustment frequency, large changes in PS angles) was recorded by the PS computer. At the end of each study day, discomfort levels were measured using the Tool for Assessing Wheelchair disComfort (TAWC) (Crane, Holm, Hobson, Cooper, Reed, & Stadelmeier, 2004; 2005). The TAWC queries General Discomfort using 13 broad summary statements regarding how a client feels while sitting in his/her wheelchair (e.g., I feel poorly positioned, I feel uncomfortable, I feel good) on a 7-point Likert scale. It also queries Discomfort Intensity at that moment using a 10-point Likert scale for 7 specific body parts and additional body parts that could be added by the respondent. The TAWC has adequate test-retest relia- bility, internal consistency, and concurrent validity (Crane et al., 2005).
Study design. A multiple baseline design was used (14- or 18-day baseline phases). At the start of baseline phases, an introduction and demonstration of PS use was provided to participants. At onset of intervention, participants were randomized to receive either Instruction (n=10) or Instruc-tion plus Virtual Coach (n=6). IntervenInstruc-tion phases lasted 50 days. Autoregressive lag(1) was the best fitting error covariance structure for all participants.
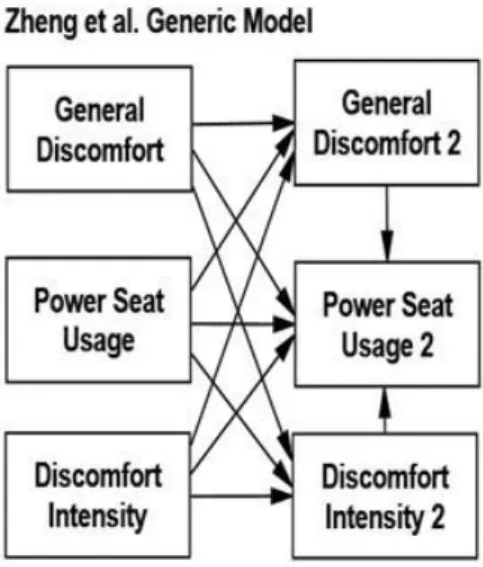
Three competing models were tested (Figure 2). The Autocorrelation Only Model implied that discomfort and PS usage could shift in mean level among study phases and that no variable affected any of the others from day-to-day. The Generic Model, based on Zheng et al. (2013), implied
was associated with changes to every other variable on the next day. The Cooper & Liu Next-day Model, based on hypothesized effects of the Instruction and Virtual Coach interventions, implied that levels of PS usage changed day-to-day in response to discomfort levels. After identify-ing the best fittidentify-ing model, its parameter values were tested for moderation by study phase (Baseline vs. Instruction vs. Virtual Coach).
As mentioned earlier in Unified Structural Equations Modeling, these competing models had to be compared while accounting for clustering of data within study phases and individuals. The subset of data from each individual’s two phases were analyzed as if they were collected from a separate sample. In other words, two USEM models were estimated per individual (one for his/her baseline data and a second for the intervention phase data) and the full sample was analyzed as if model estimates were aggregated from 32 subsamples. To compare fit among the Autocorrelation, Zheng, and Cooper & Liu competing models, correspond-ing parameters from the 32 subsamples of data were fixed to be equal. Then, once the best fitting of these three mo- dels was determined, moderation of that model by study phase was tested by freeing the corresponding parameters to be specific to each study phase (Baseline parameters versus Instruction parameters versus Virtual Coach parameters).
Results
Study data consist of 1,067 observations. During Base-line, only 2.8% of observations were missing; 7.0% were missing during intervention phases. Visual inspection of compliance rates for the study duration (Figure 3) suggests equivalent rates of compliance during Baseline phases of the Instruction and Virtual Coach subgroups whereas Instruction phase compliance rates appear to be less than the Virtual Coach phase. However, the large within-person variability obscures visually pinpointing mean levels, trends, size of differences among phases, whether such differences are statistically significant, and any effect that autocorrelation has on data.
The best fitting MMTA model for predicting compliance was 24.54 + 0.001(per study day)2 + 1.65(hours of wheel-chair occupancy) + 36.18 (if got Virtual Coach) – 0.77 (if got Instruction) – 0.02 (per Instruction phase day). Thus, compliance rates differed considerably between Instruction and Virtual Coach. Also tested, but failed to reach p>.05, were (a) change in compliance over time during Virtual Coach and (b) whether subgroups differed during Baseline. The model’s predicted compliance rates correlated with observed compliance rates r = 0.598 (p<.001). These re- sults suggest that after controlling for time (e.g., due to practice) and how long an individual sat in a wheelchair per day, Virtual Coach more than doubled compliance rates (60.72% vs 24.54%) on average compared to baseline whereas compliance lessened slightly per day of Instruc-tion.
41 Table 2
Discomfort Outcomes and Mechanisms of PS Intervention: Differences Among Study Phases from MMTA STUDY PHASE
Variable Mean Standard Deviation
Cohen’s d Com-pared to Baseline BASELINE (244 observations)
General Discomfort 41.9 12.39 n/a
Frequency of Use 2.1 2.36 n/a
Duration of Large Angle Use 50.8 44.78 n/a
Discomfort Intensity 19.2 9.52 n/a
INSTRUCTION (561 observations)
General Discomfort 42.6 13.01 - -
Frequency of Use 1.5B 2.09 -.28
Duration of Large Angle Use 37.6B 46.02 -.29
Discomfort Intensity 19.9 9.36 - -
VIRTUAL COACH (262 observations)
General Discomfort 42.3 10.81 - -
Frequency of Use 3.3B,I 3.02 .44
Duration of Large Angle Use 67.4B,I 45.73 .37
Discomfort Intensity 10.7B,I 5.52 -1.10
Note: BSignificantly different from Baseline (p<.001).
I
Significantly different from Instruction (p<.001).
For Cohen’s d, the benchmark for small effect=0.2, medium effect=0.5, and large effect=0.8 (Cohen, 1988); negative Cohen’s d indicates a lower level than Baseline.
Table 3
USEM Tests of Intervention Mechanisms in Power Seat Relief from Discomfort Fit Statistics Autocorrelation
Only
Zheng et al Generic
Cooper & Liu Best Fitting Model, Freed to VaryB
Next-dayA Power Seat Usage Frequency
2 20,517.6 20,454.1 20,394.0 19,586.4
df 579 574 575 537
AIC 20,547.6 20,494.1 20,432.0 19,700.4
BCC 20,563.4 20,515.2 20,452.1 19,760.5
Power Seat Large Angle Duration
2 719,813.5 404,585.3 386,618.0 389,717.0
df 579 574 575 537
AIC 719,843.5 404,625.3 386,656.0 389,831.0
BCC 719,859.3 404,646.4 386,676.0 389,891.2
Note: Lesser values indicate better fit to data for all fit statistics. Underlined cell entries indicate best fit to the data com-pared to competing models.
ACooper & Liu’s Next-day model was the best fitting model for both measures of Power Seat Use. B
Table 4.
Standardized Coefficients of Best Fitting Unified Structural Equations Models for Day-to-Day Relief from Discomfort
Frequency of PS Use Duration of High Angle PS Use
Path Baseline Instruction Virtual Coach All Phases Aggregated
GD1 with DI1 .67 .40 .66 .22 GD1 with PS1 .48 .57 .41 .28 PS1 with DI1 .09 .11 .51 .05 Au to co rr elatio n GD1 to GD2 1.00 1.00 1.00 1.00 PS1 to PS2 .71 .46 .51 .70 DI1 to DI2 .99 .99 .98 .99 GD1 to PS2 .74 .58 -.36 1.10 GD2 to PS2 -.39 -.09 .38 -.54 DI1 to PS2 -.60 -.24 .90 -.88 DI2 to PS2 .28 .12 -.38 .67
Note: PS=Power Seat. GD=General Discomfort. DI=Discomfort Intensity. 1= first day. 2=subsequent day. B
Significantly different from corresponding Baseline path using a critical ratio test (p<.01).
I
43 Table 2 presents MMTA efficacy estimates. Compared to Baseline, Virtual Coach was associated with increased frequency of PS use (2.1 vs 3.3) and greater large-angle PS use. In contrast, during the Instruction only phase, PS usage was less than Baseline. In terms of efficacy, general discomfort was statistically equivalent among phases whereas discomfort intensity was statistically less during Virtual Coach – by more than an entire SD (Cohen’s d = -1.10). Estimates were consistent with MMTA compliance results.
Table 3 presents fit statistics comparing the competing USEM models. Results consistently suggested the Next- day model best fits the data for both PS adjustment frequency and large-angle PS usage. Freeing parameters to differ among phases further improved fit to the data only for PS frequency.
Table 4 presents the path coefficients per study phase. Day 1 covariance between frequency of PS use with discomfort intensity was null during Baseline (.09), about the same during Instruction (.11), but greater during Virtual Coach (.51). Other associations between discomfort and PS use frequency were also moderated among study phases after controlling for the first day associations. Similar to the Virtual Coach’s greater coupling between PS use frequency and discomfort intensity for Day 1, this coupling was even greater from Day 1 to Day 2 during Virtual Coach (.90) compared to the other study phases (-.60 and -.24). Also consistent with Cooper and Liu’s hypotheses, the strong association between general discomfort on Day 1 with PS usage the next day (.74) was weakened and reversed during Virtual Coach (-.36), but not during Instruction (.58). Conclusions
Compared to Baseline, Virtual Coach was associated with (a) improved compliance, (b) large reduction in discomfort intensity, and (c) greater coupling of PS use with discomfort intensity. During Instruction, PS use was more correlated with general discomfort, but not changes in PS usage (PS usage was less than Baseline) or discomfort intensity.
Thus, PS appears to relieve wheelchair discomfort intensity using Virtual Coach at least in part because of improved adherence. This study did not include a Virtual Coach intervention without Instruction. Based on the poor results associated with Instruction, it is reasonable to credit Virtual Coach with the outcomes. Yet, without Instruction, Virtual Coach efficacy may not have been as large (e.g., Instruction may prevent confusion or reinforce Virtual Coach).
Many barriers preclude using RCTs to research treatment for wheelchair users. The population is small and hetero-geneous. Also, transportation complications and health conditions impede their research participation. Funding for RCTs is lacking. Moreover, clinicians in rehabilitation and assistive technology are trained to care and value
individu-al’s needs and outcomes (as opposed to population averages). Compared to RCTs, ICTs are more compatible with clinical milieu, interfere less with patient “flow,” and offer evidence with more direct clinical interpretation and application (Graham, Karmarkar, & Ottenbacher, 2012).
Results from MMTA and USEM provide more sophisticated information about interactions among study
variables, their sequencing, and greater rigor than traditio- nal data analysis methods for ICTs (Gabler et al., 2011; Smith, 2012). Sensor and mobile computing technologies have become more reliable, user-friendly, and widely applied for repeated measurements of real world phenome-na. Coupling ICTs with sensor and mobile computing technology to collect data and MMTA and/or USEM repre-sent a qualitative advance in researching rehabilitation and assistive technology (Furberg et al., 2017).
Discussion
Like numerous healthcare specializations, psychology benefits from a rich tradition of clinically-informative research, consistent with the Boulder Scientist-Practitioner Model (Baker, Benjamin, & Ludy, 2000). Also resembling healthcare, small sample and within-person studies were critical in seminal research by preeminent scientists including Gustav Fechner, Jean Piaget, Alexander Luria, and of course behaviorists such as B.F. Skinner (Sidman, 1960; Smith, 2012). However, the fall in prominence of behaviorism and the corresponding rise in perception of RCTs as the lone gold standard for testing clinical interven-tion have in turn diminished both the use of ICTs and production of the types of clinical discoveries that RCTs cannot generate (Franklin, Allison, & Gorman, 1997; Gabler et al., 2011; Kratochwill et al., 2010; Molenaar, 2004; Smith, 2012).
Results herein demonstrated that nontraditional combi-nations of within-person experimental designs with rigor-ous statistical analyses for small samples can fill critical gaps in evidence-based clinical research especially for pilot studies (Ferron et al., 2010; Kratochwill, et al., 2010; Ridenour et al., 2013; Smith, 2010; Shadish et al., 2008). Specifically demonstrated was that USEM and MMTA coupled with subject-as-own-control designs and time series data provide powerful techniques for testing inter-vention mechanisms. Being able to employ combinations of features from ICTs and RCTs is especially valuable in light of emerging emphases by research funders to understand mechanisms of treatment and prevention, precision medi-cine, and value-based healthcare (Fishbein et al., 2013).
Juxtaposing Study 1 vs 2 illustrates benefits of the availability of multiple analytic techniques for ICT data. In Study 2, MMTA ruled out a time-related trend in compli-ance for Virtual Coach whereas a slight time-related reduc-tion in compliance was observed during Instrucreduc-tion. In contrast, USEM models quantified day-to-day changes and statistically tested competing, mechanistic models. Efficacy