54
WASTE FLOW ANALYSIS AND
DEVELOPMENT OF REGIONAL WASTE
MANAGEMENT SYSTEM
Ruta Bendere
Waste Management Association of Latvia, Latvia
The report discusses the present state of the elaboration andimplementation of a new solid waste management system in Latvia theoretically based on the existing waste flow analysis and optimization of economical and environmental parameters of waste management system. The main problems of waste management practice - from the involving of all the citizens into waste centralized collection to elaboration of economical and reliable waste collection and disposal schemes is discussed.
ln 1997 the Ministry of Environmental Protection and Regional Development accepted the project "National Municipal Solid Waste Management Strategy for Latvia" which regards the solid waste management as an integrated system. The overall objective of the project was to reduce contamination and environmental hazards from collection and disposal of municipal solid waste.
The main points of the Waste Management Strategy are:
• to collect more than 90% of municipal waste (must be implemented till the year 2002); • to involve more than 85% of inhabitants in the waste collection ( till the year 2005); • to stop dumping of waste (till the year 2005);
• to reduce the number of dumps for 50% (till the year 2000); • to reduce the number of dumps/ landfills to 50 (till the year 2007); • to establish 10 sanitary landfills and to close all others (till the year 2010); • to reduce the landfilling of waste for 20% (till the year 2005);
• to renew the waste recycling system , so that will be possible to reuse 75% of glass and plastic bottles from beverages (till the year 1998);
• to collect separately more than 50% from municipal hazardous waste (till the year 2005):
• to establish the economical stable system for separate waste collection and treatment (till the year 2002).
For the implementation of this scheme it is necessary to reveal the real situation in the local areas and to elaborate such waste management projects, which can be realized in the next years according the local economical and technical requests and possibilities. One of the way -how to select the more suitable waste collection, transportation and disposal scheme, is to use
3. 4. 7. 4. 3-5 9.
ECOLOGICAL TECHNOLOGY AND MANAGEMENT KALMAR, SWEDEN, September 22-24, I 999
the results of the optimization of mathematical models of waste management calculated by the special program created by our specialists. Comparison of common expenses and environmental effects of each component of waste scheme obtain the best solutions. Cost -benefit analysis of the waste management schema was conducted using the local conditions, e.g., amounts of produced waste, local labor rates, fuel prices, construction costs, etc.
The estimation of the amounts of produced waste by diferrent producer's categories is the basis for planning and development of waste management and forms the netscape of data basis for calculation program. However, inventory of the rates of waste accumulation in Latvia has not been regular and systematic. Episodic surveys and studies can give only crude estimates of annually stored waste amounts ( see table I) and its composition (see table 2).
Table I.
Amount of Municipal Waste for Different Municipalities
Population Total waste Amount of waste
No Municipality quantity, per capita, m3/ / year.
m3 I year 1. Riga 821 180 1 107 333 1.35 2. Gulbene 16 000 10 505 0.76 5. Saldus 17 000 15 600 1.34 Jurrnala 59 125 68 103 1.15 Valka 6 900 9 109 1.23 6. Liepaja 97 884 160 013 1.63 8. Jelgava Bauska 70 960 10 858 94 010 13 069 1.32 1.20 9. Talsi 12 828 8 515 0.66
Table 2.
Composition of Household Waste in Riga from 1985 - 1995
No Type of waste Density, Percentage of total Data range,
kg/m3 amount,% %
1. Glass 400 8 4-12
2. Paper 130 14 10-18
3. Cardboard 150 2 1 - 3
5. Plastics Food waste 450 60 36 6 18-44 4 - 8
6. Garden waste 300 18 16-20 7. Metals 180 4 8. Rubber 200 1 0-2 Textiles 180 4 2-6 10. Others, combustible 420 3 1-6 waste
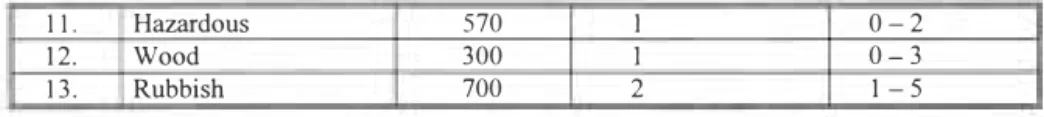
11. Hazardous 570 I 0-2
12. Wood 300 I 0-3
13. Rubbish 700 2 1-5
Therefore, the development of the real plan for waste collection, recycling and storage first requires the determination of main solid waste producers, and the amounts of waste produced. Depending on the composition of produced waste, the producers of municipal solid waste were grouped into three categories: domestic ( apartment hauses, one family
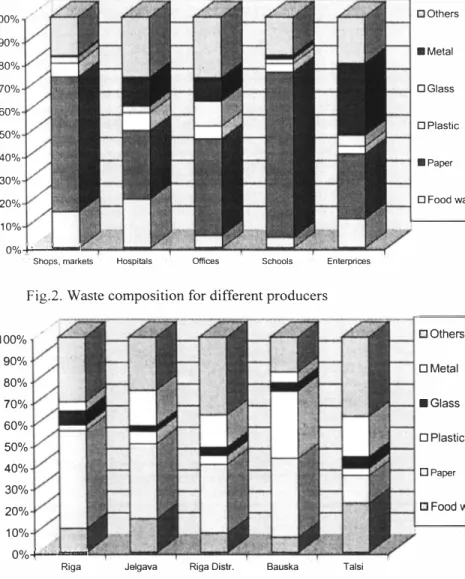
hauses, farms); and the service and manufacture sectors. For the creation of data bases for the elaboration of local waste management projects, the existing date of localization of district waste producers, roads, collection sites and other suitable information were collected from local authorities. Additional information was collected using questionnaires and local investigations. It reveals that the domestic sector produces mainly food, glass and paperwaste as it is shown on the fig. I, , while the service and manufacturing sectors produce mostly paper, metal and specific waste types depending of their profil (fig. 2 and fig.3 ).
100% 80% 60% 40% 20% 0%
□
Others■
Metal□
Glass□
Plastic■
Paper□
Food waste Riga Jelgava Riga distr. Bauska TalsiECOLOGICAL TECHNOLOGY AND MANAGEMENT KALMAR, SWEDEN, September 22-24, 1999
□
Others 100% 90%■
Metal 80% 70%□
Glass 60%□
Plastic 50% 40%■
Paper 30%□
Food wa, 20% 10%Fig.2. Waste composition for different producers
0%4-'---Shops, markets Hospitals Offices Schools Enterprices
100% 90% 80% 70% 60% 50% 40% 30% 20% 10%
0%+---Riga Jelgava Riga Distr. Bauska
□
Others□
Metal■
Glass□
Plastic□
Paper□
Food w TalsiFig. 3 Solid waste composition produced by offices and enterprises in different municipalities
In the surveyed cities of Latvia, the annual production of domestic refuse per capita ranges from 160 kg in the Vidzeme borough of Riga to 80 kg in the city of Talsi. About 30 % of the total collected amount of annual municipal waste is produced by the manufacturing and service sectors (see the table 3).
5.
Tab! e 3 Part of Total Amount of Municipal Waste for Different Producers
No Municipality Households, Enterprises and offices,
% by weight % bvweight I. Riga Distr. 66.2 33.0 2. Bauska 77.9 22.a1 3. Talsi 60.4 39.6 4. Jelgava 70.5 29.5 Riga 76.2 23.8 Average 70.2 29.8
The mathematical project description contains:
I. Mapping of the household and industrial waste production in the local district area (dates of the produced waste volumes and content by the main producer's groups, their localisation).
2. Dates of the collection rates, used containers, characterisation of the vehicles used for the collection and transportation.
3. Evaluation of the waste disposal possibilities (composting of waste; recycling of paper, glass, metal, plastics; volumes of final disposal).
4. Elaboration of the waste management schemes for urban and rural areas including waste collection from private farmers, apartment houses, individual homes using local collection points and transfer stations.
5. An economical evaluation of elaborated schemes.
6. Mathematical description of the waste collection and haul.
The optimization of different waste collection and hauling models was mathematical conducted on the basis of cost comparison (cost per unit weight of waste collected and disposed). The unit cost was composed of amortized capital component and of operating expenses. For the analysis, the current cost of the existing collection and hauls systems was equated to the estimated cost of collection and haul for an alternative system (for example that includes a transfer station). In this case haul distance serves as the key variable in determining the breakeven distance from the potential new transfer station to the existing cost of collection and of haul, including amortized capital cost, operating cost of the new transfer station and hauling subsystem; the capacity and payload of the transfer vehicles; fuel usage and cost; driving speed; and quantities of waste collected and hauled.
The results of the calculation (see fig. 4) reveals that the time involved in transporting of solid wastes over long distances, combined with the lack of transfer stations, can have a significant negative impact on the total cost of collection. In situations where distances from collection point to disposal site overcomes 20 km or more the total cost of collection and haul can be on the order of 50-% to 100% higher than that of a system that incorporates one or more transfer stations into it. Real coast data depends on collection vehicles capacity (they are lower for high pressing transport), density of population (decreases in high population areas) and used containers volume (increases for small containers).
--_.-��--- -""'
ECOLOGICAL TECHNOLOGY AND MANAGEMENT KALMAR, SWEDEN, September 22-24, 1999
� iii
"' 28 ....i_ 26 :C 24 --� 22 � 20 --- -� 18 ---�---� --� C '16 4 �E
I2f,-:::::;�:::=����-=--.-,--==�::=!:� '6 IO,u
8 6 4 2 0 0 10 20 30 40 50 60 70 80 90 Distance to disposal, kmFig,4, Evaluation of the collection expences per ton of solid waste for different distances to disposal site and collection conditions.
Despite the fact that the implementation of a transfer system offers potential cost savings over the long term, the system requires additional investments, such as the construction of a transfer station and handling equipment The capital investments that are typically necessary to implement a transfer system includes, but are not limited to: land, structures, utilities, and equipment In addition to the capital investments the transfer system will have operational expenses, including maintenance, for both the transfer station and for the hauling of transferred waste to the disposal site. The savings in total cost are due primarily to the shortened haul distance from the collection area to the disposal site, since a transfer station has been substituted for the disposal site and the fact that collection vehicles as opposed to transfer vehicles are not suited for, nor are they technically or financially efficient in long-haul, high speed applications, Also, in some cases an increase in payload per vehicle, in vehicle waste density, or both can be realizes since transfer vehicle volumetric capacities can be several times that of collection vehicles and the wastes can be compacted at the transfer station using compaction equipment
It is widely believed that a stimulating factor for recycling is cheaper costs of material and more profit from manufactured goods, However, economic analyses have shown that, within the existing legislative and tax system in Latvia, it is economically feasible to recycle only a small portion of the waste. Therefore, for the most part, it is cheaper to transport the waste to the nearest landfill, since organisation of sorted waste collection is associated with additional costs. Economic estimates in the Riga District and Talsi City showed that the costs of sorted collection and initial treatment (for example, crushing or cleaning) were about 30 to 70 USD per ton of prepared recyclable material. Since the selling price of recyclable material is less than the cost of centralised collection, national level subsidies and investments are necessary to provide an infrastructure for integrated collection, sorting and initial treatment that will support the economical stability of waste management.
The recycling of metal. paper, glass and polyethylene plastics on a large scale is potentially economically feasible in Latvia, as the amounts of these types of waste are sufficient for industrial re-manufacture , or there are suitable treatment facilities. The least expensive and simplest form of waste treatment in our country is composting of organic waste (up toSO% by weight of the domestic waste). Economic assessments in the Riga District and Talsi District have shown that the cost of composting in Latvia is about IO USD per ton of produced compost ( using open area technologies).
If a transfer station is constructed and operated as part of solid waste management system, it opens up the possibility of establishing a combined transfer station/resource recovery facility. The main objective of the resource recovery portion of the facility would be to recover materials that would be used near the facility (i.e., recyclable materials, and organic matter). Therefore. only those materials that have no market or use would have to be transferred for long haul and disposal. The implementation of a system of this type would lead to additional cost savings since less waste would ultimately be hauled from the transfer station to the disposal site than in the case of no recovery resources. In the case of calculated projects additional composting and waste recycling will save more then 30% of expenses for waste collection and disposal.
The first pilot projects implemented in practice the main ideas of the Waste Management strategy were the projects for waste management of the North Vidzeme region (with 200 000 inhabitants) and for Talsi District (with SO 000 inhabitants). The Talsi district project was governed by Waste Management Association of Latvia and elaborated by our specialists. During the time from January to June 1998, were created the basic principles and guidelines for the practical establishment of the project.
There for the 50 000 inhabitants of Talsi District were offered such scheme for waste collection and disposal
I. The landfill with the capacity of SO 000 m3 / year built near Talsi town at the suitable place
according all the demands of EC directive can be used as the sanitary landfill for the whole Talsi District (landfill is located in the central part of the district).
2. In the East. South, and West directions (Roja, Dundaga and Abava municipalities) which are located from 20 to 40 km from the landfill site, will be created three waste collection and transfer stations.
3. The transfer stations. instead of local dumping sites, will receive the separately collected biowaste for composting and solid waste for recycling. The unseparated waste mass will be placed in the deep underground containers and stored for the transportation to the Talsi landfill.
4. Talsi waste company will take care of the waste disposal in the landfill and hauling from local transfer sites; local companies will collect the waste from local territories and operate in the transfer stations.
Today the first transfer station in Roja is under construction. The first step of implementation of waste management strategy has been done.