Graph Analysis of Word Networks
Lars G Bagøien Johnsen
Department of Research and Dissemination
National Library of Norway
lars.johnsen@nb.no
AIMS
In this talk we present how semantic connections between words can be visualized and represented as graphs created from word networks (e.g. Turney and Pantel 2010), using concepts and methods from graph theory (e.g Chakrabarti and Faloutsos 2012). Graphs have a visual as well a formal structure, and we explore how clustering seen in visualizations can be analyzed and represented. For that purpose we will look at clustering mechanisms for graphs, and discuss their interpretation in the context of word meanings.
RESEARCH QUESTIONS
One question that is addressed is how textual raw data can be transformed into structures that somehow represent knowledge of language, and partially also reflect the external significance of language, i.e. how structures are mapped to the world around us. In particular, the search for how graphs may be interpreted and put to use in the analysis of language and literary works, ranging from the disambiguation of particular words to semantic fields represented as a collection of words.
METHODS
Graphs are constructed from word vectors. While there are several ways of constructing words that goes together, we consider vectors made from coordinative construction in Norwegian, constructions like ost og kjeks (cheese and biscuits). Coordination structures introduce a certain semantics right from the start – two words are coordinated if they share something in the context in which they are uttered (or written). Each coordination is assigned a particular weight computed from its frequency, in the form of pointwise mutual information (PMI). The computation is done with basis in the corpus (the digitized texts from the Norwegian National Library). Using a relevance measure like PMI ensures to a certain degree that the selected trigrams of conjunctions are full phrasal words, i.e. that the words seen in the coordination are the words coordinated and not the start or end of a phrase.
A word vector V for a given word w, then contains all the words w is coordinated with, and yields a set of word pairs (w, v) for v in V. These word pairs constitute the basis graph for w, where the whole graph is created by collecting similar word pairs for each v in V. A graph for w is then constructed from edges like w→ v where the process is repeated for each v. Which word pairs to use are determined by their PMI, so that all words coordinated with ost
(cheese) for example, satisfying the cutoff point, constitute word vector for ost. An
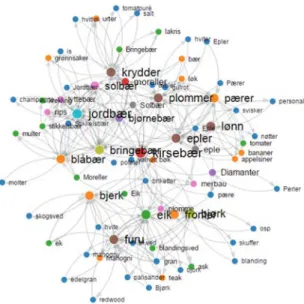
example graph is provided in figure 1 for the word kirsebær (cherry).
Graphs are created using the Python programming language using the module networkx (NetworkX (2016)).
For the analysis, we rely on two key properties of graphs, (1) their clique structure, which consists of subsets of the graph where all nodes are connected to each other, and (2), communities which consist of a partitioning of the graph. Each of these carries information about the sem-antics of the words that make up the graph.
MAIN FINDINGS
Consider the graphi depicted in Figure 1,
constructed as described above from the word form kirsebær (cherry), displaying some of words related to it. From its visual appearance a couple of word groups are apparent. There is an upper area with
inter-Fig 1: Coordination graph for kirsebær (cherry)
connected elements containing berries, and the lower area containing wood types, in addition to other accidental readings and connections for some of the words.
Clustering from clique structure, using the k-cliques (Chakrabarti and Faloutsos ibid), creates a hierarchy of word sets, ordered by set inclusion. The actual clustering corresponds to the denseness seen in the visual layout. The words building the hierarchy are typically well interconnected and the method may not give any result if the graph is sparsely populated, or for those parts of the graph which do not have interconnected nodes. However when there are enough nodes, the methods finds different readings of words and separate them into groups of similar words. For example, a 4-clique from the graph in figure 1 is yielding one five element list bjerk, bjørk, furu, kirsebær, and eik, illustrating the wood reading (different kind of trees), while the berry (or fruit) reading comes from a 7-clique (as well as lower n-cliques) with the seven element list kirsebær, plommer, jordbær, bringebær, moreller, solbær and bjørnebær. All the k-cliques elaborate one of these readings in the hierarchy of sets.
A community analysis on the other hand is using the distance measure between nodes and usis the whole graph. The main difference from k-cliques is that the community analysis creates a partition of all the nodes instead of a hierarchy. However, the different partitions typically contain related words. We illustrate with parts of two sets that complement the k-clique analysis, with a berry reading (containing 22 entries): {bringebær, jordbær, moreller, solbær, kirsebær, … }, and a wood reading (25 entries): {bjørk, eik, ask, teak, …}.
The main finding is that both k-clique clusters and community detection may be used to find different meaning levels for words, and that k-cliques are in general more conservative with a high precision, while community detection in general creates partitions that covers the whole graphs.
RELEVANCE TO WORKSHOP THEMES
The work described here is especially relevant in the themes of defining Digital Humanities, in particular how computational methods change the way we study and form qualitative knowledge out of quantitative information (see also Turney and Pantel ibid.), as well as the interdisciplinary aspects of using methods from different fields like linguistics (word meanings), mathematics (graph theory) and social sciences (network methods on graphs).
REFERENCES
Deepayan Chakrabarti and Christos Faloutsos 2012. Graph Mining, Morgan & Claypool Publishers. NetworkX (2016). https://networkx.github.io/
Turney P.D. and Pantel P. 2010. From frequency to meaning: vector space models of semantics. Journal of Artificial Intelligence Research, 37:141–188.
i This graph and others like it can be studied interactively online, together with a list of k-cliques, at:
http://www.nb.no/sp_tjenester/beta/ngram_1/galaxies#terms=kirseb%C3%A6r