99: 13 D. BARTLETT, P. DRAKE, L. LlNDBORG, H. KLElN, TH. SCHMITZ AND M. TICHY
Determination of the Neutron and Photon
Dose Equivalent at Work Places in Nuclear
Facilities of Sweden
An SSI - EURADOS comparison exercise. Part 2: Evaluation SSI Rapport
AUTHORlFORFATTARE: D. Bartiett, P. Drake, L. Lindborg, H. Klein, Th. Schmitz and M. Tichy
DIVISIONfAVDElNING: Environmental Measurements and DosimetrylAvdclningen for miljoovervakning och matning.
TITlEITITEl: Determination of the Neutron and Photon Dose Equivalent at Work Places in Nuclear Facilities of Sweden. An SSI - EURADOS comparison exercise. Part 2: Evaluation.
SUMMARY: Various mixed neutron-photon fields at workplaccs in the containment of pressurised water reactors and in the vicinity of transport containers with spent fuel elements were investigated with spectrometers and dosimeters.The spectral neutron fluences evaluated from measurements with multisphere systems were re-commended to be used for the calculation of dosimetric reference values for comparison with the readings of the dosemeters applied simultaneously. It turned out that most of the moderator based area dosemeters overestimated, while the TEPC systems generally underestimated the ambient dose eqUivalent (DE) values of the rather soft neutron fields encountered at these workplaces. The discrepancies can, however, be explained on the basis of energy dependent respon-ses of the instruments used. The ambient DE values obtained with recently develo-ped area dosemeters based on superheated drop detectors and with track etch ba-sed personal dosemeters on phantoms, however, were in satisfying agreement with the reference data.
Sets of personal dosemeters simultaneously irradiated on a phantom allowed to roughly estimate the directional dependence of the neutron f1uencc. Hence, personal and limiting dose equivalent quantities could also be calculated. The personal and ambient DE values were always conservative estimates of the limiting quantities. Unexpectedly, discrepancies were observed for photon DE data measured with GM counters and TEPC systems. The up to 50 % higher readings of the GM counters may be explained by a considerable contribution of high energy photons to the total photon dose equivalent, but photon spectrometry is necessary for final clarification.
SAMMANFATTNING: Dosekvivalenten har studerats pa nagra olib arbetsplatser dar saval foton-SOOl neutronstnilning forekommer. De platser som mretts har va-rit belagna innanfor inncslutningen till en tryckvattenreaktor samt nara en behal-lare med anvant karnbransle. Stralfalten har studerats saval med spektrometriska som med dosimetriska metoder.
Efter noggrann analys rekommenderadcs att neutronfluens-spektrerna bestamda med multisfarspcktrometrar skulle anvandas for berakning av de dosimetriska referens-varden, d.v.s de varden som de olika dosmiHarnas resultat skulle jamforas med. Det visade sig aH handburna instrument baserade pa moderering av neutronfluen-sen overskattade referensvardena, medan vavnadsekvivalenta proportionalraknare underskattade demo Detta kan forklaras med ledning av instrumentens energibero-ende for neutroner.
Ett nytt instrument baserat pa principen for "bubbel"-detektorn, liksom dosmatare baserade pa "track etch" tekniken, bestamde miljo- respektive person-dosekvivalenten med tillfredsstallande noggrannhet.
Persondosmatare placerade pa olika sidor av ett fantom besHimde neutronfluen-sells olika riktningskomponenter. Med den kUllskapen kunde sedan persondosekvi-valenten och skyddsstorheterna beraknas. Savai person- som miljodosekvipersondosekvi-valenten utgjorde konservativa uppskattningar av skyddsstorheterna.
Ovantat stora skillnader upptacktes mellan miljodosekvivalentvarden uppmatta med GM-rors baserade handburna instrument och vavnadsekvivalema proportio-nalraknare vad galler doskomponenten fran gammastralning. De upp till 50% ho-gre GM-rorsvardena kan sannolikt f6rklaras av ett vasentligt dosbidrag fran h6ga fotonenergier, men fotonspektrometriska resultat ar n6dvandiga f6r en slutligt klarlaggande.
Statens stralskyddsinstitut
Swedish Radiation Protection InstituteSSI rapport: 99:13 Juni 1999
Determination of the Neutron and Photon Dose Equivalent at Work Places
in Nuclear Facilities of Sweden
An SSI-EURADOS comparison exercise
Part 2: Evaluation
D. Bartlett·), P. Drakeb), L. LindborgC), H. Kleind), Th. Schmitzc) and M. Tichyfl
.) b) c) d) c) fl
National Radiological Protection Board, Chilton, Didcot, axon, aXil ORQ, UK Vattenfall AB, Ringhals, S-430 22 Variibacka, Sweden
Swedish Radiation Protection Institute, S-17116 Stockholm, Sweden Physikalisch-Technische Bundesanstalt, Bundesallee 100,
D-381l6 Braunschweig, Germany
Forschungszentrum J(jlich GmbH, KFA, D-52425 J(jlich, Germany Tristolicina 5, 1500 Prague, Czech Republic
1
Table of Contents
Page
1. Introduction ... 2
2. Evaluation of the Spectral Neutron Fluence ... 4
2.1 Comparison of the Data Submitted ... 5
2.2 Additional Unfolding ... 12
2.3 Selection of the Recommended Solution ... 39
3. Measurements with Tissue Equivalent Proportional Counters (TEPC) ... 48
4. Personal Dosemeters on Phantoms ... 60
4.1 Estimation of the Directional Characteristics of the Radiation Fields ... 60
4.2 Calculated Dosimetric Quantities ... 62
4.2.1 Calculation for Neutrons ... 62
4.2.2 Calculation for Photons ... 65
4.3 Comparison of Dosemeter Readings with Calculated Quantities ... 68
4.3.1 Comparison for Neutron Measurements ... 68
4.3.2 Comparison for Photon Measurements ... 70
5. Comparison of all Dosimetric Data ... 74
6. Conclusions ... 88
2
1. Illtl"Oductioll
In collaboration of EURADOS working groups #7 and #10 with the Swedish Radiation Protection Institute (SSI) the mixed neutron-photon radiation fields have been characterized at various places in the containment of pressurized water reactors in Ringhals and in the environment of a transport cask with spent fuel elements at the intermediate storage facility (CLAB) in Oskarshamn using spectrometers and dosemeters. Taking advantage of this unique occasion the results of various instruments of the same kind and those of different systems employed could be intercompared.
The results were submitted by the participants to the various evaluators according to the questionnaires distributed. The final reports of all participants were compiled in an external SSI-report [1].
Comparison of the spectral neutron fiuences obtained from Bonner sphere spectrometer a)
measurements already exhibited systematic differences. The integral fluence values deviated
not more than
±
5% from the mean, but for the corresponding integral dose equivalent valuesone data set systematically deviated by about 40 - 50% from a well defined mean of the other data (see section 7 of Ref. 1). These discrepancies were therefore the reason for a very detailed evaluation (see section 2).
Also the dose and dose equivalent data derived from the measurements with six different tissue equivalent proportional counters (one of them using the variance-covariance method) showed an unexpected large scatter of the results, in particular for the neutron dose equivalent values (see section4 of Ref. 1). A detailed analysis was necessary taking also into consideration the evaluated spectral fluence for a consistency check (see section 3).
The spectral fluence was also required when the directional dependence of the neutron fields was derived from the measurement with six personal dosemeters on ph<jntoms assuming a superposition of an isotropic and directional component with the same shape. In the case of personal dosemeters with spectrometric properties even different shapes could be used (see section 4).
3
Last, but not least, the dose equivalent reference values evaluated from the spectrometric
measurements are compared with the TEPCb
) results and the readings of various (ambient)
dose equivalent instruments employed. Also the various photon dose rates are compared in section S .
• ) The abbreviations BSS and BS are used in this report for Bonner spheres spectrometer and Bonner spheres, respectively.
4
2. Evaluation of the Spectral Neutron Fluence
Five groups participated with neutron spectrometers, four of them using Bonner spheres (BS) with active or passive thermal neutron detectors and one group employing proportional counters and a stilben scintillator for recoil proton spectrometry (RPS).
Table 1, however, shows that at maximum three different BSS's were used at five (of seven) positions while for the remaining two positions at least two different data sets could be compared for the entire neutron energy range from thermal to some MeV. The BS results were complemented by high resolution measurements performed at four (of seven) positions for neutron energies higher than 70 ke V.
Table 1: Neutron spectrometers employed in the containment of pressurized water reactors
in Ringhals and in the environment of a transport cask with spent fuel elements, located in the Intermediate Storage Facility (CLAB) at Oskarshamn.
Laborataory Spectrometer Ringhals CLAB
A F G L D E P
GSFlNeuherberg BS (LiI-scint.) x x x x x x x
IARfLausanne BS (cyI. 3He-pC)
-
x x x x x xNPUfeddington BS (Au-act. foil) x
-
-
-
-
-
-PTBIBraunschweig BS (spher. 3He-pC)
-
-
x x x x xKAIIRossendorf recoil proton det. x
-
-
x x x xThe evaluation was performed in three steps, first comparing the results as submitted, then applying a common energy binning for the spectral fluence, the response matrices and the fluence-to-dose-equivalent conversion functions before comparing and finally perfOlming an independent unfolding of those data sets regarded as reliable. (The original idea to construct a weighted average of all spectra measured had to be abandoned because the number of reliable results remaining was too low.)
5
2.1 Comparison of the Data Submitted
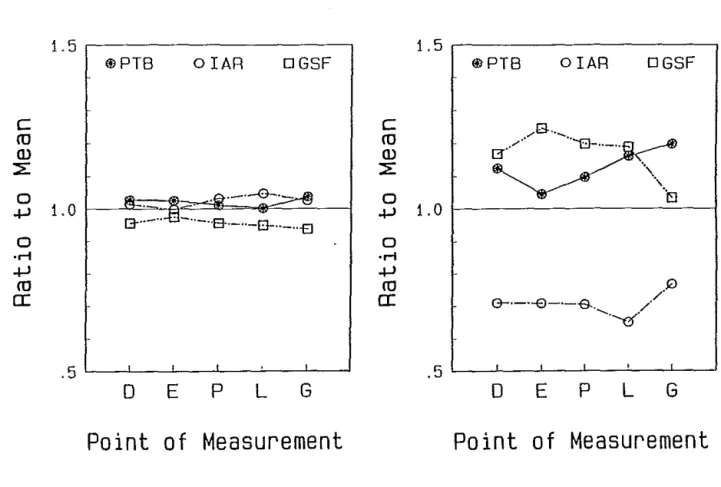
The neutron spectra and integral quantities are shown in Figure I (CLAB and Ringhals) and Table 2 as submitted by the participants.
Up to nine integral quantities are compared:
4 (5) supergroup fluences (the energy interval 10 ke V - I Me V was later subdivided in two supergroups),
the total fluence and
the total dose equivalent for three different conversion functions according to ICRP21 (H21, [2]), ICRU39 (H39, [3]) and ICRP60 (H60, [4])
These values slightly changed (Table 3) if a common data binning (49 bins for SAND 2 instead of 53, 44 or 47 groups used by PTB, GSF or IAR resp.) and the same conversion functions were applied (with the largest changes for H21, possibly due to different interpolation procedures used by the participants). The integral quantities were calculated by means of the TRESPE code provided by A.V. Alevra [5]. For the purpose of comparison with the high resolution data of KAI the group fluence was also calculated for the energy interval from 0.07 MeV to 2 MeV. Only these data will be used in the further discussion.
The measured spectra can be divided in two groups (Table 4):
a. The spectra measured at CLAB pos. P,D and E and at Ringhals in the lock to the
containment building (pos. L) are characterized by comparable fluence fractions in the thermal, the lIE and the fission part, but the major fraction of the DE is due to neutrons with energies above 100 keY.
b. The spectra measured in the containment building belong to rather soft fields with less
than 10% and 50% in fluence and DE, respectively above 100 keY. The thermal and epithermal fractions are prevailing.
The integral results of the three BSSs used at five positions are compared in Fig. 2. While the integral fluence never deviates by more than 10% from the mean value for all data sets, one set of DE data is systematically 40-50% lower than the mean of the two other data sets which are close together.
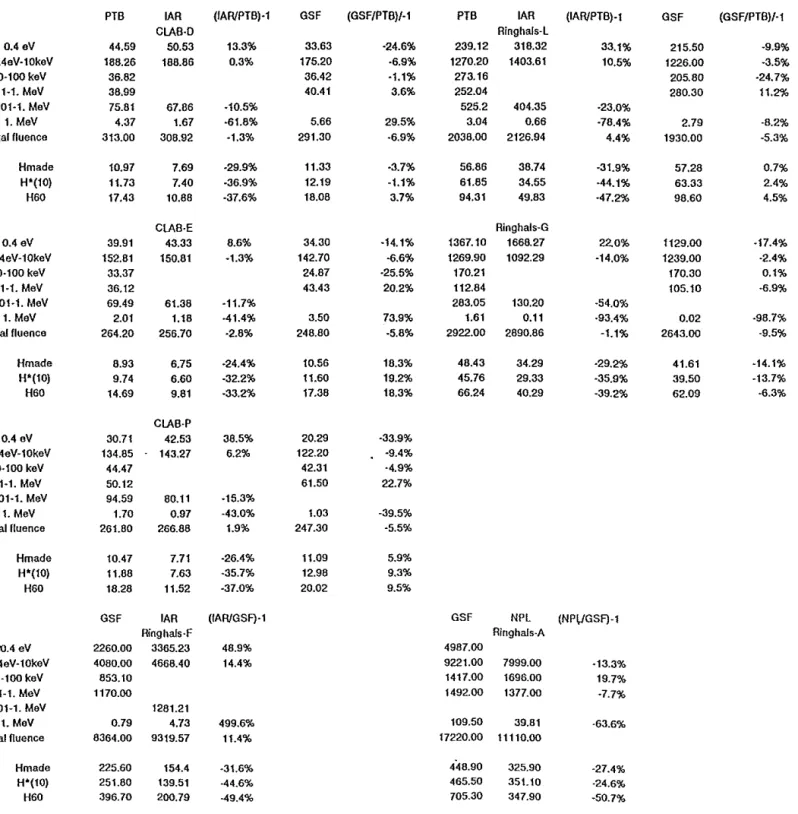
Table 2: < 0.4 aV OAeV-10keV 10-100 keY 0.1-1. MaV 0.01-1. MaV > 1. MaV total nuence Hmade H'(10) H60 < 0.4 aV OAeV-10keV 10-100 keY 0.1-1. MaV 0.01·1. MaV > 1. MaV (otal nuence Hmade H'(lO) H60 < 0.4 aV OAeV-10keV 10·100 keY 0.1-1. MaV 0.01-1. MaV > 1. MeV total fluence Hmade H'(10) H60 <\).4 aV OAeV-10keV 10-100 keY 0.1-1. MaV 0.01-1. MaV > 1. MaV total fluence Hmade H'(10) H60 6
Comparison of super group and total fluence rates [cm-' S-I] as submitted by the
participants for the measurements in the containment of pressurized water reactors in Ringhals (L, G, F, A) and in the environment of a transport cask with spent fuel element at the Intermediate Storage Facility CLAB in Oskarshamnn (D, E, P). The total dose equivalent rates [nSv/s] were calculated with fluence-to-dose equivalent
functions HMADE, H*(10) and H", according to ICRU 21 [2], ICRU 39 [3] and
ICRP 60 [4].
Comparison ofintegrai values as submitted by participants
PTB IAR
CLAB·D
(IAFVPTB)-1 GSF (GSF/PTB)/-l PTB IAR (IAFVPTB)-1 GSF (GSF/PTB)/-l
44.59 50.53 188.26 188.86 36.82 38,99 75.81 67.86 4.37 1.67 313.00 308.92 10.97 7.69 11.73 7.40 17.43 10.88 CLAB·E 39.91 43.33 152.81 150.61 33.37 36.12 69.49 2.01 264.20 8.93 9.74 14.69 30.71 134.85 44.47 50.12 94.59 1.70 261.80 10.47 11.88 18.28 GSF 61.38 1.16 256.70 6.75 6.60 9.81 CLAB·P 42,53 143.27 80.11 0.97 266.86 7.71 7.63 11.52 IAR Ringhals·F 2260.00 3365.23 4080.00 4666.40 853.10 1170.00 1281.21 0.79 4.73 8364.00 9319.57 225.60 154.4 251.80 139.51 396.70 200.79 13.3% 0.3% -10.5% -61.8% -1.3% -29.9% -36.9% -37.6% 8.6% -1.3% -11.7% 41.4% -2.8% ·24.4% -32.2% -33.2% 38.5% 6.2% -15.3% -43.0% 1.9% -26.4% -35.7% -37.0% (IAFVGSF)-1 48.9% 14.4% 499.6% 11.4% -31.6% -44.6% -49.4% 33.63 175.20 36.42 40.41 5.66 291.30 11.33 12.19 18.08 34.30 142.70 24.87 43.43 3.50 248.80 10.56 11.60 17.38 20.29 122.20 42.31 61.50 1.03 247.30 11.09 12.98 20.02 -24.6% ·6.9% -1.1% 3.6% 29.5% -6.9% ·3.7% -1.1% 3.7% -14.1% -6.6% -25.5% 20.2% 73.9% -5.8% 18.3% 19.2% 18.3% -33.9% -9.4% '4.9% 22.7% -39.5% -5.5% 5.9% 9.3% 9.5% Ringhals·l 239.12 318.32 1270.20 1403.61 273.16 252.04 525.2 404.35 3.04 0.66 2038.00 2126.94 56.86 38.74 61.85 34.55 94.31 49.83 Ringhals-G 1367.10 1668.27 1269.90 1092.29 170.21 112.84 283.05 130.20 1.61 0.11 2922.00 2890.86 48.43 34.29 45.76 29.33 66.24 40.29 GSF 4987.00 NPL Ringhals·A 9221.00 7999.00 1417.00 1696.00 1492.00 1377.00 109.50 39.81 17220.00 11110.00 446.90 325.90 465.50 351.10 705.30 347.90 33.1% 10.5% -23.0% -78.4% 4.4% -31.9% -44.1% -47.2% 22.0% -14.0% -54.0% ·93.4% -1.1% -29.2% -35.9% -39.2% (NPVGSF)-1 -13.3% 19.7% -7.7% ·63.6% -27.4% '24.6% -50.7% 215.50 1226.00 205.80 280.30 2.79 1930.00 57.28 63.33 98.60 1129.00 1239.00 170.30 105.10 0.02 2643.00 41.61 39.50 62.09 -9.9% -3.5% -24.7% 11.2% ·8.2% -5.3% 0.7% 2.4% 4.5% -17.4% -2.4% 0.1% -6.9% -98.7% ·9.5% -14.1% -13.7% -6.3%
w
,
ill-<
...J U,
.
,
,
,
,
,
,
I
,
I i i 7 Q"
'"
->,f!.
~"•
>-~OI L,
ID Q C -ID ~'"
~'"
"'-i(5) re __"~~--'~-'i-'l
.r· .. · .. · .. ~ ,,--... \ '-, ~ Q,
ill-<
...J U I I •... ':: 1.. ..· .. L .. , ",o. I .. ,to.; .. ': .,: .. I .. t,0la::: ... lt.. V-««(I') ~ p.. ... '-o!(J ... ~.I :, "I' I '
... ( .•. : I : ,.' ... I ! . .f: lO'': : -..
:"" ,,
·L"l_ ... t. ... . • >-"'01 - L , ID " , C-.,
~
o .c 01 C ~ /' ... ,-,,
,
,
,
,
, "I11
I' I
Q -> r:f!. ~" ,>-"'01 -L '/_ CD " , C-"
,
'"
,>-"'01 - L,
" , C"
-"
'"
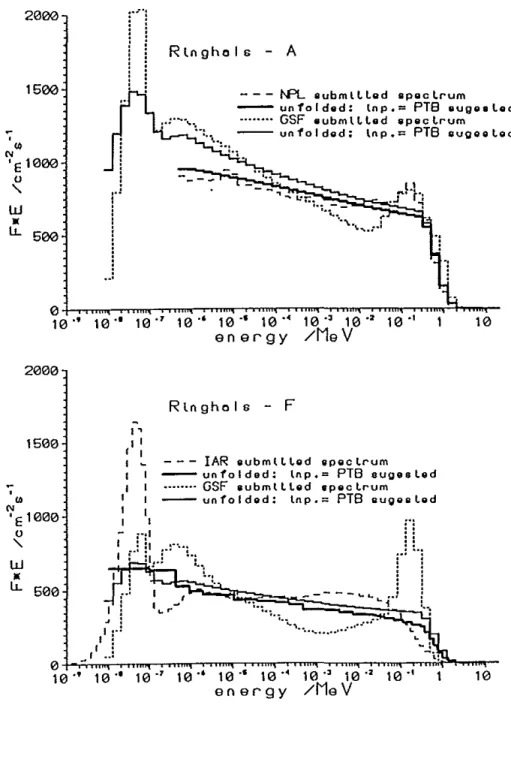
Figure I: Spectral neutron fluence rate F (in a lethargy representation) measured with Banner sphere spectrometers (GSF, IAR, NPL, PTB) and recoil proton detectors (KAI) in the contaimnent of pressurized water reactors in Ringhals (L, G, F, A) and in the environment of a transport cask with spent fuel elements at the Intermediate Storage Facility CLAB in Oskarshamnn (D, E, P) as submitted by the participants of the comparison exercise,
113130 8001
,
,
,
,
,
,
,, ,
RtngholsG
'~ 6001,
,
,
-"
'"
'E 0~
4001;p
"
!'~
- P T 8 - - - JAR ,'- ~..
. .. _ .. _. GSF Lt. 200-3 ,I - -P':"'" .. r""! e1f.',ti, •. l i d " , . . i . . , . . . , " , . . , , ""i"~::~-~":'~':,~:~':j~,;-'i~~
te'· 113" 10'" 10· ... 113-- 113'4 113"" 1121'2 teo , en ergy /Me V 2131313 161313 ~~12130"
'"
'E 0 " 8130 W"
Lt. 4130 Rlnghols - - JAR ... GSF F .: ,.r:'O!01,l.: .J ... ~ :'~'i... 1f"
~.. "':...
L
: "": .. j ·.;,.: . .." ... ".".J.~.l ... 10 ., 1211 ~,'~ . ,""" """''1 I '"l[ "iI'" """1 ,1,11"1 ,.1"'1 "'~ 11111, 113'· 113" 113"' 113-" 1121'· 1121'· le"" 1121-2 1130 , 10 energy /MeV 2500 2000 ~~1500"
'"
'e o " 1000 W"
Lt. 500 ~, 11 1 1 J ~ Rtnghols - A,
'-... _.:.':-: 1 "'" .... ... ::..~ . .::":;_~_ .... __ ... jJ...}.t.,. ~AI - - GSF .••••••.. rrPt. , J 11211 .. ,,,,,, .,1,., •• ,11'_, "''',"' "'''ill. I.",,'j • , I t .. " 11I1I,!
""':~'itli'"
10" 10" 10" 10'· 10" 10" -energy le' J le" 10" /MeV le 'rj ~. ~
-'(;' og
~."
C: 00Table 3: < 0,4 aV 0,4eV·l0keV 10·100 keY 0.1-1. MaV 0.01-1. MaV > 1. MaV total fluence Hmade H'(10) HSO < 0.4 eV OAeV-l0keV 10·100 keY 0.1-1. MaV 0.01·1. MeV > 1. MeV tolal fluence Hmade H'(lO) HGO < 0.4 eV OAeV-l0keV 10-100 keY 0.1-1. MeV 0.01-1. MeV > 1. MaV total fluence Hmade H'(10) HSO < 0.4 aV 0.4eV·l0keV 10-100 keV 0.1-1. MeV 0.01-1. MaV > 1. MaV total fluence Hmade H*(10) H60 0.07-2 MeV 0,07-2 MeV 0.07-2 MaV 9
Same as Table 2, but fluence and DE rates ([cm-' S-I) and [nSv/s) resp.) are calculated for a common binning of neutron spectra and conversion functions_ In addition, integral fluence values were also calculated in the energy range from 70 keY to 2 MeV for comparison with the KAI high-resolution measurements
Comparison of intergal values calculated from 5ubmitted spectra
PTO IAR (IAfVPTB)-1 GSF (GSF/PT6)I-l PTO IAR* (IAR'/PTB)-1 GSF (GSFIPTB)I-l
CIAB·O 44.59 50,45 188.26 188.BO 36.82 45.10 38,99 2277 75.81 67.87 4.37 1.67 313.00 308.60 10.97 7.29 11.73 7,41 17.43 10.89 CIAB·E 39.91 43.29 152.81 150.85 33.37 39.30 36.12 22.07 69.49 61.365 2.01 1.18 264.20 256.68 8.93 6.37 9.74 6.60 14.69 9.81 30.71 134.85 44,47 50.12 94.59 1.70 261.80 10,47 11.88 1B.28 GSF CIAB-P 42.25 143.25 51.79 28.36 60.15 0.97 266.87 7.16 7.63 11.53 IAR Ringhals·F 2274.90 3363.50 4127.40 4675.30 648.35 962.30 1199.70 319.02 2046.05 1281.32 0.89 4.74 8451.20 9324.80 228.80 254.57 394.40 KAI 154.40 139.51 200.91 IAR CLAB·P 51.63 37.34 CLAO·O 42.63 30.51 Ringhafs·l 355.32 130.67 KAI NPl Ringhals·A 2831.30 1686.90 13.1% 0.3% 22.5% -41.6% -10.5% -61.7% -1_3% -33.5% -36.9% -37_5% 8.5% -1.3% 17.8% -38.9% -11.7% -41,4% -2.6% -28.7% -32.2% -33.2% 37.6% S.2% 16.5% -43.4% -15.3% -43.0% 1.9% -31.6% -35.7% -36.9% (lAfVGSF)-1 47.9% 13.3% 13.4% -73.4% -37.4% 434.4% 10.3% ·32.5% -45.2% -49.1% (IAfVKAI)-1 -27.7% -26.B% ·63.2% (NPUKAlj-l -.(0.4% 33.44 176.89 36.62 41.00 n.S2 5.98 293.93 11,49 12.35 18.30 34.51 144.07 24.79 43.95 68.74 3.87 251.19 10.70 l1.n 17.79 20.06 123.36 42.20 62.76 104.96 1.14 249.52 11.22 13.14 20.53 PTB 59.77 46.91 300.71 -25.0% -6.0% -0.5% 5.2% 2.4% 36.8% -6.1% 4.7% 5.3% 5.0% '13.5% -5.7% -25.7% 21.7% -1.1% 92.7% -4.9% 19.6% 20.9% 21.1% -34.7% -8.5% -5.1% 25.2% 11.0% ·33.0% -4.7% 7.2% 10.6% 12.3% total >0.4 eV (PTBlKAI)-1 15.8% 14.2% -15.4% RinghaJs-l 239.12 31B.09 1270.20 1404.40 273.16 314.60 252.04 90.11 525.2 404.705 3.04 0.66 2038.00 2127.69 56.86 36.59 61.85 34.58 94.31 49.88 RinghaJs-G 1367.10 1667.60 1269.90 1094.60 170.21 109.65 112.84 20.44 283.05 130.0905 1.61 0.11 2922.00 2892.60 48.43 35.64 45.76 29.34 66.24 40.30 GSF 5052.70 NPL AinghaJs·A 9316.60 8000.30 1423.40 1696.1 1516.80 13n.OD 2940.20 3073.10 119.09 39.82 12375.89 11113.00 455.95 471.58 697.99 322.20 347.48 525.68 GSF (GSFlKAI)I-l 73.67 42.66% 52.27 22.04% 347.14 ·2.30% 1901.80 -32.83% 33.0% 10.6% 15.2% -64.2% -22.9% -78,4% 4,4% -35.6% -44.1% -47.1% 22.0% -13.8% -35.6% -81.9% -54.0% ·93,4% ·1.0% ·26.4% -35.9% -39.2% (NPUGSF)-1 ·14.1% 19.2% ·9.2% 4.5% -66.6% -10.2% ·29.~% ·26.3% ·24.7% 218.15 1236.8 204.43 287.17 491.6 3.1295 1949.7 58.116 64.067 98.712 1149.10 1253.00 170.72 108.90 279.62 0.02 2681.80 42.52 39.94 57.69 -8.8% -2.6% ·25.2% 13.9% -6.4% 2.9% -4.3% 2.2% 3.6% 4.7% -15.9% -1.3% 0.3% -3.5% -1.2% -98.5% ·8.2% ·12.2% '12.7% '12.9%
c
ro
ID :::E: 10 1.5 . - - - , olAR OGSF .5 L -__ L - ' _ _ L - ' _ _ L-' __ ~ __ L-~o
E
p L GPoint of Measurement
c
ro
ID :::E: 1.5 , - - - , (j) PTS OIAR OGSF o .jJ 1.0 1 - - - 1o
.r-! .jJro
0:o
E P
L
G
Point of Measurement
Figure 2: Ratio of the total neutron fluence (left) and dose equivalent values (right) determined by GSF, IAR and PTB at 5 positions (see Table I) with Bonner Sphere spectrometers to their mean values.
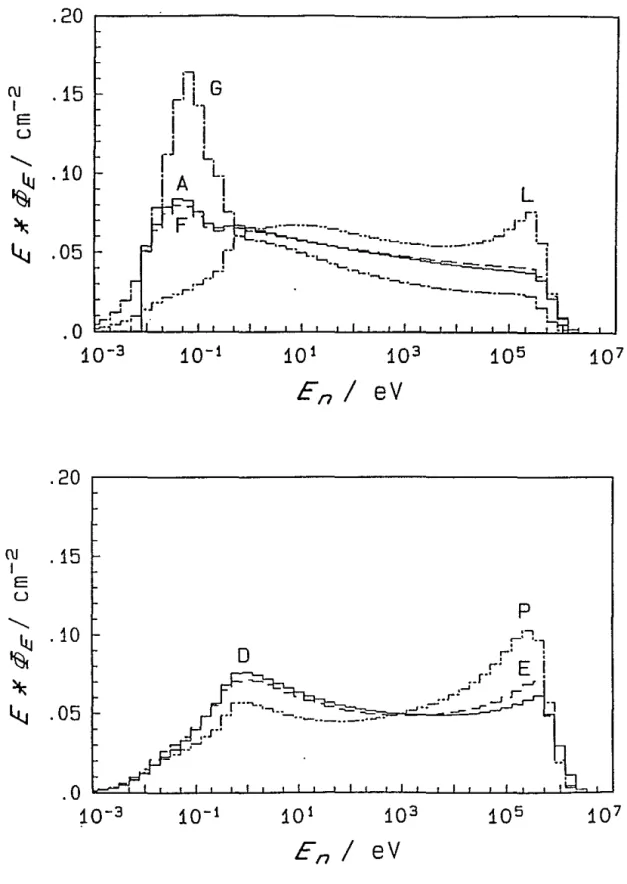
Table 4: Relative contribution (in %) of neutrons from different energy regions to the total fluence (left) and DE (right) at the positions investigated at Ringhals (A, F, G, L) and CLAB (D, E, P)
energy regiOn fluence fraction (%) at DE-fraction (%) at
P,D,E,L F,G,A P,D,E,L F,G,A
<0.4 eV 12
-
17 32-
58 2-
5 15-
510.4 eV - 10 keY 52
-
64 37-
50 8-
17 21-
2810 keY - 100 keY 7
-
20 4-
10 8-
16 7-
18100 keY - 1 MeV 7
-
18 0.7-
9 51-
74 10-
5111
The reason for this unexpected result is obvious from Fig. I, and Table 3: all IAR spectra are softer than the PTB (and the GSF) spectra such that the fluence in the two highest supergroups is about 40-90% lower for the IAR than for the PTB result. As a consequence of the strong increase of the conversion factors in the energy region from 10 ke V to I Me V the total DE is then underestimated by 40 - 50% in the IAR spectra.
A comparison of the GSF and PTB spectra also shows some systematic differences. While the total GSF fluence is always slightly lower than the PTB fluence (4 - 8%) the GSF DE-values are generally higher than the PTB DE-results except for pos. G. These deviations are chiefly caused by the different shapes of the spectra, in particular by the deep minima of the GSF spectra in the region of 1 keY to' 10 keY.
Two BS data sets were only available for positions F and A, both situated in the reactor
containment building. For pos. F the IAR spectmm is much softer than the GSF result, similar to the trend observed for the other positions. At pos. A only two BSSs could be employed due to the high dose rates, namely the active system with the lowest sensitivity (GSF) and the passive BSS using Au activation for the detection of the thermal neutrons (NPL). Including the thermal fluence separately reported by the NPL (but not included in the spectmm submitted) the fluence (-5%) and DE(-15%) are both lower for the NPL result.
Finally, the high resolution data obtained by KAI with recoil proton spectrometry are compared in the overlapping region (70 ke V to 2 Me V). The rather large differences of the integral fluence if compared with the PTB, GSF and NPL BS results point to a problem with
the normalization of the PRS data. If, however, the shape of these spectra is only considered,
reasonable agreement is observed with all BS results except for the IAR spectra.
Besides the large deviations in the DE values from the mean, some systematic differences can also be seen in shape:
the IAR and GSF spectra show more stmcture (peaks and dips) thaJ.l the PTB spectra, which may be caused by the selection of the guess spectra and/or too many iterations in the unfolding procedure,
the thermal distribution used by the PTB con'esponds with a somewhat higher temperature (mean energy) than those used by GSF and IAR and
12
the mean energy of the fission-like distributed high energy neutrons is much lower for the IAR than for GSF and PTB (finally resulting in the much lower DE values).
Since it was not obvious from the results reported whether the differences were caused by the response matrices, the guess spectra or the unfolding procedures used, an additional unfolding was performed.
2.2 Additional Unfolding
The original version of the SAND 2 code [6] distributed by RSICIOak Ridge was adopted for IBM compatible and V AX computers including some supporting programs (CSTAPE,
SLACTS, SLTAPE). In order to avoid possible inaccuracies in the interpolation procedure of
the CSTAPE code, which prepares the response matrix library for the SAND 2 code, a new code CST AP _EM was written. This code rewrites the response matrix with the energy bin structure supplied by the participants into the format required by the SAND 2 code.
The response matrices of PTB, GSF and IAR were originally submitted with 53, 44 or 47 bins and therefore transformed into 49 bins of the common format. The 128 bin structure used by the IAR group for the resulting spectral neutron fluence was ignored because no recipe was given for inter- or extrapolation of the original structure of the response matrix.
Various input (guess) spectra were used:
the spectrum unfolded by the participant (submitted spectrum), the spectra submitted by other participants,
the high resolution spectra of KAI, if available, extrapolated to lower energies by an lIE and subsequent thermal Maxwellian distribution according to the procedure inherent in the SAND 2 code or
the KAI spectra extrapolated by the PTB result for energies below 70 ke V.
The SAND-iterations were stopped at a standard deviation STDV=2.5 (see [6]) or at least after 50 iterations. The standard deviation STDV is calculated from:
13
STDV = sqrt( (N-I)-I
I
AE(i)/(ACCi) R - 1)2) (1)i
with R = N-1
I
AE(i)/ ACCi)and N = number of spheres employed (incl. the bare detector) AE(i) = the measured rate if the i-th sphere
ACCi) = the rate of the i-th sphere as calculated for the actual spectral fluence and the response matrix given.
Group and total fluence and the total dose equivalent (DE) values derived from the spectra evaluated for the different input spectra are listed in Tables 5 - 9. For simplicity only H*(10) values according to ICRP 60 [4] are given for comparison. The corresponding spectra are compared in Figures 3 - 8.
In general the limit STDV=2.5 was achieved before 50 iterations. The solutions obtained were stable, i.e. at the end of the iteration procedure the STDV values changed by less than 1 % (preset value) between subsequent iterations. A STDV-value of 2.5 means that the differences between measured and calculated count rates are chiefly less than 1 %, amount to 2% for 2 - 3 spheres and may increase up to 5% for one or two spheres in bad cases. It must be born in mind that the statistical uncertainties reported are generally less than 1% (1.5% at maximum) but the total uncertainties are in general given 2-3 times larger.
Considering the statistical compatibility of measured and calculated rates most of the resulting spectra were adequate solutions and the selection of the best result had to be based on additional information on the neutron field investigated, e.g. on the primary neutron source and the shielding material. The results obtained are discussed in sequence for the data sets measured by the various groups.
14
Unfolding of the data measured with the IAR-BSS crab. 5, Fig. 3)
Using the start spectra as reported by the participant the SAND 2 unfolding resulted in spectra rather different from those submitted. This could simply be explained by the fact that the same input parameters were differently interpreted by the SAND 2 code and the modified SAND PET version used by IAR. The systematic differences between the IAR and the PTB (and GSF) results could, however, not be resolved in this simple way.
Surprisingly, discrepancies of the ratios of measured to calculated count rates were also observed when the submitted spectra were used as the a priori information. It turned out that the input facility of the SAND 2 code (SPECTRUM TABULAR) was not fully reliable if the fine structure of the reported spectrum was transformed into the coarse common bin structure. In addition, the response matrix used by the IAR group differed from that one submitted, in particular in the thermal energy region.
Despite these problems, the submitted spectrum was confirmed in shape including the dip between the thermal and the lIE distribution but not as pronounced as for the input spectrum. Although the thermal fluence decreased in most cases by 8 - 20%, the total fluence (-2%) and
DE (-1 %) values were only slightly influenced except for the very soft spectrum encountered
at pos. G in the reactor containment building for which the total fluence (- I 1%) and DE (-10%) values decreased very similarly.
In the case that the three other guess spectra based on the PTB and KAI results were used the upper edge of the spectral fluence shifted to higher energies (additional tests with the GSF results which were submitted rather late were not performed because further improvements could not be expected). While the total fluence values slightly decreased by about 4% (-12% for pos. G only) the DE values considerably increased by 10 - 20% (CLAB and
RINGHALS-G spectra) or even 33 - 40% for pos. L. A sufficient agreement of measured and
calculated count rates was, however, not achieved and it was therefore. suspected that an inadequate response matrix caused the problem at high energies, in particular the discrepancies in shape with the high resolution KAI data.
15
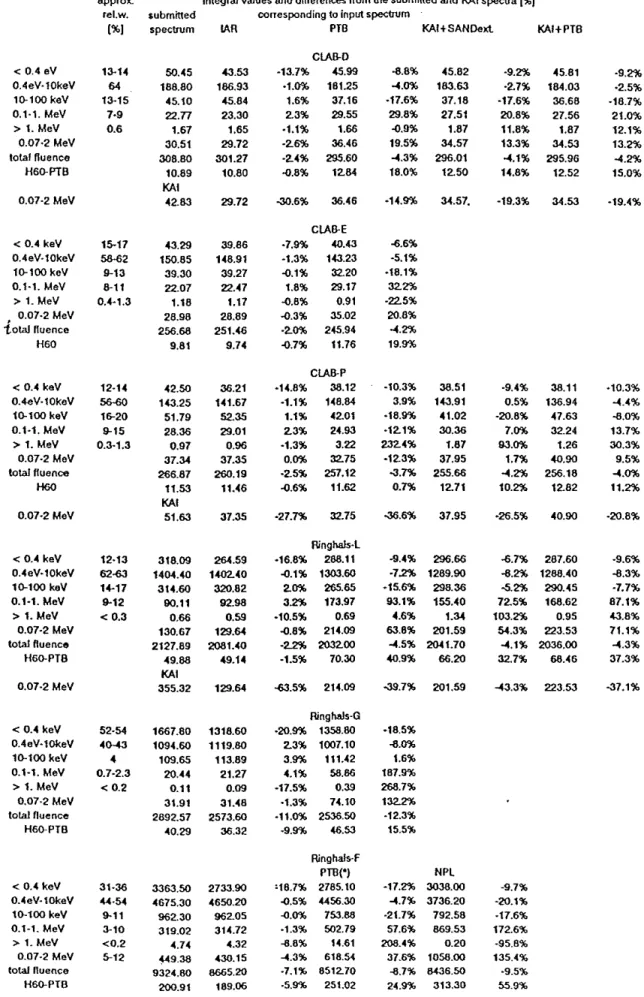
Table 5: Integral fluence and DE rates (cm·' s·') and [nSv/s) resp.) obtained for all IAR BS
data sets using different start spectra as indicated (for details see text).
<: 0.4 aV OAeV·l0keV H}-lOO keY 0.1,1. MeV > 1. MeV 0.07·2 MeV lotal Huence H6o-PTB 0.07-2 MeV < OA keY OAeV·l0keV 10-100 keY 0.1-1. MeV > 1. MeV 0.07·2 MaV tow Huence H60 <: 0 . .( keY O.<t-eV·l0keV 10-100 keY 0.'-1. MeV > 1. MeV 0.07-2 MaV total fluence H60 0.07-2 MaV <: 0.4 keY O . .(eV·l0keV 10-100 keY 0.1-1. MeY > 1. MaV 0.07-2 MeV total nuence HSO-PTB 0,07·2 MeV < 0.4 keY OAeV-1OkeV 10-100 keY 0.1-1. MaY > 1. MeV 0.07·2 MeV total nuence H60-PTB < 0.4 keY O.4eV-1OkeV 10-100 keY 0.1-1. MaV > 1. MeV 0.07·2 MeV total HUence H60-PTB approx.. (e!.w. (%J 13-14 64 13--15 7·9 0.6 15-17 58-62 9-13 6-11 0.4-'.3 12·14 58-00 16-20 9-15 0.3-1.3 12·13 62-63 '''-'17 9-12 < 0.3 52·54 4()-.(3 4 0.7-2.3 < 0.2 31·36 «·54 9-11 3-10 <0.2 5-12 fAR measurements
Integral values and differences from the submitted and KAI spectra 1%1
submitted corresponding to input spectrum
spectrum LAR PTB KAI+SANOeld. KAI+PTB
50.45 188.80 45.10 22.77 1.67 30.51 308.80 10.89 KAI 42.83 43.29 150.85 39.30 22.07 1.18 28.96 256.66 9.61 42.50 143.25 51.79 28.36 0.97 37.34 266.87 11.53 KAI 51.63 43.53 166.93 45.64 23.30 1.65 29.72 301.27 10.80 29.72 39.86 146.91 39.27 22.47 1.17 28.89 251.48 9.74 36.21 141.67 52.35 29.01 0.96 37.35 260.19 11.46 37.35 318.09 264.59 14Q.4.40 1402.40 314.60 320.82 90.11 92.98 0.66 0.59 130.67 129.&4 2127.89 2081.40 -49.68 49.14 KAI 355.32 129.&4 1667.80 1318.60 1094.60 1119.80 109.65 113.89 20.44 21.27 0.11 0.09 31.91 31.48 2892.57 2573.60 40.29 36.32 3363.50 2733.90 4675.30 4650.20 962.30 962.05 319.02 314.72 4.74 4.32 f49.38 430.15 9324.80 8665.20 200.91 189.06 ClAB-O -13.7% 45.99 -1.0% 181.25 1.6% 37.16 2.3% 29.55 ·1.1% 1.66 -2.6% 36.46 -2.4% 295.60 .a.S% 12.64 -30.6% 36.46 CLAB-E -7.9% 40.43 -1.3% 1.(3.23 -0.1% 32.20 1.8% 29.17 -C.8% 0.91 -0.3% 35.02 -2.0% 245.94 -0.7% 11.76 ClAB-P -14.8% 38.12 -1.1% 148.84 1.1% 42.01 2.3% 24.93 ·1.3% 3.22 0.0% 32.75 -2.5% 257.12 -0.6% 11.62 Ringhals·L -16.8% 288.11 -0.1% 1303.60 2.0% 265.65 3.2% 173.97 -10.5% 0.69 -0.8% 214.09 -~ 2032.00 -1.5% 70.30 ~.5% 214.09 RinghaJs·G -8.8% 45.82 -4.0% 183.63 -17.6% 37.18 29.8% 27.51 -0.9% 1.87 19.5% 34.57 -4.3% 296.01 18.0% 12.50 ·14.9% -6.6% ·5.1% -18.1% 322% -22.5% 2O.B% .... 2% 19.9% 34.57. -10.3% 38.51 3.9% 143.91 -lB.9% 41.02 -12.1% 30.36 232,4% 1.87 -12.3% 37.95 ..J.7% 255.66 0.7% 12.71 -36.610> 37.95 -9.4% 296.66 -7.2"'1:. 1289.90 -15.6% 298.36 93.1% 155.40 •. 6% 1.34 63.8% 201.59 -4.5% 2041.70 -40.9% 66.20 -39.7% 201.59 -20.9% 1358.80 -18.5% 2.3% 1007.10 -8.0% 3.9% 111.42 1.6% 4.1% 58.86 187.9% -17.5% 0.33 -1.3% 74.10 -11.0% 2536.50 -9.9% 46.53 RinghaJs-F PTll(') :16.7% 2785.10 -0.5% 4456.30 -0.0% 753.88 -1.3% 502.79 -8.8% 14.61 -4.3% 618.54 -7. t% 8512.70 ·5.9% 251.02 268.7% 1322% -12.3% 15.5% NPL -17.2% 3038.00 -4.7% 3736.20 -21.7% 792.56 57.6% 669.53 208.4% 0.20 37.6% 1056.00 -8.7% 6436.50 24.9% 313.30 -9.2% 45.81 -2.7% 184.03 -17.6% 36.68 20.6% 27.56 ".B% 1.B7 13.3% 34.53 ...(.1% 295.96 14.8% 12.52 -19.3% 34.53 -9.4% 38.11 0.5% 136.94 -20.6% 47.63 7.0% 32.24 93.0% 1.26 1.7% 40.90 ...(.2% 256.18 10.2% 12.82 ~26.5% 40.90 -6.7% 287.60 -8.2% 1288.40 -5.2'% 290.45 72.5% 168.62 103.2% 0.95 54.3% 223.53 -4.1% 2036.00 32.7% 68.46 -4-3.3% 223.53 -9.7% -20.1% ·17.6% 172.6% -9S.B% 135.4% -9.5% 55.9% ·9.2% -2.5% ·1B.7% 21.0% 12.1% 13.2% .... 2% 15.0% -19.4% -10.3% -4.4% -8.0% 13.7% 30.3% 9.5% .... 0% 11.2% -20.8% ·9.6% -8.3% ·7.7% 87.1% 43.8% 71.1% -4.3% 37.3% -31.1%
-' e (I) E (I) L :J If) 0 (I) <
,
I " •... l····:··:·~-,-"
E • , .N <~O ~<Z u>« • Cl) ~.
·
'D ~ "O~ 'C"O ~-. ~ "0 C E"O. D'~ ' " 0 "·
-o.
"'
< C<..
~ ~,><"'1
: -h _ -"\, .. 16,
, >-"'0> L,
" , e'"
(I) ~,
< ,,
,
I 1,
, :"... r;',
L:-I ~....
1 _ _ , l :: !: ,.
:..
--
..
./ ... f····;···-,--
--
-' (l] I-Ea.,
.
< ~~(l] u<1-.><a. 0.·
.
'D ~ "00. • C ~ ~-. ~ ~ .., •• c E"O • D.~,
~ "·
-
o.
"'
< c<..
~ ~ ,><I
i
,
>-"'0> L,
" , e'"
- " , E ~"
Ul "'TnTn~TnTn~"TnTn~UlT"Tn~T,,~nTnTCUlOTnTnT~,,~«
(") f-i 0 I ill«
--l U"
(") Figure 3: N N r -1 _ _ ' - - -..
re
Ul"
E,
< ~'" u< o~ ~.
,
"00. • C ~ -~-
E"O..
D ' ,~ 0 -0 ",..
<c ~, II
1 1 - - 1_ Ul'"
,
'"
->
,f!.
~,,
>-~O> L,
'"
" , e - (l) ~,
~ -, , ~-'"
"'-
"
(")"'
N ... ... ::;~: ... ; ... ~ ... . .. !-i.~ ,,
,
,
1 1 1, ,,
,..
' ,.: .... .. .. ;.:.::"( I ," - 1 '. , !···:···L .. ; ... ~-... --.,'"
"'
N'"
E, ,
E < < ~(l] ~ ul- u oa. • 0. n ,,11 01 ~ n~ • c • ~-~ ~ ~ E~E DOD,
~,
·
-o.
" , . . (l] '" cl-~ ,a. >-"'0> L,
" , e"
-'"
,
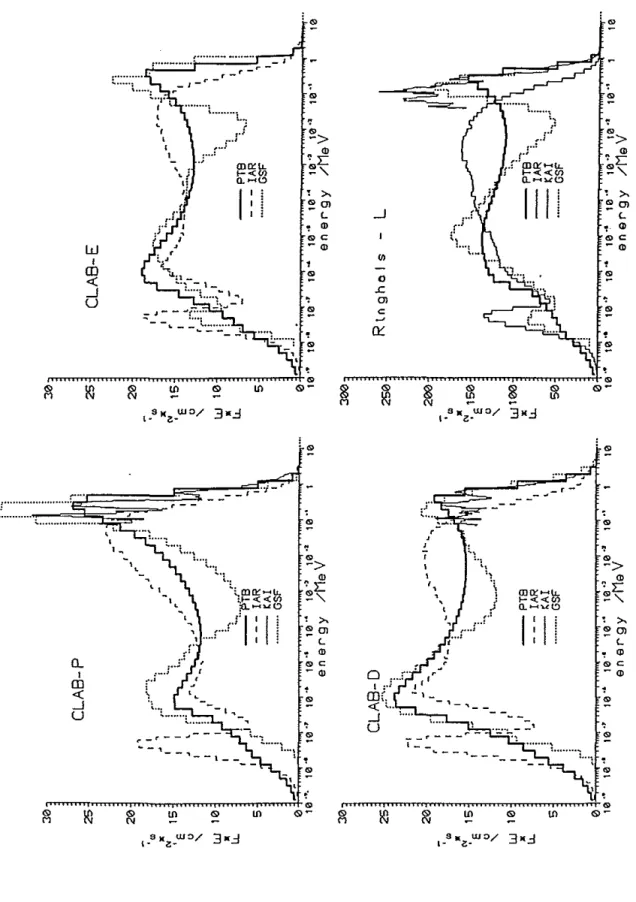
Unfolding of BS data sets measured by the IAR group at Ringhals CL, F, G) and CLAB CD, E, P) using different start spectra. For comparison the result submitted by IAR is shown in all figures.
30 25 20
'~
1
"
':' E 15 0 "-W 10"
IJ.. 5l J,
,
,
-,",
,
-"IAR Qubmlttod opectrum unfoldod: lnp.= IAR
CLAB-P, IAR meosurement
30 25 - ' 20 ~ "
-.. ___ r---· -... · -... :
e.:.
u.,r-·' _00. 0:._o .
.!" "'J-;:'-~'-'"""'1
1r.ij
.. ~-;1:
"
':' E 15 0 "-W 10,
,
J J,
,~\
,I,"
IJ.. 5 ---1--- ,U,-,
,
IAR 8ubmlttod .poclrum- - - unfolded: lop. = KAI+oxt.
KAI oxLoodod'by SAND2
,
.,
III
01 ,-,;",.
10'. ",ill, it ",hi, •• "', 1,.11'1 i""', """1' I t ... , ,,"'h'"10
Hr- le 0' le'" 113" le'· 113-:1
,,,-:I'
le .1energy
01 -'
113"; '''''', "iI', _, "" 11111'1 I ill''', , ... 1.1 •• 1111", "ll"'. "'''''i ~'I10 10 '. le'" le'· 113'- 113'" energy H~-!I 10-2 /MeV 10 _I 30 25 20
,",
~"
N , E 15 0 "-W 10,
,
,
"
IJ.. 5 I~':-' ,,: ,..J 01"~;:;-.
le'" le" 113" /MeV :--:(:.
,.! r 1-"':-.···1,
,
ro' I,
,
_- : I ,~,IAR 5ubm\tlad spectrum
---unfolded: lnp.= PTa
PTa oubm\ttod spectrum
le'· le" 113'4 113'1 113'2 le" energy /MeV I 10 30 25 20 '~
"
'"
, 15 E 0 "-W 10"
IJ.. 5,
-'-_., , , " u ' ,,
I,
: J , I ···1,
--'-- .. I' .! T:' -1 : -I:.::::. ... "'~
L:r
~!,..-
.. "",. "'''' ''''''''
1111'1 ,.11"'1' , •• 111 """4 I .,"""jj'~'i1ilii
"1
t···· .. · .. : IAR svbmttted spectrum - - un'folded: tnp.= KAI • PTS ~AI oxLoodod by PTB 10 '. H3'" 10" 10" 10'" 10 energy 10 ,:l 10·:r 10 ., /MeV .." riO" t:: Cl v) '(l o
a
~' 0-~ -.J•
•
300 250 200 " 150 'E u "-WHl0•
LL 50 r " • I ,,
,
-'
'- - - lAR Gubmltted 8pectr
- unfolded: lnp.= tAR
Rlnghols-L. IAR meosurement 300 '0>
•
250 200 '" 150 'E u"
W100•
LL 50 r,
,
,
:'~ :,_u_"u,_".-:,_, __ ~u."""":':_J!--':"~.:···"t
.·u .. · _ .... _-'
---l ',
..--=-=---,
. ··j'··· ..t.-
-, ]'1..,
:tAR aubmllletd apoctt"'um I ".
- unfolded: tnp. = KAI+oxu.:
•
, KAI .x~.nd.d by SAND2
e
1 "i, ", j ill, j ' " ' ~ " . . ) . . " " , , i i " " ' , I .. 11", .,. Ill, I'''~ ; " , 01 '"'''' ., ... ,,.iI., "''', " ... , •. , .. ".,
,,11"'\ """"1 'i\"~ll'ii"ile·· le'· la"' le·" le'· 10·~ le"' 113':' 113-'
'.
•
300 250 200 ':'E 150 u "-W100•
LL 50,
,
,
,
f':",..
-'
,
,
.k
.:-. ;1',-en er gy /Me V... -
, r - - .."
f.,-,...., :"-:.. r"
i f'o! :..
~'.,
•
,
,
IAR submltt.d spectrum- unfolded: tnp.= PTS
PTB QubmltlQd apQctrum
e1,·~~~'jr:1
li"'" ',',"1 t,II", .... 11, "'""1 I,'''', ""","~'~i
,
le'· 10'· 10 ., le·· 113-· le"·energy
11,30::1 113-2 le .1
/MeV
10
10
le'· le" 113-' la'" 113-" 10'~ 10·" 10.2 10·'
'.
•
300 250 200 ':' 150 E u "-w100 J( LL 50-'
I '-
,
energy /MeV-_
...-
---
...
"....
; .. ~JJ' . ;"
''
..•~..
-: opoc~~um
"~:
:. :' ... - IAR
oubmt~~ed
= KAI • PTB_"I . - - - u n , o - - "Ided: lnp. dad by PTB ... ' L ' , .L ... : t::AI 0 ) ( lon r , r 10
01 ."iil", 1 .. 1 1 , ' " " " , • '''''', • " " " , , " ' ' ' ' • • 11'11' ''''''''I .
",,*
III I ,10'· 10'· 10.7 le"' 10'· 10-<1 10'~ 10-2 10·' 10 energy /MeV ::E1 (JO e @ w ~
"
oa
s'
e (0 C 001000 S00 ~. 600
•
N 'E u "~00 W•
lL. 200,
,
,
0~ Rlnghols-G. I AR me 0 sur e me n t,
,
,
,
,
,
,
,
,
,
, ,
IAR auhm\lLod aplilclrum unfolded; tnp.= IAR
113'" 1121 " , 121 ·1 le'" le'· le'·
energy le') le·;t la .\ 1000 800 ~"600
•
N 'E u ,,~OO w•
lL. 200,
,
,
,
,
,
,
"',1 :.: tt .. : I:I: I:
,
.,
'
r'
."...--, ... /MeV- - - IAR aubmltl.Qd apoclrum - - unfoldod: tnp.= PTB ... PTS 8ubmtt.Lod spectrum
I /
-'~.-.--~.,,=;;
... .
o
1 121 . .,"<'"' " ,
'121 ., H3 ., le -. le •• le .~ le .),
'''''~ :",;~.;-S;,
1121 .,. 1121 .1 en ergy /Me V 10 ,0 30 25 20•
•
N 15 'E u"
W 10•
LL 5j,
,
,
",
.
o
1 i.-
ill' I le . ., le -, 30 25 20.
'.
•
N 'E 15 u"
W 10CLAB-E.
I AR me 0 sur e me n L -',
,
'
, ,
,
,
,
,
,
-.-,
,
le -1-'
, ,
,
'
,
,
,
,
,
.
- - - IAR Qubmtllod apctcl.rum - - unt'oldgd: tnp.= IAR 10'" 10" 10'~ energy le -, le'" /MeV r:···'"!·~
...
:'. .., .. :.-...
-:~
•• " •••• Io..,. - - - . . . .r •• .. :~
...~
, le .,•
LL ~,
'
r " 5,
. I" .r. e :"je
1"~~~~
le'· le" ,-le .1IAR aubmlLlad spectrum
- - unfolded: tnp.= PTS PTS aubmlLlod apDclrum le'" le" 1121'4 1121" 1121-1' 1'21 .1 energy /MeV 10
.-10 71 riC' c: i'ti...
,
~ Cl o ::< ::. ::; c (1l c. ~ -0Figure 3 : (continued)
'"
•
21300 1500 ':'E 1e00 o "-W•
11. 500'"
•
2131313 151313 ':'E1eee o "-W•
11. 5131320
Rlnghols F, IAR meosuremenL
I ' I I I I I _ I I I I I I I I
IAR 6ubmllled spectrum
- unfoldgd: tnp.::: PT8 Qugggl,.gd
... PTS QugOg I..gd apgc I..rum
rl-···~ _ _ ~.7~ •• _ ~--~-_ l~ ... j l .. r-I ... '.~ ... . "
"
I I I I I _ I I I I I : Ii
.
, I": I : ':.,
- - - IAR 8ubmlt.l.od spoctrum
- - unfolded: lnp.= GSF 98ubmllt.ed ... GSF Qubmllt.od apoclrum. le I : I .. : e~~~~~~~~~~=r~~~=r~=r~~~~
10" le" le" le" le" 10"
energy
le" le" le"
/MeV
21
Unfolding of the data measured with the PTB-BSS (Table 6, Figs. 4)
Since at PTB the guess spectrum is iteratively improved in the course of the unfolding with a modified version of the SAND 2 code the submitted spectrum was directly used as input spectrum. Only small systematic shifts were observed: the fluence below 100 ke V neutron energy slightly increased, and decreased above such that the total fluence was almost
unchanged. In consequence the total DE values decreased by about 3%. This improvement is
even questionable because rather low STDV-values «1.5) were obtained.
Using the IAR submitted spectra as an input the general shape remains, but the thermal distribution is reduced, the epithermal part increased and the upper edge generally shifted to higher energies. The total DE values are still 15-20% lower than the original PTB results.
The spectra submitted by the GSF are generally confirmed in shape and systematic changes of the total fluence and DE values were not observed. The resulting STDV values are, however, larger than those for the other attempts.
The high resolution KAI spectra show exactly the same slope as the PTB spectra for energies above 0.5 Me V but the fluence between 70 ke V and 500 ke V is significantly different. Using the KAI shape with the two different extrapolations to thermal neutron energies the resulting spectra give 2 - 10% lower DE values but the discrepancies in the 70 ke V to 2 Me V region remain, most obviously for pos. L. For this reason it was suspected that the KAI results suffer in normalisation problems, in particular for the measurements under severe conditions in the containment of the reactor.
22
Table 6: Integral fluence and DE rates ([cm-' S-I] and [nSv/sj resp.) obtained for all PTB BS
data sets using different start spectra as indicated (for details see text).
< 0.'1 eV 0.<4eV·10keV 10·100 keY 0.1·1. MeV > 1. MeV 0.07-2 MeV total rluence H60·PT8 0.07·2 MeV < 0.'1 keY O.'leY-10keV 10-100 keY C.1-1. MeV > 1. MeV 0.07·2 MeY total Huence H60 < 0.<4 keY 0.<4eY-1OkeV 10-100 keY 0.1·1. MeV > 1. MeV 0.07-2 MeY toW fluence H60 0.07·2 MeY < 0.01 keY 0.<4eV·l0keY 10-100 keY 0.1·1. MeV > 1. MeY 0.07·2 MeV tal ftuence H50·PTB 0.07'2 MeV < 0.<4 keY 0.,(eV·l0keV 10-100 keY 0.1·1. McV > 1. MeV 0.07·2 MeV (olal f1uence H60-PTB PTB measurements
approx.. Integral values and differences from the submitted and KAI 6peWa [%J
rel.w. submitted corresponding to inplltspectrum
(%J 15pectnJm PTB JAR KAI+SANOext KAI+PTB
13-104 6< 13-15 7·9 0.6 15-17 58.£2 9-13 8·11 0 ... -1.3 12-14 58.£0 16-20 9-15 0.3-1.3 12·13 62-63 14·17 9-12 < 0.3 52-54 "0--43
•
0.7·2.3 < 0.2 401.59 168.26 36.82 38.99 '.37 48.91 313.00 17.43 KAI "2.83 39.91 152.81 33.37 36.12 2.01 43.60 264.20 14.69 30.71 134.85 401."7 50.12 1.70 59.n 261.80 18.28 KAI 51.63 4".76 189.58 37.31 38.37 '.06 48.08 314.08 17.02 "8.08 "0.07 15-4.2-4 33.93 35.15 1.87 .2-59 265.25 14.234 30.87 136.27 45.39 48.74 1.6< 58.50 26290 17.73 58.50 239.12 2<41.13 1270.20 127B.30 273.16 27B.74 252.04 2<41.33 3.04 2.99 300.71 290.97 2038.00 2047.20 94.31 90.80 KAI 355.32 290.97 1367.10 1354.50 1269.90 1280.40 170.21 171.8B 112.6-01 10B.51 1.61 1.55 139.55 135.'17 2922.00 2916.BO 66.24 &4.78 ClAB-D 0.4% .w.89 0.7% 192.74 1.3% 047.494 -1.6% 31.14 -7.1% 4.40 -1.7% ·U.20 0.3% 315.65 -2.4% 14.66 12-3%.,20
CLAB-E 0.4% 38.55 0.9% 156.76 1.7% 41.69 -2.7% 28.47 -7.1% 2.53 -2.3% 36.85 0.4% 267.96 -3.1% 12.25 ClAB-P 0.5% 30.15 1.1% 146.B2 2.1% 48.26 -2.6% 34.97 -3.3% 4.64 .2..1% 45.75 0.4% 264.84 -3.0% 15.26 13.3% 45.75 RinghaJs·l 0.8% 2-48.24 0.6% 1290.00 2..0% 357.59 -4.2% 180.20 -1.8% 5.47 -3.Z% 236.73 0.5% 2081.50 -3.7% 76.05 -18.1% 236.73 RinghaJs·G -0.9'% 1331.-40 O.B% 1365.60 1.0% 197.75 -3.8% 58.61 -4.0% 1.01 ·3.0% B2.62 -0.2% 2954.60 .2.2'% 51.33 -8.31% .(8.73 2.38% 186.97 28.99% 38.53 -20.13% 36.97 0.58% 4.76 -15.n% 46.84 ".17% 315.96 ·15.89% 17.02 -3.61% -3.4% 2.6% 2-4.9% -21.2% 25.7% -15.5% 1.4% -16.6% 46.84 -1.8% 34.45 6.9% 145.66 8.5% "2.17 -30.2'% 39.86 173.1% 3.83 -23.5% 50.23 1.2% 265.97 -16.4% 16.34 3.8% 1.6% 30.9% ·26.5% 79.9% ·21.3% 50.23 278.72 1294.00 316.72 199.62 4.03 253.65 2.1% 2093.30 ·19.4% 80.82 -33.<4% 253.65 -2.6% 7.5% 16.2% -47.9% ·37.3% -W.8% 1.1% -22.5% 9.3% «.70 -0.7% 193.33 4.6% 36.12 -5,2% 35.32 6.9% 4.60 -4.2% 4oI.n 0.9% 314.27 -2..4% 16.55 9."% «.n 12..2% 31.23 6.0% 139.40 -5.2% 47,"2 -20.5% 42.25 125.1% 3.23 -16.0'*. 53.63 1.6% 263.53 ·10.6'% 16.5-4 53.63 16.6% 240.80 1.9% 1279.00 15.9% 315.35 ·20.7% 220.36 32.6% 3.62 -15.6'% 283.66 2.7% 2059.10 -14.3% 65.04 -28.6% 283.66 GSF 0.3% 47.60 2.7% 184.17 -1.9% 37.60 -9.4% 40.18 9.8% 5.51 -8.5% 51.19 0.4% 315.06 -5.0% 18.08 '.5% 51.19 39.30 151.91 25.56 42.73 2.60 51.43 262.11 16.78 1.7% 38.28 3.4% 121.81 6.6% 43.60 -15.7% 60.03 89.6% 1.04 -10.3% 71.03 0.7% 264.96 -9.5% 19.92 3.9% 71.03 0.7% 247.00 0.7% 1306.40 15.4% 216.68 -12.6% 284.14 19.1% 2.46 -5.7% 344.06 1.0'*. 2056.70 -9.8% 98.74 1410.40 1240.80 19B.l1 115.70 0.04 154.69 2965.10 63.21 6.8% -2.2% 2.1% 3.0% 26.0% '.1% 0.7% 3.7% 19.5% -1.5% -0.6% -23.4% 18.3% 29.4% 18.0% -0.8% 14.3% 2Hi% -9.1% -1.5% 19.8% -38_6% IB.6% 1 = 9.0% 37.6% 3.3% 2.8% -20.7'10 12-1% ·19.1% 1-4.4% 0.9% ".7% 3.2'1< -2.3% 16.4c.\ 2-5<>0 -97.6"k. 10.S<;" 1.5% -4.6%:::
'"
:::< UQ c: @ to c: to 5' (Jqe,
:;;
"
~
to ~ 0:> ;:t to '0g
~
'"!l o..,
CO o.§
0:> :J, to o :::if
@ to;:
to c: cr §, ~"
0-cr '< '"Cl ....J to iii' to cr o ~ ::: ::;J UQ@
.,.
C ::: 8'e,
::: (Jq o -, to en 0-0:> fJ to"
C;;~
'"
to c: @ 0-cr '<if
'"0;l
(Jq Cl c: '0 ~.r
.9
5
0-n
~
~.v
rn
'0 ~ 30 CLAB-D, PTB meosur'amant 30'.
x 25 20 r:'e15 o,
w,0 x t.. 5.
,
- - - PTa aubmtlLod .~8cl"'um
••••••.• GSF aubmllLod apoc lrum - - - un 1'0 I dad: In p. -GSF epee t,r-urn
01--
""~,
"
,
,
,
,
,
"-k
1121'· 10" 1121'7 le" le" le·" 10-~ le,a le" an er'gy /MaV 30 2S 20
'.
NX 'E 15 o,
W 10 x t.. S:j
:"'11 - - - PT8 aubmlLLod apoclf"um IAR cubmlLlod opac - - - unfolded: tnp ... IAR: 10 04..;;2 , , , '" , , ,'n"
1121'· 1121" 1121.7 1121 -, '121.1 1121'~ 10" 1121.2 1121" 10 aner'gy /MeV'.
x 2S 20r:
15 E ~ W10 ~ S 0 le .• 30 25 20 •1
X N 15 'E o ',
W10 x U.5~
H:l -.f
0 1 / , 10,9 10 " .. ,. ... -... :.:.:.: .. :.~ .. :.!': ... :-- :-- :-- P T S aubmllt..d opecLrum - - - unfolded: tnp ... t:::AI .)(1..•.•.•••• KAI oxlondod by SAN02
H:;
.7 1121'" 10 _c 10'410
_l;-'0
-2-;-0"
anergy /MaV'~
~
-
",
- - - PTS oubml t lad apoe t('um - - unfoldgd: lnp.=I(AI .. PTB KAI exlonded by PTB
,
' I I •,
,
~ I 10 " 10 .• 10'" 10·( 10 ·3 10 ·3 10.1 energy /M.V N 10 w 10~
•
'"
E u "-W•
u..
~•
313 25 213 15 le 5,
' 01" ,.,-!.: r~~ Lt (J -:.
:.f;
,.J,
PT8 QubmlLlQd oPQctrum unfolded: lnp.= GSF GSF ~ubmtLLed spectrum1
e·'
1e·'
113·' HI·' 113·' 113·' energy le·' 113.2 le·' /MeV 313,
,
25,
213.; •.
r:····~1
::~..
:". ':'e 15 u "-W le•
u..
5 04"-PTS ~ubmlLled spectrum - - u n f o l d e d : lnp.= IAR... IAR GubmtL led apac lrum
10·' 10·' 113·' 113·' 10·' 113·' 10·' le·' 10·' /MeV energy
':
, ·1 .1 CLAB-P. PTB meosuremen L 313 le 25n
, ,
:-< 213:' f ... ---_. -,
0 8 • • • • • • U • • • • _ - _ • • • • -• • • • • • • • - - - _ . , • • • _ ; ~•
---.;....,
-=-~-'"
'e 15 u "-.
,
' W le•
u..
5 - - - PTS Aubmlllod OpDC Lrum
- - - unfolded: lnp. =
KAr+ext-... KAI QX tQn dad by SANJ2
134"-'0'" 1 e -0 1 e'" 1 e _6 1 e's 10.04 10';' 10 -:t 1 0 _1 /MeV energy 313 25
,
,
213 ~•
"
'E 15 u "-W le•
u..
5 - - - PTS Gubmll.t..d spec t.r-um
- unfolded: lnp.= KAI .. PT8 .... _-.. KAI ext.ended by PTS , le , le 13"-; '"'''' 10·' 113·' le·' 113-' 10-' 113·' le·' 10·' 10·' d''', '''''''' '''''''' d'''', d"", d"" d" , d" ,-;-:';m, energy /MeV le :::!
"0
c (;-l>-n
o ;::l =:. ::l c"
Q.. ~'"
-l>-•
x 300 250 200 ~ 150 E o "-Wl00 x lI... 50 ,..L..: PTB GubmtllQd QPQcl~um --unfoldQd: lnp.= GSF .... -... GSF QubmlllQd apoclrum ,-13¥-le"' 10"' 13¥-le"' 13¥-le"' 13¥-le"' 13¥-le"' energy le"' 10"' le"' /MeV
'.
x 300 250 200 ~ 150 E o "-W100 x lI... 50 0'1" ._ _ , ... _
... : ... _
...
~._u...
~ "~ , ,0-" - - - PTS aubmlllad spectrum ---un1'olded: lnp.::z IARIAR DubmtllQd apQclrum
1I:l"' 1I:l"' le"' le"' le"' le"' energy
le"' le"' le"' /MeV Rlnghols-L. PT8 meosuremenl 31313 113 le
'.
x 2513 21313 ~ 1513 E o "-Wll313 x lI... 513 13'1":
.. r._uu. ____
. _ . u u u . ______ . u __ u • • ______ . . . . ______ u o . . . " - , : : r I,;
F ----"
~1'
---- ---- - PTS Ilubmlllod apecLrum - un1'olded: lnp. = l(AI~e)(t.."""""""" KAI ox tondod by SAl\()2
le"' le"' le"' le"' le"' le"' en e.rgy 113"' 113"' 113"' /MeV
'.
)( 31313 2513 21313 ": 150 E ~ wll313 )( lI...513 - - - PTS 8ubml lLed apec Lrum
- un'foldod: tnp.= KAI + PTS
KAI extended by PTS
le
e1r-: ... m, 111'"', I,,,,,, ,'Ii ... , ili ... • , " " ' . ill, .. , ,"iI', ... ;;:t ii"ii.
le"' le"' le"' 113"' le"' 113"' le"' le"' le"' le energy /MeV 'Tl rF.i" c: @
.,.
"""'
"
o ::> ~ 5"2i
0-~ IV V>1<11313 Rtnghols G.
PTB
meosuremenL see '7 (.I) 600•
C'< 'E u ,,-~ee w•
U. 21313 - - - PTS cubmtllod "poelrum --unt'oldod: lnp.= GSF .. _--- GSF aubmtllod .poetrum ---I ---I.: e1"..r;;, , ""'" " " ' " ' ' d''', "" ... , ""d, "'''' ,;;:[,"1 e'" 1 e -11 1 e" 10 -6 1 e·a 1 e -" 1 e 0;:1 1 e -2 1 e ·1
11300 800 -:.600
•
C'< E u "-~OO W•
U. 200 e't"r
,
'
,
I.: en ergy /Me V PTS oubmlllod apactrum unfolded: lnp.= IAR IAR cubmltLQd cpoct.rum...
'...
"" .. '.~-.-.-.--..
~.".:::...
-
... .
le" le·' le·' le·' 10·' 10·'energy 1
e·'
1e·'
1 13 ., /MeV le le 313CL AB - E. PTB
meosuremenL 25 :": 213-:
~ x'"
15 'E a "-W le x LL.,
5 - - - PTS eubmtllod 8pocLrum --un1'olded: tnp.= GSF_._--_.- GSF Qubm1.llQd cpoc lr-um
13
le·' 10 ., 10 .,. 1
e
_6 le·' le·' le·' le·' le·'energy /MeV 313-25 213
'"
151
J\
x'"
'eno,'
I: ~---;,..':1'-a "-W le x LL
5~
r
- - - PTS liIubmlLted cpoc lrurn- - un1'olded: tnp.= IAR
_._ ... IAR QubmlLlDd apoolrum
e
~::.;:.i;!:,1
IIIIIII[ I IIIII[ I I I I I U [ 111111', 1111111. IIIIUI~
I 1e
.'t le·' le·' HI·' le·' le·' le·' le·' le·'energy /MeV le le .", rIc' e:
;:;
-I'-~"
o ~.~
0-~ I" 0\27
Unfolding of the data measured with the GSF-BSS (Table 7, Fig 5)
Utilizing the submitted spectra as an input for the SAND 2 unfolding the shape of the spectra was generalIIy not changed, but rather high STDV values and the comparison of measured and calculated count rates (see also Table 8 and Fig. 6) clearly indicated that the data obtained with the 10" sphere were biased for the measurements at pos. E and L.
These findings were confirmed when the PTB spectra were used. Low STDV values (2.7-3.3) after a few iterations only showed that the PTB shapes were accepted. The resulting spectra are softer than the submitted GSF results. The corresponding DE values became therefore lower than the submitted ones, except for pos. G.
The application of the extrapolated KAI spectra did not result in any improvement concerning
the shape. The STDV values remained rather high (> 4) except for pos. D.
When used as input the IAR spectra were generally "hardened", the same experience as for the unfolding of the PTB data, but the total DE values are stilI much lower than the original GSF and PTB results. Thus, these attempts were also not satisfying.


![Table 6: Integral fluence and DE rates ([cm-' S-I] and [nSv/sj resp.) obtained for all PTB BS](https://thumb-eu.123doks.com/thumbv2/5dokorg/3345495.18817/29.898.50.851.266.1153/table-integral-fluence-rates-nsv-resp-obtained-ptb.webp)