Overview and Evaluation of the NESC
Projects for Fracture Assessments
of Nuclear Components
2011:05
Authors: Iradj Sattari-FarMikael Lorentzon
SSM perspective Background
The Network for Evaluation of Structural Components (NESC) was star-ted in 1993 and since then six different projects have been carried out. A seventh NESC-project is still in progress. The overall objective of these projects has been to study the reliability of the entire process of structu-ral integrity assessment within an international framework. The network is coordinated by the European Commission’s Joint Research Centre (JRC) in Petten, Netherlands, and involves a large number of participants from different countries, including Sweden.
Objectives of the project
The main purpose of this Swedish study was to identify and compile all the NESC-results that are of particular importance to the safety assess-ment of components with cracks and to the determination and evalua-tion of in-service inspecevalua-tion intervals.
Results
The report presents a collection of the main features of each NESC-pro-ject including material characterization, crack configurations, loadings, fracture assessments and important observations. It also provides a com-parison of different codes used in fracture prediction during the NESC-I test. Some important conclusions and recommendations for each of these projects can be found at the end of the report.
Future needs for research
At present there is no need for further research in this area.
Project information
Project leader at SSM: Kostas Xanthopoulos Project number: SSM 2008/30, 2037012-25
2011:05
Authors: Iradj Sattari-Far and Mikael Lorentzon, Inspecta Nuclear AB,Stockholm, Sweden
Overview and Evaluation of the NESC
Projects for Fracture Assessments
of Nuclear Components
This report concerns a study which has been conducted for the Swedish Radiation Safety Authority, SSM. The conclusions and view-points presented in the report are those of the author/authors and
TABLE OF CONTENT
SUMMARY ... 2
PREFACE ... 3
1 THE NESC-I PROJECT ... 5
1.1 GENERAL ASPECTS ... 5
1.2 CRACK GEOMETRY AND LOADING ... 5
1.3 MATERIAL CHARACTERIZATION ... 7
1.4 FRACTURE ANALYSIS ... 11
1.5 SOME IMPORTANT OBSERVATIONS ... 14
2 THE NESC-II PROJECT ... 19
2.1 GENERAL ASPECTS ... 19
2.2 CRACK GEOMETRY AND LOADING ... 19
2.3 MATERIAL CHARACTERIZATION ... 21
2.4 FRACTURE ANALYSIS ... 27
2.5 SOME IMPORTANT OBSERVATIONS ... 30
3 THE NESC-III PROJECT ... 33
3.1 GENERAL ASPECTS ... 33
3.2 CRACK GEOMETRY AND LOADING ... 33
3.3 MATERIAL CHARACTERISATION ... 36
3.4 FRACTURE ANALYSIS ... 38
3.5 SOME IMPORTANT OBSERVATIONS ... 41
4 THE NESC-IV PROJECT ... 44
4.1 GENERAL ASPECTS ... 44
4.2 CRACK GEOMETRY AND LOADING ... 44
4.3 MATERIAL CHARACTERIZATION ... 45
4.4 FRACTURE ANALYSIS ... 49
4.5 SOME IMPORTANT ISSUES ... 53
5 THE NESC-V PROJECT ... 56
5.1 GENERAL ASPECTS ... 56
5.2 CRACK GEOMETRY AND LOADING ... 56
5.3 MATERIAL CHARACTERISATION ... 63
5.4 FRACTURE ANALYSIS ... 64
5.5 SOME IMPORTANT ASPECTS ... 66
6 THE NESC-VI PROJECT ... 68
6.1 GENERAL ASPECTS ... 68
6.2 CRACK GEOMETRY AND LOADING ... 68
6.3 MATERIAL CHARACTERISATION ... 70
6.4 FRACTURE ANALYSIS ... 71
6.5 SOME IMPORTANT OBSERVATION ... 74
7 CONCLUSIONS AND RECOMMENDATIONS ... 76
SUMMARY
The overall objective of the NESC network has been to examine the reliability of the entire process of structural integrity assessment within an international framework. Within this network, six projects were conducted under the period of 1993-2008. The main targets of these projects were:
NESC-I: This project evaluated the interactions among various technical disciplines applied to the integrity assessment of a large-scale thermally shocked spinning cylinder experiment. The cylinder test was designed to simulate selected conditions associated with an ageing flawed reactor pressure vessel.
NESC-II: This project was on brittle crack initiation, propagation and arrest of shallow cracks in clad vessels under PTS loading. The results of this project underlined the conservatism of existing defects assessment procedures for shallow RPV flaws.
NESC-III: This project was to quantify the accuracy of structural integrity assessment procedures for defects in dissimilar welds. The project was built around the conducted ADIMEW-project to share its overall objectives and to provide additional input.
NESC-IV: This project was an experimental/analytical program to develop validated analysis methods for transferring fracture toughness data generated on standard test specimens to shallow flaws in reactor pressure vessel welds subject to biaxial loading in the lower-transition temperature region.
NESC-V: This project aimed to develop a European multi-level procedure for handling of thermal fatigue phenomena in the nuclear power plant components. It also aimed to create a database of service and mock-up data for better understanding of thermal fatigue damage mechanisms. NESC-VI: This project was an extension of the NESC-IV project. Embedded subclad racks in beam
specimens under uniaxial loading were studied to study the transferability of fracture toughness data between different crack configurations.
This report gives an overview report of these six NESC projects. The reports cover the main features of each project including; crack configurations, loading, material characterization, fracture assessments and important conclusions. Also given in this report is a comparison of different codes in fracture prediction of the NESC-I test. Based on this review study, some important conclusions and recommendations useful for the Swedish NPP are given.
PREFACE
The Network for Evaluation of Structural Components (NESC) was launched in 1993 to undertake large-scale collaborative projects capable of serving as international benchmarks for validating the total structural integrity process. The network is coordinated by the European Commission‟s Joint Research Centre (JRC) in Petten, Netherlands, and including nuclear power plant operators, manufacturers, regulators, service companies, and R&D organizations from different countries.
Under period of 1993-2008, six NESC project have been conducted. The overall objective of these NESC projects has been to study the reliability of the entire process of structural integrity assessment within an international framework. Simulation of PTS transient loading of a flawed RPV represents a logical choice for the focus of that study because of the substantial structural assessment challenges posed by the problem. The objective was accomplished through NESC-I by organising the assessment process into component disciplines and examining topics that included NDE accuracy and reliability, material properties data requirements, test measurement techniques, and appropriate levels of complexity for thermal/structural analyses and fracture assessments. The effectiveness of those disciplines in fulfilling their functions was evaluated using data generated during all phases of a highly structured program. An important goal of the NESC projects has been to reach a better understanding of the inter-dependencies among the component disciplines. In addition, results from those evaluations have been used:
To identify deficiencies within current techniques that could benefit from further research.
To identify important areas of uncertainty in the assessment process.
To identify methodologies that are effective in application and make recommendations on best practice techniques.
To explore the levels of conservatism within the existing structural integrity codes and standards, and where appropriate, to provide input for development of improved versions.
The main targets of the NESC projects were:
NESC-I: This project evaluated the interactions among various technical disciplines applied to the integrity assessment of a large-scale thermally shocked spinning cylinder experiment. The NESC-I spinning cylinder test was designed to simulate selected conditions associated with an ageing, flawed reactor pressure vessel subjected to severe pressurised thermal shock loading NESC-II: This project was on brittle crack initiation, propagation and arrest of shallow cracks in a clad
vessel under PTS loading. The results of this project underlined the conservatism of existing defects assessment procedures for shallow RPV flaws, and indicated the resistance to severe thermal shocks of degraded material containing simulated flaws.
NESC-III: This project studied the accuracy of structural integrity assessment procedures for defects in dissimilar welds. The NESC-III project was built around the conducted ADIMEW project to share its overall objectives and to provide additional input on a contribution-in-kind basis. NESC-IV: This project was an experimental/analytical program to develop validated analysis methods for
transferring fracture toughness data generated on standard test specimens to shallow flaws in reactor pressure vessel welds subject to biaxial loading in the lower-transition temperature region.
NESC-V: This project aimed to develop a European multi-level procedure for handling of thermal fatigue phenomena in the nuclear power plant components. It also aimed to create a database of service and mock-up data for better understanding of thermal fatigue damage mechanisms.
NESC-VI: This project was an extension of the NESC-IV project. Embedded subclad racks in beam specimens under uniaxial loading were studied to study the transferability of fracture toughness data between different crack configurations.
The main features of these six NESC projects are given in Table 1.
Table 1: Main information of the NESC projects.
Defect geometry Loading Test temp. (oC) Duration
NESC-I Deep surface and subclad cracks in thick cylinders
PTS From 290 to 5 1993-2001
NESC-II Shallow surface and subclad cracks in thick cylinders
PTS and axial tension
From 300 to 20 1999-2003
NESC-III Surface cracks in dissimilar welds of pipes
Uniaxial bending
300 2001-2006
NESC-IV Shallow surface and subclad cracks in beams Uniaxial and biaxial bending Between -100 and -40 2001-2006
NESC-V Different types Thermal
fatigue
Between 64 and 280
2003-2006
NESC-VI Shallow subclad cracks in beams
Uniaxial bending
Room temp. 2006-2008
For the NESC projects, different Task Groups were set up to carry out the work as follows: TG1 - Inspection/Non-Destructive Evaluation (NDE)
TG2 - Material Properties TG3 - Structural Analysis TG4 - Instrumentation TG5 - Co-ordination
ETF - Evaluation Task Force
DEAG - Destructive Examination Advisory Group
This report aims to give an overview description of all six NESC projects conducted so far. The report gives a collection of the main features of each project including; crack configurations, loading, material characterization, fracture assessments and important observations. Based on this review study, some conclusions and recommendations that may be useful for the Swedish nuclear power plants are given.
1 The NESC-I project
The NESC-I project was the first and the longest project among the six NESC projects that have been performed so far. It took more than 8 years (1993-2001) to conduct all the tasks within the project. NESC-I was sponsored jointly by the UK Health and Safety Executive (HSE) and the European Commission (EC). The countries participating in NESC-I were predominantly European (Austria, Belgium, Finland, France, Germany, Italy, Netherlands, Spain, Sweden, Switzerland, United Kingdom), along with Japan and the United States. Within those countries, more than 50 organisations have contributed to the NESC-I project since the launch of NESC in 1993.
1.1 GENERAL ASPECTS
The NESC-I project was the first and the longest project among the six NESC projects that have been performed so far. It took more than 8 years (1993-2001) to conduct all the tasks within the project. NESC-I was sponsored jointly by the UK Health and Safety Executive (HSE) and the European Commission (EC). The countries participating in NESC-I were predominantly European (Austria, Belgium, Finland, France, Germany, Italy, Netherlands, Spain, Sweden, Switzerland, United Kingdom), along with Japan and the United States. Within those countries, more than 50 organisations have contributed to the NESC-I project since the launch of NESC in 1993.
The project was focused on the total process of structural integrity assessment as applied to a fracture experiment involving a large, heated cylindrical specimen containing sharp defects (cracks) at or near the inner surface. A unique feature of the project was the inclusion of NDE as an integral part of a large-scale PTS fracture experiment, thus highlighting the influence of inspection data on RPV integrity assessments performed by structural analysts. A schematic of the different phases within the NESC-I project is shown in Fig. 1.1.
The NESC-I project covered the manufacture, testing, materials characterisation, instrumentation, non-destructive and non-destructive examinations, and structural/fracture assessments of the test cylinder. It tried to give an integrated assessment of the test, including an evaluation of interdisciplinary factors, relevance to reactor transients, technology transfer to nuclear and non-nuclear plant, and implications for national codes and standards.
Installation of different defects in the test cylinder was carried out by MPA-Stuttgart, Framatome and JRC/AEAT. All information regarding the fabrication, size and location of the defects was maintained secret throughout the pre-test and post-test NDE trials organised within the project.
Details of the activities conducted within the NESC-I project are given in Refs [I-1]-[I-6].
1.2 CRACK GEOMETRY AND LOADING
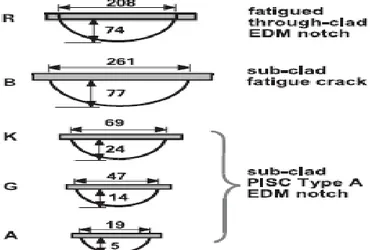
The test cylinder was manufactured from halves taken from the SC-4 and SC-6 (A 508 class 3) forgings previously tested at AEAT, with the yielded material machined from the inner surface. The specimen was welded in Germany, clad internally with austenitic steel in France, and finally heat-treated and machined in the UK. A total of 18 defects of varying sizes and types were introduced into the inner surface of the cylinder as below:
Five Class A EDM notches were fabricated prior to the cladding process.
Three large fatigue defects were included.
Ten cracks were installed sub-clad in two groups to simulate cold and hot cracks.
Post-weld and post-clad heat treatments of the NESC-I cylinder were conducted to essentially preserve the material and fracture toughness properties of SC-4 and SC-6. The pre-test inspection phase was conducted in a manner similar to that of the PISC trials to evaluate the effectiveness of current and proposed NDE procedures.
Fig. 1.1: Schematic of different phases within the NESC-I project.
Fig. 1.2: Defects considered in the fracture assessment analysis of NESC-I.
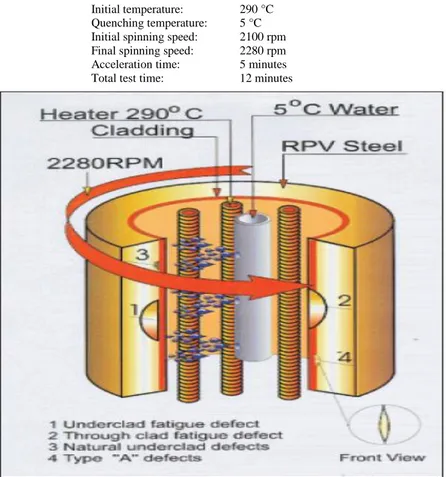
The test was conducted by AEAT in March 1997. The facility suspended the specimen about its axis of revolution and was capable of rotational speeds up to 2500 rpm. Prior to start of the test, the cylinder was heated uniformly to upper-shelf temperatures (293 °C). The planned thermal shock was applied by a water spray quench (2 °C) of the inner surface which was initiated when the cylinder reached a rotational
speed of 2,100 rpm. The quench continued for 12 minutes during which time the rotational speed was increased to a maximum of 2,400 rpm. A step change in output from certain strain gages was observed between 213 and 217 s and implied that the large through-clad flaw had experienced cleavage initiation at one end.
After the test, the large defects were opened at low temperature (in liquid nitrogen) to permit metallographic/fractographic studies of the fracture surfaces. Selected smaller notches were also opened for study, while others were left unopened and evaluated using high-quality X-ray images of the individual blocks. These examinations confirmed that the large through-clad flaw exhibited ductile tearing in the base and clad/HAZ material, which tripped to cleavage at one end under the clad/HAZ layer. The cleavage event arrested following a total flaw extension of approximately 12-15 mm just below the clad/HAZ region, thus confirming that a major objective of the experiment had been achieved. An unexpected result from these studies was the identification of substantial regions of intergranular fracture around the large sub-clad defect.
The main features of the thermal transient scenario used for the fracture assessments of the NESC-I test are in Fig. 1.3.
1.3 MATERIAL CHARACTERIZATION
The Materials Task Group (TG2) of NESC was responsible for conducting a comprehensive materials characterisation-testing programme to determine the physical, mechanical and fracture toughness properties of the forging, heat-affected zone (HAZ) and cladding of the cylinder specimen. Those data provided an essential part of the required input for thermal, structural and fracture mechanics analyses that were carried out by the Structural Analysis Task Group (TG3) during the pre-test and post-test phases of the project. TG2 focused on the following objectives:
Provide adequate and reliable data as required by the Structural Analysis Task Group to carry out thermal/structural/fracture analyses of the cylinder;
Study constraint effects on fracture toughness of the forging material;
Evaluate the effects of an extra tempering treatment (post-weld heat treatment) on fracture toughness of the forging material and on the properties of the cladding and heat-affected zone; The NESC-I cylinder specimen was fabricated from A 508 Class 3 steel subjected to a non-standard heat treatment to simulate radiation embrittlement of an RPV steel. The fabrication process utilised the remaining arcs of the previously tested cylinders SC-4 and SC-6. Summaries of the fabrication histories for these test cylinders and the chemical compositions of the base and cladding materials are given in Table 1.1.
Mechanical and thermal properties
Miniature tensile specimens were taken from the clad layer in the L orientation with respect to the welding direction. Tensile specimens were drawn from the HAZ in the L orientation referenced to the main forming direction during forging. The HAZ layer varied in thickness from 5 to 10 mm and the specimens were extracted at slightly different depths to sample material in four distinguishable categories defined for the HAZ. Properties of Young‟s Modulus, Poisson ratio, coefficient of thermal expansion, thermal conductivity, specific heat capacity and density were determined at temperatures of 25 °C and 300 °C. Linear relations approximating the temperature dependence of the elastic and thermal properties are given in Table 1.2.
Initial temperature: 290 °C Quenching temperature: 5 °C Initial spinning speed: 2100 rpm Final spinning speed: 2280 rpm Acceleration time: 5 minutes Total test time: 12 minutes
Fig. 1.3: Schematic of the NESC-I spinning cylinder test. Table 1.1: History of test cylinders SC-4 and SC-6. Forging produced by Forgemasters Engineering, UK
Heat treatment
- Austenization: 6 h at 950 °C - Quench: Water quench from 950 °C - Temper: 8 h at 580°C ± 10°C
Spinning cylinder tests at AEA Technology, Risley, UK - Quench, initial temperature: 300 °C
- maximum rotational speed: 530 rpm (SC-4); 2000 rpm (SC-6) - maximum heat transfer coeff.: 22,000 W/m °C
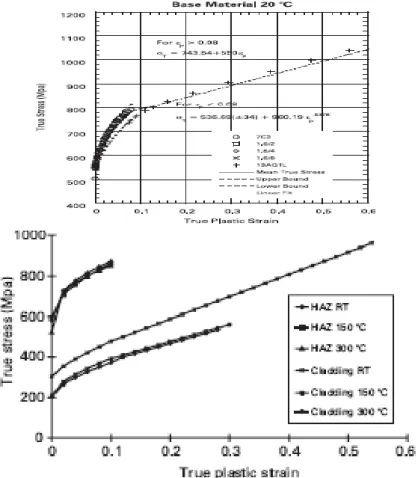
True stress versus true plastic-strain curves were constructed from tensile test data as functions of temperature for the base forging, HAZ and clad layers. The tensile tests were performed at 20 °C, 150 °C and 300 °C in an air environment. Mean curves fitted to the tensile data are depicted in Fig. 1.4.
Hardness measurements and optical microscopy were performed to determine the shape and thickness of the cladding and HAZ. The thickness of the HAZ varied in the range from 5 to 10 mm. Curves depicted in Fig. 1.5 illustrate the elevation in hardness measured across the maximum HAZ width position. Hardness values in the thin part of the HAZ were slightly higher than those in the thickest part.
Fig. 1.4: True stress - true plastic strain curves of the NESC-I materials.
Fracture toughness testing
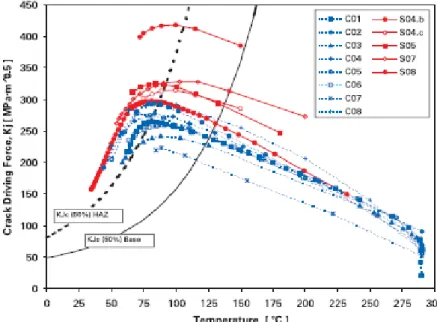
Static fracture toughness testing was carried out using the ESIS P2-92 and ASTM 1152-87 standards applied to CT specimens and three-point bend specimens (thickness of 2.5, 5, 10 and 25 mm). The fracture toughness data were analysed by the Master Curve Approach. Fracture toughness curves of the base material corresponding to the 5, 50 and 95 percent fracture probabilities are given in Fig. 1.6.
The Master Curve reference temperature for the base metal and the HAZ were determined to be To = 68 °C and 16 °C, respectively. Tests were also conducted on the base material using three-point bend specimens (thickness of 25 mm) with a/W ratios of 0.1 and 0.5 to study shallow crack effects on cleavage fracture toughness in the transition temperature region. The shallow crack data generated from the a/W = 0.1 specimens implied a transition temperature of To = 32 °C.
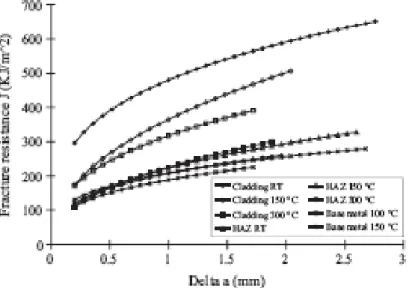
The J-resistance data for the cladding, HAZ and base metal were determined according to the ESIS P2-92 procedure utilising the single specimen technique that allows for crack growth. Testing was conducted by ECN, ENEL and IWM. The fracture toughness data for each material in terms of J- Δa curves are given in Fig. 1.7.
Fig. 1.5: Hardness distribution measured across the cladding/HAZ in the NESC-I cylinder.
Fig. 1.6: Static fracture toughness of the base metal with specimen thickness 10 mm and 25 mm.
1.4 FRACTURE ANALYSIS
The Structural Analysis Group (TG3) of the project organised pre-test analyses both simplified and sophisticated analytical techniques. After the test was performed, the TG3 members conducted post-test analyses that included the influencing factors in fracture assessment of the defects.
Pre-test analysis
A series of thermal, structural and fracture mechanics analyses were performed to generate pre-test predictions for defect behaviour during the proposed spinning cylinder test. These analyses were based on the defect dimensions recorded during the inspection trials conducted by TG1 and on the material properties database developed by TG2. Predictions were given in terms of the extent of crack growth by ductile tearing and the time to cleavage initiation during the thermal shock transient. The analysis matrix included those defects in the cylinder that were perceived to have significance for the structural integrity assessment process.
The pre-test analyses focused on five defects shown in Fig. 1.2. Comparisons of thermal and stress analyses performed for the pre-test analysis matrix are provided in Fig. 1.8. It showed very good agreement in the temperature results, and rather good agreement in the stress results. Differences in the stress distributions near the inside surface of the cylinder are due to variations in approach to modelling of the clad and HAZ regions.
Fig. 1.9 showed the prediction of ductile tearing and cleavage fracture mechanisms in the form of K versus crack tip temperature curves for a finite-element model of through-clad defect R. It includes the cleavage fracture toughness confidence curves (5-95%) from small-specimen data and the ductile tearing toughness curves corresponding to 0.1, 0.5 and 2 mm crack growth. No brittle fracture initiation was expected at P9 because only the decreasing branch of KI intersects the scatter band of cleavage fracture toughness, indicating a warm pre-stressed condition. Furthermore, comparison of the applied KI curve for point P6 with the fracture toughness confidence curves implies a high probability of cleavage fracture initiation after approximately 150 s.
Fig. 1.8: Through-wall temperature and circumferential stress distributions computed at 300 seconds into the transient obtained from the pre-test analyses.
Fig. 1.10 depicts a summary of fracture assessments performed for the large through-clad defect R at (or near) the HAZ/base metal interface. It was observed that the spread in results for the simplified approaches is larger than that for the 3-D finite-element analyses. The pre-test fracture assessments predicted that the large defects in the spinning cylinder would initiate in the base metal immediately beneath the HAZ and extend in the axial direction; no cleavage extension was predicted in the radial direction (i.e., into the cylinder wall).
Fig. 1.9: Pre-test fracture assessment of different crack front positions in base metal of defect R.
Fig. 1.10: Computed stress-intensity factor versus crack-tip temperature at HAZ/base metal interface of defect R in the pre-test analyses.
Post-test analysis
Post-test analyses incorporated the loading conditions recorded during the test and the initial defect dimensions determined during the destructive examination of the cylinder. Fracture assessments were carried out both in the context of a Master Curve methodology and a coupled cleavage-ductile local approach formulation. Consideration was given to other factors that were likely to have influenced behaviour of the large defects during the thermal shock transient.
The majority of the post-test studies exploited the Master Curve description of material toughness to infer the probability of a cleavage event. A schematic drawing of the idealised defect R is shown in Fig. 1.11. The two near-surface crack tips are asymmetrically sited in 'narrow' HAZ (nominally 5mm) as seen on the left and 'wide' HAZ (nominally 10mm) as seen on the right. Results of the analyses on these two defects are briefly given below:
Master Curve analysis of surface defect R
At point 6 located 11.5 mm below surface in BM and near HAZ/BM interface, the results predict a failure probability of Pf = 1.0; the temperature range is such that ductile tearing would be expected before failure by cleavage. The actual behaviour was that no cleavage was observed, although several millimetres of tearing occurred at this point. The amount of ductile tearing was predicted to be greater than 5 mm, based on data at 150 °C.
At point located 16.5 mm below surface at cleavage initiation site, the results indicate Pf = 1.0 for probability of cleavage fracture. The actual event at this point was initiation of a cleavage fracture after some 3 mm of stable tearing.
At point located 28 mm below surface, the results predicting low cleavage probability and ~4 mm of stable tearing are consistent with observed behaviour.
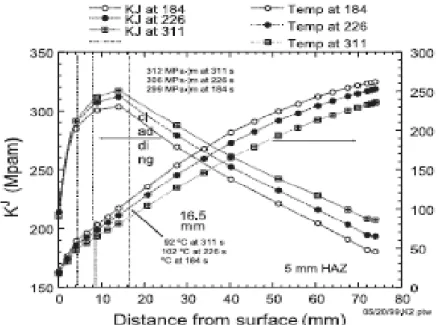
At position located approximately 70 mm below the surface, the results predict zero probability of cleavage initiation; the temperature is sufficiently high that only ductile tearing would be expected. The actual fracture surface shows small cleavage facets close to the base of the crack. The K-T of defect R at different positions along the crack front are shown in Fig. 1.12.
Maste Curve analysis of defect B
This required estimates of K, T under peak driving force conditions since no cleavage event could be identified. Results from the conducted analyses provided some evidence of possible constraint effects up to a distance approximately 14 mm into the cylinder wall, i.e. up to the HAZ/BM interface. At a point 9 mm below the surface (in the middle of the HAZ), predictions were for stable tearing in excess of 5 mm, followed by a cleavage event (Pf = 1.0). While no cleavage occurred, ductile tearing up to 4.5 mm was observed.
Fig. 1.12: Driving force transients for the through clad defect R assuming a narrow 5 mm HAZ.
1.5 SOME IMPORTANT OBSERVATIONS
Structural assessment of the local cladding failure
The analysis indicated that the cladding above subclad defect B experienced very high circumferential stresses and high levels of plastic deformation during the test. For the cladding above the deepest point of the defect, these stresses were sufficiently high to produce conditions for plastic collapse and rupture. These calculations are consistent with the extent of deformation and failure actually incurred by the cladding over defect B during the experiment.
Constraint Effects
Constraint is a key factor in the transferability of fracture toughness data generated on standard specimens to defects in actual components. The conventional approach of applying fracture data relevant to plane strain (i.e., high constraint conditions) may introduce an unnecessary level of conservatism in many situations.
Constraint consideration of the test indicated that the low-constraint region extends just beyond the HAZ/BM interface. That prediction is reasonably consistent with the observation that no cleavage initiation occurred close to the HAZ boundary in either of the defects R and B, although it would have been expected from computed failure probabilities based on deep-notch fracture toughness data.
Gradients in material properties
The fact that defect R did not initiate in cleavage at the wide HAZ end, although it was predicted to do so prior to t = 311 s, cannot be explained satisfactorily either in terms of reduced crack-tip constraint at that location compared with position X, or by the modest reduction in the driving force due to the increased HAZ thickness. Instead the absence of a cleavage event is thought likely to be linked to the fact that even below the HAZ, the toughness will decrease gradually back to the nominal base material level. Where the HAZ is deepest, this region could have extended over the region in which a cleavage event was anticipated. Post-test examinations confirm that the base material hardness was modified to a depth of approximately 10 mm below the visible HAZ boundary.
Evidence For Warm Pre-Stressing Effects
the latter stages of the transient during which both the crack driving force and the temperature are decreasing. Since the NESC-I test was designed to achieve a cleavage event at the large defects, care was taken to avoid WPS by choosing a lower starting temperature and by accelerating the spin velocity at an appropriate moment to maintain an increasing crack driving force.
The fact that the desired cleavage event was achieved at the large through-clad defect R shows that WPS effects were absent (or not significant) at that position at the moment of initiation. Therefore, the assessment of the role of WPS was limited to areas where no cleavage occurred, i.e. in the BM of the cylinder wall located away from the HAZ/BM interface.
Cladding Effects
In terms of structural analysis, the cladding is important in several ways:
The severity of the PTS can be diminished on account of the lower thermal conductivity of the austenitic clad with respect to the ferritic BM.
Beneficial warm pre-stressing effects (WPS) are more likely since the crack driving force reaches a maximum at a higher temperature.
The presence of cladding above sub-clad defects can mechanically impede their opening.
The clad residual stresses arising from thermal mismatch can influence the driving force estimates.
For many codes and standard assessment procedures, the cladding mechanical properties cannot be taken into account, however the overall assumed defect depth must include the clad thickness. For small sub-clad defect this can be a significant penalising factor.
The defect B has been simulated as both a through- and sub-clad flaw to quantify this beneficial influence of the cladding on crack driving forces in the near-surface region. It was shown that an intact cladding above defect B reduces the local crack driving forces by up to 24%.
Destructive examination
Crack extension was observed along the entire crack front of defect R. Initial tearing was followed by a significant local cleavage event in the region just below the clad HAZ, as can be seen in the upper part in Fig. 1.13. In this region, the maximum crack extension was measured to be 17 mm. The point of initiation for this cleavage event is about 16.5 mm below the clad surface. The subsequent SEM examination confirmed that the initial extension was by ductile tearing before the cleavage event was triggered. Within the HAZ little ductile tearing is evident. However, a finger of brittle intergranular fracture can be seen in Fig. 1.13 that propagated in the axial direction of the cylinder; this may be linked to a more brittle segregated zone.
Crack extension occurred along the entire initial crack front in the large sub-clad defect B, as illustrated schematically in Fig. 1.14. The maximum crack extension of 15 mm had occurred just below the HAZ. At the deepest part of the defect, the crack extension was up to 4.5 mm. At the end of the defect, the mechanism of extension was mainly intergranular cracking, whereas at the opposite end it was initially intergranular, followed by evidence of ductile tearing. At deeper positions of the defect front the ductile tearing mode became predominant. Along the tip of the fatigue defect there was evidence of a large stretch zone, indicating that a considerable driving force was needed to initiate the crack advance.
Codes and standards approach
Defects found during manufacture or in service are normally assessed using the rules of the appropriate national design or defect assessment code. These rules are designed to yield pessimistic results, so that an adequate safety margin can be maintained in service. They are therefore not suitable for best estimate test
predictions. Summary results of the assessments based on the different codes and standards are given in the following table. Some conclusions and issues related to these assessments are given below:
There is a surprising measure of agreement between the different codes, despite the differences in methodology. All agree in predicting very shallow acceptable defects.
All the assessments predict very small allowable defect depths, in the range 1 mm to 9 mm deep. These contrast with behaviour during the test, in which only limited crack growth took place from defects 75-80 mm deep.
The pessimism in the code assessments is due both to overestimates in the crack driving force and to the use of pessimistic material properties for shallow cracks.
Code-based methods are more pessimistic when applied to the near-surface regions of defects than when applied to the maximum depth points. The pessimism of code-based methods applied to shallow sub-clad defects is excessive.
For large surface defects through the cladding, standard assessment techniques provide a good estimate of crack driving force at the maximum depth point, although care must be taken defining the defect position and dimensions.
For smaller sub-clad defects, standard assessment methods are very pessimistic compared with cracked body analyses. This is caused primarily by the assumption that the cladding is ineffective, which is manifestly untrue.
Most code assessments deliberately use lower bound fracture data, either as measured 5% failure probability curves or as a lower bound design curve. Clearly this introduces pessimism, but it is necessary pessimism. Some codes then require additional safety factors on this lower bound data. Constraint effects are difficult to quantify, so are generally ignored in code assessments. They affect shallow defects and the near surface regions of large defects.
Fig. 1.13: Fracture surface of defect R showing the crack propagation and cleavage event site.
2 The NESC-II project
2.1 GENERAL ASPECTS
The tests planned in NESC-II simulated an irradiated material. The combination of the shallow defect geometry, the loading configuration and the low toughness material condition presented a distinct challenge from that addressed in the NESC-I experiment, while allowing the network to build on experience of the lessons learned for applying an integrated assessment approach.
The testing concept utilises a thick-walled hollow cylinder that was welded at both ends to the grips of a 100 MN tensile testing machine. In addition to axial load, the specimens were loaded by internal pressure (pressurised water up to 300 bar and 300°C). The thermal shock cooling was achieved by spraying cold water evenly over the inner surface of the cylindrical specimen.
In 1996 a project was launched with the sponsorship of the German Federal Government, first under the control of the Ministry for Education and Research (BMBF), and later taken over by the Ministry for Economics and Technology (BMWi). The planned tests were to show the influence of the cladding on the behaviour of cracks in the base material in the transition regime of fracture toughness under the PTS loading. The programme foresaw two tests: the first, denoted NP2, would be carried out on a test component containing a fully circumferential sub clad crack. The second, NP1, would contain two semi-elliptical surface breaking defects.
In July 1998 MPA-Stuttgart contacted the NESC Network Management to propose that these two PTS experiments be adopted as the core of a new NESC project. It was foreseen that NESC participation could provide:
Important additional data concerning the influence of the clad/HAZ region on the fracture behaviour of shallow through and sub-clad defects, the size and geometry of which have great relevance to RPV assessment for emergency cooling transients i.e. PTS.
Additional experience with material characterisation and fracture toughness measurements in RPV material subject to cladding processes.
Further confirmation of the predictive capabilities of fracture mechanics and micromechanics analysis methods applied to this type of problem
Further confirmations about the sizing capabilities of NDE methods applied to through-clad and sub-clad defects in RPV materials.
Details of the activities conducted within the NESC-II project are given in Refs [II-1]-[II-4].
2.2 CRACK GEOMETRY AND LOADING
Two cylinder test pieces were designed to meet the test objectives. One cylinder with the designation NP1 contained two semi-elliptic through clad circumferential cracks. The other cylinder with the designation NP2 contained one circumferential crack buried under the cladding. Fig. 2.1 shows the geometry information of these two cylinders.
For static loading, a tensile testing machine with a maximum load of 100 MN was built at MPA Stuttgart in 1979. For the case of pressurized thermal shock (PTS) loading a test loop was designed for the 100 MN testing machine. Within this test facility large-scale hollow cylindrical specimens up to an outer diameter of 800 mm and a wall thickness of 200 mm could be heated up on the outer surface up to 350°C and could be quenched on the inner surface with water of ambient temperature. Simultaneously an axial
force of up to 100 MN loaded the specimen. The test loop was designed for internal pressure up to 35 MPa (350 bar). The flow rate was up to 17.2 litters/sec.
Fig. 2.1: Geometry of specimen NP1 and NP2.
A model material KS22 was available at MPA, which could be heated treated to suitably modify the mechanical properties. A series of experiments were performed to optimise the heat treatments. The chosen heat treatment for the actual material before cladding was to austenitise at 1000 oC for 8h and oil quench, then to temper at 680oC for 16h and air cool followed by 710oC for 13h with a final air cool. The test cylinders and reserve pieces were clad and heat treated as a single component. The cladding direction was parallel to the axis of the test cylinders. The curvature of the test cylinder required the use of 30 mm strips of clad material instead of 60 mm strips. The cladding was welded in two layers with a total thickness of 8 mm. Subsequently the stress relief heat treatment was made at 650oC for 6.5 h. Therefore no change in mechanical properties was expected. Heating and cooling between the various stages was made smoothly with temperature changes not higher than 20 K/h. In addition, in the case of the NP2 test piece, a fatigue crack was inserted before cladding. There was no change of crack geometry in the base material after welding and stress relief heat treatment.
In specimen NP1 the final crack depth of notch A was 23.8 mm and of notch B 19.6 mm. The crack length was 63 mm for notch A and 59 mm for notch B. These dimensions have been determined at the
Ri = 202.5
mm
Ro = 391.1 mm
Applied axial force
Pressur e at inner surface Base material 17 MoV 8 4 Rest mat. mate rial
broken crack section after the thermal shock test. Both defects were sealed to avoid the intrusion of water during quench. The average depth of the pre-fatigued notch in specimen NP2 is 8 mm, so the crack tip is located beneath heat affected zone in unaffected base material. The measurement was done with an ultrasonic method before the PTS test, and confirmed with measurements after the PTS test.
Both NP1 and NP2 tests were run in a similar manner. The specimens were filled with water and were then heated up to foreseen starting temperature level and profile, as assumed in the pretest analyses. During the heating phase the system was pressurised to avoid boiling. Then the high pressure pumps were started. The external force was applied. The electrical heating was switched off to avoid any malfunction of the readings. By switching the valves the flow changed from the bypass branch to the specimen branch. Quench of the inner surface then started.
The internal pressure in specimen NP1 was 7.8 MPa during the test. Slight changes of about 0.1 MPa occurred in the very first stage of quenching. The external force was kept constant at 20 MN for about 2000 sec after start of quench. Fig. 2.2 shows the temperature profile in the wall of the cylinder for various time steps. The influence of the different conductivity of the austenitic cladding and the ferritic base material may be seen near the inner surface. The cladding acts to insulate the base material and therefore leads to a shallower overall thermal gradient than without cladding. The measurement of the acoustic emission did not show any events pointing to crack initiation.
The internal pressure in specimen NP2 was 5.8 MPa during the test. Slight changes of about 0.1 MPa occurred in the very first stage of quenching. The external force was kept constant at 43 MN for about 1800 sec after start of quench.
2.3 MATERIAL CHARACTERIZATION
The material used for the NP1 and NP2 components was type “17 MoV 8 4 mod”, machined from the cylinder used in the previous NT3 PTS experiment, which in turn was fabricated from the K22 model material, designed to simulate the end-of-life condition of RPV welds. The major difference between the material used for the NP1 and NP2 components and the NT3 cylinder was the deposition of a two-layer cladding and the subsequent stress relief heat treatment. The composition of the base and clad materials is shown in Table 2.1. Fig. 2.3 shows the hardness profile across a radial section of the clad cylinder. After the NP2 test, the specimen was cut into 24 segments. Material was set aside for fracture testing from between cuts 5 and 7 i.e. the region of the specimen in which the extent of crack extension was greatest. This material is denominated “NP2”. Lastly, reference is made to the so-called rest material or extension material. This was the 508 Cl.2 steel used to extend the cylindrical test section to the grips inserted in the test machine.
Physical and mechanical properties
Fig. 2.4 shows the physical and mechanical parameters of the base and cladding materials at different temperatures. For the base material, the reference temperature is 35oC, which implies that the value given for is the total thermal expansion coefficient between the stated temperature and the reference temperature. The properties of the cladding material are based on investigations within the NESC-I project. In this case the thermal expansion coefficient data are total values with respect to ambient (25°C). The elastic modulus values for the base material and the cladding material are also given in Fig. 2.4. The Poissons ratio is assumed constant at 0.3.
Tensile testing was performed on specimens from the base and cladding materials to provide stress-strain curves as input to the finite element fracture models. The plastic strain versus stress data at 20, 150 and 300°C are shown in Fig. 2.4.
Charpy impact energy data for the 17MoV 8 4 mod base material and the heat affected zone (HAZ) induced by the cladding process are compared in Fig. 2.5. The data were labelled as being from NP1, in the LS & TL orientation and NP2 in the LS orientation for the base material and LS for the HAZ
material. It was observed that for the base material, there was essentially no difference between the data from the NP1 and NP2 series or between the data in the LS and TL orientations. Analysis of the combined data set showed the 41J temperature, TE41, to be 116.1ºC.
Fig. 2.2: Temperature profiles for test NP1 (above) and test NP2 (below) during the tests.
Table 2.1: Composition of base 17 MoV 8 4 mod and clad materials.
Fracture toughness testing
Fracture toughness testing was conducted at MPA, VTT and IWM laboratories. A brief presentation of these results including considerations of the Master Curve methodology and constraint is given below. MPA supplied the project with existing data for the NT3 material and results of testing performed on the NP material. For the NT3 material, compact, C(T), specimens of a range of thicknesses between 15 and 50mm were tested using both deeply notched (a/W ~ 0.5) and shallow notch (a/W ~ 0.1) specimens. For the NP material, a/W ~ 0.55 (10×20 and 20×20 SE(B) specimens were tested. All these specimens were 20% side-grooved. The data provided were toughness, KJc, at specimen fracture and KJi, toughness at „true‟ initiation, based on measurements of stretch zone width (SZW) on the specimen surfaces. After the NP1 and NP2 tests, the results of a limited amount of HAZ toughness testing on Charpy-size, 10×10 SE(B), specimens of NP material also became available. These data provide further evidence of the higher toughness properties of HAZ relative to base material. The MPA results are given in Table 2.2. VTT conducted fracture toughness testing on 20% side-grooved 10×10 SE(B) specimens over a range of temperatures. Twenty deeply notched (a/W ~ 0.5) and seven shallow notch (a/W ~ 0.1) specimens were tested. The crack propagation direction in these specimens was circumferential. Deep notch specimens were tested at ~-50ºC, room temperature (22ºC), ~50ºC and ~150ºC. Shallow notch specimens were tested at room temperature only. The Master Curve analysis of fracture toughness data from the different laboratories and the determined T0–values are shown in Fig. 2.6.
Analysis of the VTT and IWM data for shallow notch (a/W = 0.1), low constraint yielded a To estimate of 28.5ºC. This represents a shift in To of -37ºC with respect to the value determined for the deep notch (a/W=0.5) specimens and is attributed to constraint loss effects. A very similar shift was observed in the NESC-I materials testing.
Fig. 2.4: Stress-plastic strain curves for the base and clad materials.
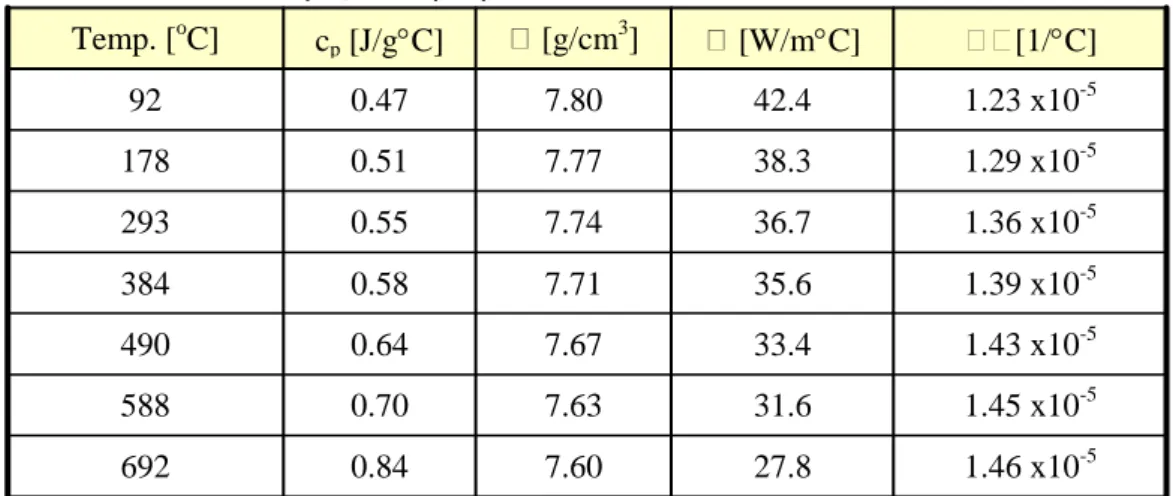
Thermo-physical properties of the 17 MoV84 base material 1.46 x10⁻⁵ 27.8 7.60 0.84 692 1.45 x10⁻⁵ 31.6 7.63 0.70 588 1.43 x10⁻⁵ 33.4 7.67 0.64 490 1.39 x10⁻⁵ 35.6 7.71 0.58 384 1.36 x10⁻⁵ 36.7 7.74 0.55 293 1.29 x10⁻⁵ 38.3 7.77 0.51 178 1.23 x10⁻⁵ 42.4 7.80 0.47 92 [1/C] [W/mC] [g/cm3 ] cp [J/gC] Temp. [oC]
Thermo-physical properties of the Type 347 cladding material 1.73 x10⁻⁵ -300 1.70 x10⁻⁵ 18.55 -0.55 250 1.65 x10⁻⁵ 16.59 -0.52 150 1.61 x10⁻⁵ 14.36 -0.48 25 [1/C] [W/mC] [g/cm3 ] cp [J/gC] Temp. [oC]
Young’s Modulus Data for cladding and base materials 191 -300 -127 250 201 139 150 210 152 20 Base material Cladding Temperature (C)
Fig. 2.5: Comparison of the Charpy impact energy data for the base material and the HAZ.
Table 2.2: Fracture toughness data of the NP material conducted by MPA.
Specimen Temp. [°C] E [GPa] Str. zone [mm] Ji [N/mm] KJi [MPam] Jc [N/mm] KJc [MPam] Section [mm2] NP1 HA1 23 210 0.016 22 71 50 107 10x20 NP1 HA8 50 216 0.026 18 65 66 125 10x20 NP1 HA6 75 216 0.025 27 80 75 133 10x20 NP1 HA2 100 216 0.029 22 72 58 117 10x20 NP1 HA5 150 200 0.044 37 90 10x20 NP1 HA3 200 200 0.032 28 78 10x20 NP1 HA4 300 190 0.037 42 94 10x20 NP1 AA4 23 210 0.008 18 64 18 64 20x20 NP1 AA2 50 210 0.024 19 66 55 113 20x20 NP1 AA5 75 216 0.023 22 72 32 87 20x20 NP1 AA1 100 216 0.032 31 86 50 109 20x20 NP1 AA3 150 200 0.031 37 90 20x20
For the specimens taken from the HAZ material, only five toughness data were available, including two „no failures‟. All results were above the E1921 KJc limit criterion. Ignoring this limitation, a To value of about 4ºC can be determined, which implies a shift of - 62ºC with respect to the NP base material. This agrees with the Charpy data for the HAZ (which show a reduction of TE41 of approximately 118ºC) and indicates that the HAZ is considerably tougher than the base material.
Comparison of ASME RTNDT and RTTo curves
At the request of several members of TG3, the representation of the fracture toughness transition curve using the ASME reference temperature parameters RTNDT and RTTo was also considered.
Determination of RTNDT posed a problem for the 17 MoV 8 4 mod material, since no drop weight tests had been made i.e. no TNDT value was available. However by combining the three sets of Charpy
absorbed energy data for base material, it was possible to develop a curve based on the lowest datum at each of a number of test temperatures. This is in accordance with the method described in the ASME Code, Section 3, Sub-Section NB2331(a) to determine the temperature at which 68J is absorbed.
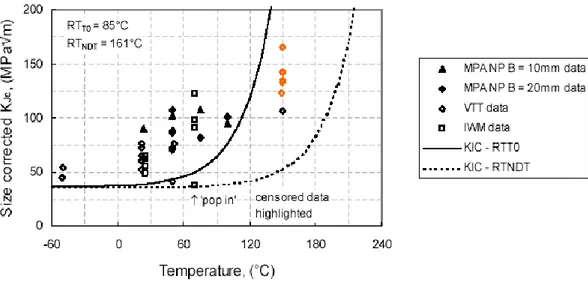
Alternatively, the RTTo parameter defined in Code Case N-629 as To + 19.4°C may also be considered. For the NP material, this yields RTTo = 85°C. The corresponding RTTo and RTNDT transition curves are shown in Fig. 2.7. It is seen that the curve based on RTNDT is a very conservative bound to the transition regime toughness data.
Fig. 2.6: Master Curve analysis of data from deep cracked specimens of the base material.
2.4 FRACTURE ANALYSIS
Pre-test analyses were performed, leading to recommendations concerning the test conditions of NP1 and NP2 tests. After the tests, post-test analyses were conducted based on a problem definition of the tests. The post-test analyses are briefly described below.
The fracture analyses of the two problems were conducted using refined elasto-plastic cracked body finite element analyses as well as simpler so-called engineering methods. The refined models are assumed to give accurate solutions of the relevant parameters such as crack driving forces and constraints against plasticity. The refined cracked body analyses conducted by the different partners were very similar with respect to finite element meshing, assumed defect geometry, analysis procedure and calculation of crack driving forces.
All partners modelled the subclad defect problem as an axisymmetric problem. The IWM model used the maximum depth, 10.5mm, in the analysis whereas all other partners used the average crack depth 8 mm. For the problem NP1, double symmetry was assumed and only one eighth of the vessel was modelled. The defect A being the most critical one was modelled using more or less its exact geometry. The heat conduction and stress analyses were conducted separately. The thermal analysis was first performed using the prescribed thermal transients and the resulting temperature distributions were subsequently imposed in the mechanical analysis to generate thermal stresses along with the mechanical loads. The elastic-plastic stress intensity factor, KJ was used to predict the failure probability. The J-integral was calculated using 2D or 3D domain integrals and assuming deformation plasticity. BE conducted a thorough investigation using so-called engineering approaches, in particular the British R6-method. In the R6 analyses the so-called simplified secondary load assumption was adopted and crack driving forces were calculated using weight function technique. In addition the French RSE-M and the American ASME XI methods were also used to a smaller extent. The following gives a brief description and discussion of the post-test analyses.
Analysis of the circumferential sub-clad defect (NP2)
The post-test problem definition contained a transient definition for the test that specified a more severe fluid temperature transient than in the pre-test definition coupled with considerably reduced inner surface heat transfer coefficients (the peak heat transfer coefficient was 2.9 kW/m2K compared to 15kW/m2K in the pre-test definition). BE, IWM and Framatome performed post-test analyses of the NP2 transient using ABAQUS. The analyses from the different partners were very similar. Fig. 2.8 depicts the measured and computed temperature histories at the inner and outer surface and at the location of the deep crack tip. It is obvious that the actual test cylinder cooled faster near the inner surface than predicted by thermal analyses using the data from the problem definition. This discrepancy at the inner surface is believed to be linked to either uncertainty of the actual heat transfer or temperature transient at the surface. BE used constant heat transfer coefficients in the analyses whereas Framatome did not make this assumption, but both approaches resulted in the same inconsistency at the inner surface. BE adopted also the pre-test inner surface fluid temperature definition with a constant heat transfer coefficient and this gave a much better prediction of temperatures near the inner surface. This suggests that the temperature discrepancy for the inner surface was primarily due to uncertainty in the transient.
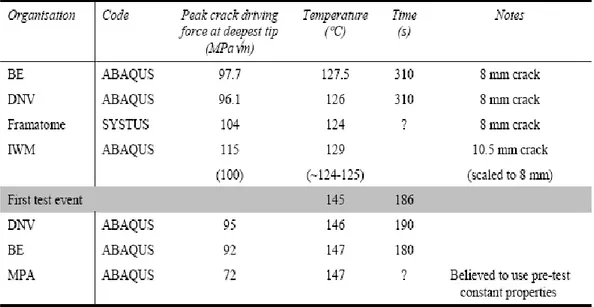
Five organisations produced non-linear cracked body finite element post-test analyses of the NP2 test; BE, MPA DNV and IWM, all using ABAQUS; and Framatome, using SYSTUS. Table 2.3 presents details of these analyses. The agreement between post-test analyses from the different partners is very good. The IWM analysis used the maximum crack size of 10.5 mm rather than the mean crack size of 8 mm chosen by the other analysts.
The crack driving force at the two crack tips computed by DNV is shown in Fig. 2.9 versus time into transient at the crack tip respectively. The crack driving force is higher for the deep crack tip than for the one located in the clad/HAZ interface. The HAZ is also generally tougher than the base material and crack growth is therefore primarily expected to occur at the deep tip.
Fig. 2.8: Comparison between calculated and measured temperature data for NP2.
Table 2.3: Summary of peak crack driving forces predicted by NP2 post-test analyses.
Analysis of the semi-elliptical through-clad defects (NP1)
The inner surface temperature transients specified in the pre and post-test definition documents were very similar. However, the inner surface heat transfer coefficient for the post-test transient was much lower than that assumed prior to testing. The computed temperature distributions reproduced the measured temperatures fairly well when the post-test definitions were used.
The predictions from the different refined non-linear cracked body analyses were as expected very similar when the same data was used. In the presentation of results and discussion below, results from only one partner will often be shown, knowing that the other partners had very similar results if not stated otherwise.
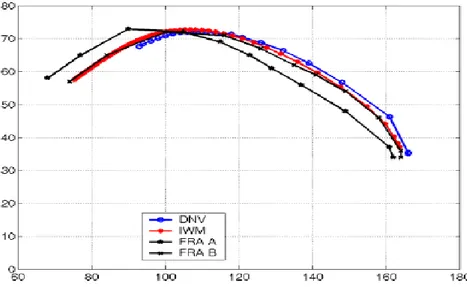
Three organisations performed non-linear cracked body analyses of the NP1 test. They were DNV, IWM and Framatome. This problem is more complicated to analyse since the crack tip loading varies along the front in the model. The defect A was considered to be the most critical one and was the adopted defect in conjunction with double symmetry in the analyses. Agreement between the three predictions at the deepest point was impressive as can be seen in Fig. 2.10. Only DNV reported the variation of crack driving force around the crack front, and their predictions for the HAZ 11 mm beneath the inner surface, and cladding 1.9 mm beneath the inner surface, are compared with the deepest point in Fig. 2.11. It can be seen that the crack driving force in the near-surface region is somewhat higher than at the maximum depth position. As mentioned above, the toughness of the HAZ is expected to be higher than for the base material so crack extension, if it occurs, is most likely at the deepest point.
DNV Consulting have made estimates of the level of constraint along the crack fronts using different constraint theories. Fig. 2.12 depicts the computed variation of different constraint parameters along the crack front in NP1. The DNV analyses predicted virtually no constraint loss for NP1 except close to the inner surface where constraint loss was predicted.
Fig. 2.9: Computed applied KJ of the NP2 subclad defect at two crack tip positions.
Fig. 2.11: Comparison of DNV predictions for applied KJ as function of temperature at deepest point, in the HAZ, and in the cladding for NP1.
-1.0 -0.5 0.0 0.5 0 15 30 45 60 75 90 Q Qm H Q, Q m , H f (o) C l a d H A Z SSY NP1, crack A, t= 310 s
Fig. 2.12: Variations of the constraint parameters Q, Qm and H along the crack front of Defect A of the NP1 cylinder at 310 seconds into the test, the from DNV post-test analysis.
2.5 SOME IMPORTANT OBSERVATIONS
Failure assessment based on the R6 and Swedish SKIFS methodsSimple engineering methods may be used either for best-estimate predictions or for failure avoidance assessments. Two organisations conducted failure avoidance assessments of the NESC-II tests:
1. BE performed R6 assessments using the approach adopted in the UK.
2. DNV performed assessments using the SACC analysis program to the Swedish SKIFS 1994:1 code [SKIFS, 1994].
Both assessments made use of stress and temperature predictions from best estimate uncracked body finite element analyses already performed by the participants as part of the post-test analysis campaign. They therefore used NESC-II specific material properties and transient definitions. The two assessments examined complementary aspects of these three areas. The key assumptions of the BE and DNV assessments are compared in Table 2.4. The DNV assessments are discussed below.
The assessment performed by DNV treated the cladding as present for the purpose of calculating stresses and modelling the defects, but took no account of cladding or HAZ toughness. A single defect model was used for each test, namely a buried defect for NP2 and a surface elliptic defect for NP1. The variables examined were the J-estimation scheme, the fracture toughness response, and the overall safety factor on toughness:
The crack driving force was estimated using simple elastic SIF‟s (referred to as “ASME”), and procedures broadly equivalent to the simple and inelastic R6 methods.
The fracture toughness response was modelled by the Standard Master curve at 50% failure probability, size corrected to 25 mm and 60 mm for NP1, and to 25 mm and 1373 mm for NP2. Obviously these curves differ somewhat from those used by BE. The ASME KIa curve was also used with the pre-test estimate of RTNDT. This combination is slightly more pessimistic than the KIc curve used by BE.
The standard ASME XI safety factors on fracture toughness were used, in addition to a safety factor of 1.0.
3 The NESC-III project
3.1 GENERAL ASPECTS
Defect tolerance of Dissimilar Metal Welds (DMW) is an important issue when assessing found defects and at planning of In-Service Inspection (ISI) of nuclear power plants components. Inspection difficulties, variability of material properties and residual stresses all combine to create problems for structural integrity assessment. In general, those welds are made of austenitic stainless steels or Ni-base alloys (e.g. Inconel 182), and typically occur at piping connections to reactor pressure vessel nozzles, main circulation circuits, steam generators and pressurizers. However, under specific conditions cracking may occur. One prominent corrosion mechanism affecting austenitic stainless steels and Ni-base alloys, which has been of significant economic concern to the industry, is Stress Corrosion Cracking (SCC). This damage mechanism results from the localized attack of the grain boundaries of a susceptible material under load in BWR- and PWR-environment. The grain boundary regions undergo attack and cracks are formed. The cracks typically propagate with little or no evidence of plastic deformation. Most nuclear power plants in Sweden have been in operation for a period of at least twenty years and cracking due to stress corrosion or fatigue cannot be excluded. Leakage and failure of the component are possible events over time. It is thus important to be able to accurately assess the safety margin against failure.
The NESC III-project has the main objectives to:
1) Quantify the accuracy of structural integrity assessment procedures for defect-containing dissimilar metal welds.
2) Participate in the design and evaluation of a unique large-scale test to determine the actual behaviour under load of a defect in a dissimilar metal weld of industrial scale.
3) Address critical issues including: inspection performance, laboratory-scale fracture testing on welds and potential benefits of advanced fracture modelling.
Within the NESC III/ADIMEW-project (Assessment of aged piping DIssimilar MEtal Weld integrity), a defect containing pipe component of industrial size composed of a 316L austenitic steel welded to an A508 ferritic steel was tested under four-point bending load at service temperature (300 ˚C). The ADIMEW-test was performed at EdF Les Renardieres, Fontainebleau, France, in mid-July 2003. The experiment provides a unique opportunity to increase the understanding of defect tolerance of dissimilar metal welds and validate simplified engineering fracture assessment methods.
In order to verify the load at initiation of crack extension, the experiment has been analysed with 3D, elastic-plastic, finite element calculations using commercial FE-codes. The critical defect size was also analysed using the R6-method implemented in the software SACC.
Details of the activities conducted within the NESC-III project are given in Refs [III-1]-[III-5].
3.2 CRACK GEOMETRY AND LOADING
The most important features of the crack configuration and test conditions of NESC-III are given below.
Mock-up geometry
The ADIMEW-test specimen consists of a bimetallic pipe, made of four pipe sections as shown in Figs. 3.1 to 3.3 below. The mock-up section has been extended on each side with pipe sections to a final pipe length of about 7 m. The extension pipes, made of carbon high strength steel, have the same diameter and
thickness as the mock-up section. The notch is located approximately 285 mm (offset) from the symmetry axis.
Fig. 3.1: Four-point bending assembly used by EdF at Les Renardieres in France.
Details of the weld geometry and dimensions of the pipe sections are shown in Figs. 3.3 and 3.4. The thickness of the pipe is 51 mm and its external diameter is 453 mm. The defect, a notch of 17 mm depth at the outer surface, see Fig. 3.4, was inserted by electro-erosion in the first buttering layer (309L) parallel to the fusion line and at a distance of about 1.5 mm from the ferritic material. The width of the notch is about 0.4 mm and the notch-tip radius is 0.2 mm.
The experiment showed ductile material behaviour without brittle fracture of the component. A stable crack extension of around 25 mm along the weld fusion line was obtained before the displacement controlled test was stopped.
Fig. 3.2: A schematic illustration of the ADIMEW-test.
Fig. 3.3: Mock up geometry of the ADIMEW-test.
3.3 MATERIAL CHARACTERISATION
The material data used in all FEM calculations are given in Table 3.1 – 3.3. The stress-strain curves used in the FEM analyses are plotted in Figs. 3.5 to 3.7.
Table 3.1: Material properties for the base material 316L used in the FEM analysis.
Temperature [ºC] E – modulus [GPa] ν [-] Yield Strength [MPa] [·10-6/C] 20 189 0.285 294 16.4 100 185 0.29 271 16.8 200 176 0.293 240 17.2 300 170.5 0.295 213 17.7 400 162 0.31 185 18.1 500 151 0.315 150 18.4 600 144 0.315 130 18.7
Table 3.2: Material properties for the base material A508 used in the FEM analysis.
Temperature [ºC] E – modulus [GPa] ν [-] Yield Strength [MPa] [·10-6/C] 20 207.2 0.285 513 11.22 100 202 0.2875 483 11.79 200 195 0.29 471 12.47 300 187.5 0.29 463 13.1 400 180 0.295 430 13.72 500 125 0.305 400 14.32 600 70 0.315 300 14.5
Table 3.3: Material properties the weld material 316L used in the FEM analysis.
Temperature [ºC] E – modulus [GPa] ν [-] Yield Strength [MPa] [·10-6/C] 20 189 16.4 416 16.4 100 185 16.8 392 16.8 200 176 17.2 362 17.2 300 170.5 17.7 333 17.7 400 162 18.1 306 18.1 500 151 18.4 272 18.4 600 144 18.7 252 18.7
Stress-strain curve - 316L at T = 300ºC 0 100 200 300 400 500 600 700 800 900 0 0.2 0.4 0.6 0.8 1 ε [-] σ [ M P a ] Calculation curve
Fig. 3.5: True stress-strain curve estimated from tensile test for 316L at T = 300ºC.
Stress-strain curve - A508 at T = 300ºC
0 100 200 300 400 500 600 700 800 900 0 0.1 0.2 0.3 0.4 0.5 0.6 ε [-] σ [ M P a ] Calculation curve
Fig. 3.6: True stress-strain curve estimated from tensile test for A508 at T = 300ºC.
Stress - strain curve - WM T = 300ºC
0 200 400 600 800 1000 1200 0 0.2 0.4 0.6 0.8 1 1.2 1.4 1.6 1.8 ε [-] σ [M Pa ] Calculation curve