National Survey on Justifi cation
of CT-examinations in Sweden
2009:03
Authors: Anja AlménWolfram Leitz Sven Richter
Title: National Survey on Justification of CT-examinations in Sweden Report number: 2009:03
Author/Authors: Anja Almén, Wolfram Leitz and Sven Richter Date: Februari 2009
Abstract
All examinations in diagnostic radiology shall be justified to avoid un-necessary irradiation of the patients. The objective of the study was to investigate the degree of justification for CT-examinations in Sweden. Referrals for all examinations performed during one day were retrospec-tively evaluated by a group of physicians. The study was designed and conducted by a project group lead by ass. prof. Håkan Jorulf. The aut-hors of this report have derived the results and conclusions on the basis of the data and are responsible for the content of this report.
The principle result was that approximately 20 % of all examinations were not justified. The degree of justification varied strongly with organ examined, moderately with prescriber affiliation and weakly with geo-graphical region. If unjustified examinations could be avoided a large dose reduction for the population would be achieved.
This study shows that there is a need for improvements and the autho-rity will continue to work with this issue.
Content
1. Summary...2
2. Introduction ...3
3. Data collected...4
3.1 Study design ...4
3.2 Relevance of the examinations in the study...6
4. Results ...8
4.1 Questionnaire...8
4.2 Justification ...8
4.2.1 Quality of the referral ...8
4.2.2 Prescribers from different organisations...9
4.2.3 Anatomical region examined ...10
4.2.4 Geographical distribution ...12
4.2.5 Age and gender of patients ...13
4.2.6 Alternative diagnostic methods...15
5. Discussion ...16
5.1 Questionnaire...16
5.2 Referral review...16
5.2.1 Method for assessing justification...16
5.2.2 Auditors’ speciality ...16
5.2.3 Prescriber’s organisation ...18
5.2.4 Anatomical region examined ...19
5.2.5 Geographical distribution ...19
5.2.6 Age and gender of patients ...20
5.2.7 Alternative diagnostic methods...20
6. Future prospects...22
7. References...23
8. Annex ...24
1. Summary
Even though justification is one of the basic principles in radiation protection the extent to which x-ray examinations are justified is hardly known. Thus the Swedish Radiation Protection Authority (SSI) launched a project con-cerning for investigating to which degree computed tomography (CT) ex-aminations were justified.
Study design
The degree of justification and the quality of referrals were evaluated for all CT-examinations performed on the 2006-03-22 in all x-ray departments in Sweden. A questionnaire was also sent to all x-ray departments, with ques-tions about equipment and routines concerning referrals and judgment of justification.
Main aims of the study
To assess the degree of justification CT–examinations in Sweden.
To get information about the causes for non-justified examinations.
To investigate how justification is affected by the geographical region,
examined organ, age and sex of the patient, quality of the referral and prescriber.
To assess the quality of referrals.
Important findings
The setup of the study was adequate although the inter-observer variance
was rather high.
Approximately 80 % of all CT–examinations were justified.
The number of justified examinations was higher for prescribers
affili-ated to hospitals than for prescribers from health care centres. The larg-est difference was for spine examinations (77 % and 29 %, respectively).
The quality of the referrals was generally high, somewhat poorer for
prescribers from healthcare centres (95 % respectively 87 % were satis-factory).
Justification was depending on the examined organ (between 51 and
98 %).
The Northern region had a lower degree of justification than the other
five regions (75 % vs. 80 %).
2. Introduction
Justification, optimization and dose limits are the three important corner-stones in radiation protection. According to the regulations of the Swedish Radiation Protection Authority (SSI)1 all medical exposures shall be justified and optimized (1). A medical exposure is justified when the benefit for the patient is larger than the expected harm, and when the effectiveness, advan-tages and risks for alternative methods with less dose or no dose at all to the patient is duly taken into consideration.
The assessment of justification is a complex task. For the individual patient many factors such as the radiation dose to the patient, the patient’s case his-tory, outcome of other investigations, and the radiological resources avail-able must be known and taken into consideration in the justifying process. A justified examination starts with an adequate referral and includes an opti-mized exposure and a correct diagnosis correspondent to the clinical request. According to regulations of the National Board for Health and Welfare all providers for health are obliged to ensure routines for the design and han-dling of referrals (2).
In 2006 SSI initiated a research project with the aim to gain information about the degree of justification for radiological procedures, National survey
on the use of computed tomography (CT) in Sweden, SSI project P 1539.06.
Computed tomography was chosen because these examinations are giving relatively high patient doses. This report will present results from the study. It will be discussed how further work to solve still open questions could be performed, with the same, a modified or a different approach compared to the present one.
Radiology in Sweden
Sweden has a population of 9.2 million inhabitants. Healthcare in Sweden is organised on the county level which are grouped in six healthcare regions, with populations between one and two millions each. In the year 2005 the total number of medical radiological examinations in the 140 departments was 5.4 million (3). The number of x-ray equipments is around 2000, 161 of which are computed tomography equipment in 95 of the departments. The collective effective dose to the population from radiological examina-tions was estimated as 5800 manSv in the year 2005 (3), to which CT-examinations are contributing with 55-60%. This is roughly the same figure as assessed in the year 1996 (4). The increased collective dose from CT-examinations, with a factor of two, was balanced by the decrease of that from conventional examinations with a factor of two.
1
3. Data collected
3.1 Study design
The study was composed of two parts. Part one was a questionnaire sent to the 95 x-ray departments in Sweden that were performing CT-examinations. Among the items in the questionnaire were questions about the CT equip-ment in the departequip-ment and whether there were docuequip-mented routines on how referrals and justification were dealt with.
Part two comprised the evaluation of referrals for all CT-examinations that were conducted in Sweden during one day (Wednesday, 22 March 2006). For that purpose copies of all referrals for these examinations were requested from all facilities using CT-equipment. The referrals contained data about the age and gender of the patient, and about the anatomical region to be ex-amined. Information was available on whether the CT-examination was the first radiological examination in the current investigation of the patient, or was a check on the progress of a disease or effect of treatment, or was a fur-ther step in an ongoing investigation. The county, the region, the organisa-tion and the level of hospital was given for both the prescriber and the unit performing the examination. Four different organisations were classified: university hospitals, county hospitals, small hospitals and healthcare centres. The referrals collected resulted in 2435 CT-examinations.
Eighteen experienced physicians, both clinicians and radiologists, were engaged as auditors for the evaluation of the quality of the referrals and of the justifica-tion of the examinajustifica-tions; the aim was to evaluate all examinajustifica-tions by two audi-tors, one clinician and one radiologist. Because of practical reasons this couldn’t be achieved completely: Out of the 2435 examinations 280 were evaluated by one auditor only, 2176 by two, 50 by three and 1 by four auditors, giving in total 4714 evaluations. The auditors were instructed to base their judgement on justi-fication on the European referral criteria (5), on national guidelines and health care programmes, and on their own experience.
The auditors had to evaluate the quality of the referral as answer to the question “can the appropriateness and the justification of the examination be assessed?” in a four-grade scale:
1. adequate referral, 2. relatively adequate, 3. not really adequate and 4. inadequate information.
The auditors evaluated justification as the answer to the question “is the
re-sult of the examination expected to be of importance for further management of the patient or for therapy or is giving reassurance for the diagnosis?” in a
four-grade scale: 1. justified,
2. most likely justified,
3. doubtful whether justified and 4. not justified.
The appropriateness of the CT examination assessed according to 11 alterna-tives:
1. CT is the correct initial radiological procedure 2. Control with CT is indicated
3. CT is indicated as a further investigation 4. MRT or US should have been chosen
5. Conventional x-rays or scintigraphy, including PET without CT should have been the first choice
6. A different method should be used for the control.
7. A different method should have been used for the continuing investiga-tion
8. Radiological investigation not justified at the time of referral 9. Control is not adequate or repeated examination
10. CT is not needed because investigation with other method(s) is sufficient 11. Can not judge whether choice of method is appropriate.
There are two possibilities for defining justification. One is to use the as-sessment of the appropriateness where the alternatives 1 through 3 are de-fined as justified (CT there is considered to be indicated) and alternatives 4 through 10 as not justified examinations (here another method than CT is preferred). The second is the direct assessment of justification by the audi-tors in a four-grade scale. In this report the first method is used. The reason for taking this approach is that here the assessment of justification is more coherent and closer to how justification is used in radiation protection. A comparison between the two methods will be carried out and commented.
3.2 Relevance of the examinations in the
study
For the outcome of the study to be generally valid for the conditions in Swe-den, the selected examinations being part of this study must be representa-tive for the praxis in Sweden during an adequate time interval. That applies to both the geographical distribution as the distribution of different types of examinations. The figures for this study can be compared to the results from a frequency study for the year 2005 (3). There the number for all radiologi-cal examinations during the year 2005 was assessed, differentiated according to type and location.
The number of examinations included in this study was 2435, performed during the selected day 22 March 2006. Assuming the production of CT examinations during one Saturday, Sunday or other public holiday is corre-sponding to 25 % of the production during one weekday will give a yearly production equivalent to 288 weekdays. Hence, the number of CT examina-tions during one weekday is the number for the whole year 2005 divided by 288. The result is presented in Table 1.
Table 1 Comparison between the numbers of examinations per working day included in this study and a survey carried out in 2005 for the six healthcare regions in Sweden.
This study Survey 2005 Difference(%)
Northern 250 240 4 Stockholm 540 497 8 South-eastern 282 250 11 Southern 426 413 3 Uppsala/Örebro 563 493 12 Western 374 371 1 Total 2435 2264 7
The numbers are not differing more than 12% for any region. Approximately 7% more examinations were included in this study compared with the survey of 2005.
The relative number of the various types of examinations included could also influence the outcome. For example if the study comprises an unrepresenta-tive number of examinations of a specific type that is almost always justi-fied, the study will show a too high frequency of justified examinations. Table 2 shows the relative numbers of examinations of various parts of the body compared to the survey for 2005 (3). The definition and grouping of the examinations were somewhat different in the two studies; therefore all
pelvis and abdomen examinations were put together into a new group “other”.
Table 2 Comparison between regions of the body examined in this study and the survey 2005, the numbers express the percentage relatively to all examinations in the respective study.
Skull and neck Brain Spine Thorax Extremities Multiregion Other
This study 9 % 42 % 3 % 11 % 2 % 11 % 21 %
Survey 2005 13 % 40 % 2 % 16 % 2 % 2 % 25 %
The agreement between the two studies is relatively good for the examina-tions of the brain, spine and extremities but poor for multiregion. This dis-agreement might be attributed to differences in the classification of examina-tions in the two studies.
As radiological protection for children is especially important a separate evaluation for children would be desirable. However, the number of exami-nations of children (0-15 years) was low, and it could also be expected that the types of examinations were different compared to adults. In table 3, the relative distribution of different types of paediatric examinations for this study and the 2005 survey is shown.
Table 3. Comparison between regions of the body examined for children (0-15 years), percentage relatively to all examinations in the respective study.
Skull and neck Brain Spine Thorax Extremities Multiregion Other
This study 23 % 39 % 4 % 12 % 7 % 9 % 7 %
Survey 2005 22 % 44 % 2 % 7 % 6 % 3 % 17 %
The distributions of examinations for the two studies were quite similar. Compared to the figures for adults there were differences, the largest for the skull and neck region where the figures for children were two times higher than those for adults. However, the total number of paediatric examinations in this study was only 58, thus evaluations of these data have large statistical uncertainties, and it will be difficult to do any specific evaluations for chil-dren.
4. Results
4.1 Questionnaire
Out of the 95 questionnaires 93 were returned. It was stated by
84% of the departments that they had documented procedures for
refer-ral handling.
36% of the departments that they had documented procedures for the
assessment of justification.
65% of the departments that assessment of justification was performed
for all patients and on medical grounds, and by the remaining depart-ments that justification was assessed for more than 50% of the referrals.
82% of the departments that the setting of priorities for when an
exami-nation is scheduled is always based on medical grounds, and for the re-maining departments for more than half of all examinations.
4.2 Justification
In the following chapters data for the level of justification together with a number of parameters are presented, such as the prescribers’ organisational and geographical residence, the anatomical region examined, the age of the patient, the quality of the referral, and the auditors’ speciality. As stated in chapter 2, last paragraph, the terms justification and justified (unless speci-fied differently) are relating to the assessment of the appropriateness of the examination by the auditors. Most of the findings will be expressed as num-bers of evaluations by the auditors rather than as numnum-bers of examinations.
4.2.1 Quality of the referral
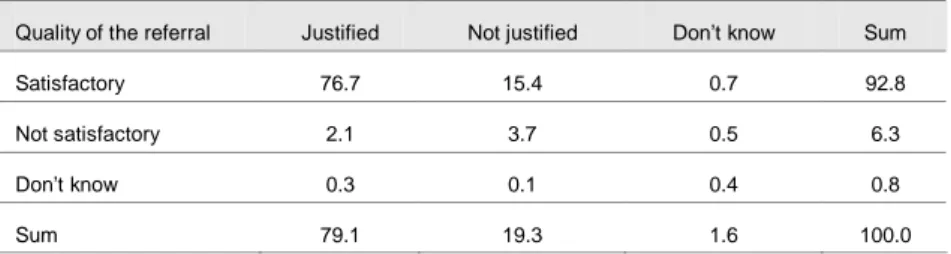
The level of adequate information in the referrals was assessed by the audi-tors in a four-grade scale, from adequate to inadequate. Here this four-grade scale was reduced to a two-grade scale, where “adequate” “and relatively adequate” was regarded as “satisfactory” and “not really” and “inadequate” as “not satisfactory”. Table 3 is showing to what extent the quality of the referrals was correlated to the assessment of justification.
Table 3 Quality of referral versus degree of justification (in % relative to the total number of evalua-tions).
Quality of the referral Justified Not justified Don’t know Sum
Satisfactory 76.7 15.4 0.7 92.8
Not satisfactory 2.1 3.7 0.5 6.3
Don’t know 0.3 0.1 0.4 0.8
Sum 79.1 19.3 1.6 100.0
Table 3 is showing that about 93 % of the referrals had adequate or relatively adequate information, i.e. were satisfactory. It is also indicating that 15.4 % of the referrals were for not justified examinations. Not satisfactory referrals are obviously not the major reason for the examinations to be assessed as not justified because of the 19.3 % evaluations that were found to be not justi-fied only 3.7 % had not satisfactory referrals.
Prescribers from each of the three categories of hospitals (university hospi-tals, county hospitals and small hospitals) had approximately the same level of quality of the referrals; 94-95 % were judged as “satisfactory” whereas this figure was reduced to 87 % for prescribers from healthcare centres.
4.2.2 Prescribers from different organisations
Prescribers from the four different categories of organisations had roughly the same number of referrals each. Figure 1 shows the degree of justification for the four different categories. The three from hospitals are showing simi-lar values (82 – 84 % justified) whereas prescribers from healthcare centres have a significantly lower value (64 % justified).
0 10 20 30 40 50 60 70 80 90 100
University hospital County hospital Small hospital Health care centre
S c o re [ % ]
Justified Not justified No info
4.2.3 Anatomical region examined
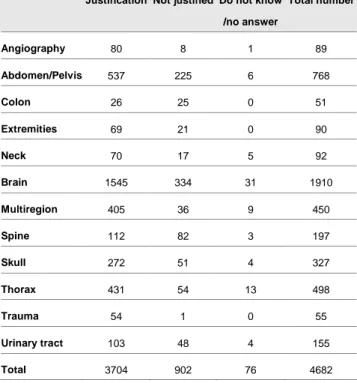
In this study the examinations were originally characterised as 38 different types. These were later regrouped into 12 broader defined anatomical re-gions. The assessment of justification for these 12 anatomical regions from all auditors is given in table 4 in absolute numbers and in table 5 in relative numbers.
Table 4 Justification for the 12 anatomical regions given as numbers of evaluations
Justification Not justified Do not know /no answer Total number Angiography 80 8 1 89 Abdomen/Pelvis 537 225 6 768 Colon 26 25 0 51 Extremities 69 21 0 90 Neck 70 17 5 92 Brain 1545 334 31 1910 Multiregion 405 36 9 450 Spine 112 82 3 197 Skull 272 51 4 327 Thorax 431 54 13 498 Trauma 54 1 0 55 Urinary tract 103 48 4 155 Total 3704 902 76 4682
Table 5 Justification for the 12 anatomical regions given as percentage of the evaluations for the respective region
Degree of justication
Justified Not justified Do not know/ no answer Angiography 90 9 1 Abdomen/Pelvis 70 29 1 Colon 51 49 0 Extremities 77 23 0 Neck 76 18 5 Brain 81 17 2 Multiregion 90 8 2 Spine 57 42 2 Skull 83 16 1 Thorax 87 11 3 Trauma 98 2 0 Urinary tract 66 31 3 Total 79 19 2
The overall degree of justification was lower for prescribers from healthcare centres. For further analysis justification was derived for different anatomi-cal regions, for prescribers from hospital and from healthcare centres. Only the five most frequent anatomical regions were taken into consideration – the remainders are of such low frequency that no reliable results could be ex-pected.
Table 6 is showing the figures for these five anatomical regions, for pre-scribers from hospitals and from healthcare centres.
Table 6: Justification (%) for five anatomical regions, prescribers from hospitals (A) and health care centres
(B)
Jusitified Not justified No answer
Abdomen/ Pelvis A 73 27 1 B 58 41 1 Brain A 83 15 2 B 72 27 1 Spine A 77 23 1 B 29 68 2 Skull A 86 12 2 B 73 27 0 Thorax A 88 10 2 B 78 16 6
4.2.4 Geographical distribution
Table 7 shows the degree of justification in percentage for the various healthcare regions. Five of the regions are showing quite similar results whereas the Northern region has slightly lower values.
Table 7 Judgement of justification (in %) in the six healthcare regions in relative values
Justification Southern South-eastern Western Stockholm Uppsala/ Örebro Northern
Justified 81 79 79 79 79 75
Not justified 17 20 20 18 20 23
4.2.5 Age and gender of patients
The distribution of evaluations in ten-years age-intervals is shown in figure 2, for males and females from 0 to 100 years.
0 100 200 300 400 500 600 0-10 10-20 20-30 30-40 40-50 50-60 60-70 70-80 80-90 90-100
Age group [year]
N u m b e r Males Females
Figure 2 Number of evaluations for males and females in different age groups.
Figure 3 shows the degree of justification (expressed as percentage of the number of evaluations judged as justified) in ten-year age-intervals for both males and females for all examinations, and figure 4 shows data for the 3 most frequent examination groups. The youngest and oldest patients’ age-groups were summed to cover 20 years because the number of examinations was very low for these patients.
0 10 20 30 40 50 60 70 80 90 0-20 20-30 30-40 40-50 50-60 60-70 70-80 80-100
Age group [years]
J u s ti fi c a ti o n [ % ]
Male and female
Figure 3 Justification for different age groups (all examinations)
Figure 4 shows the degree of justification as a function of age for the three most frequent examinations. The figure indicates that justification increases with increasing age, at least to the age of 70.
0 10 20 30 40 50 60 70 80 90 100 0-20 20-30 30-40 40-50 50-60 60-70 70-80 80-100
Age group [years]
J u s ti fi c a ti o n [ % ]
Brain Abd. Pelv. Thorax
4.2.6 Alternative diagnostic methods
Of special interest are those examinations for which the auditors suggested alternative methods not using ionising radiation, i.e. magnetic resonance imaging (MR) or ultra sound (US). For 384 evaluations (8 % of all) the audi-tors made this assessment. Table 8 shows more detailed results for the six healthcare regions and for the three examination for which this judgement was given most frequently.
Table 8 CT-examinations that should have been performed with MR or US according to the auditors’ judgement, for the six healthcare regions and three examination types. The total numbers of evalua-tions (N) for the examination in the respective healthcare region are given together with the absolute
(NMR+US) and relative values for those that should have been performed with MR or US (RNMR+US).
Spine Brain Abdomen
N NMR+US RNMR+US % N NMR+USRNMR+US % N NMR+US RNMR+US %
Southern 23 2 9 337 27 8 122 27 22 South Eastern 28 7 25 215 9 4 102 17 17 Western 54 33 61 280 19 7 98 5 5 Stockholm 14 1 7 414 12 3 186 32 17 Uppsala/ Örebro 43 1 2 444 19 4 192 35 18 Northern 35 17 49 220 21 10 68 8 12 Total 197 61 31 1910 107 6 768 124 16
N = total number of evaluations in the respective healthcare region for the indicated anatomical region
NMR+US = Number of evaluations for examinations that according to the auditors should have been performed
with MR or US
RNMR+US = Relative number of evaluations for examinations that according to the auditors should have been
5. Discussion
The main aim of the study was to investigate to which degree
CT-examinations were justified and to find out reasons why unjustified examina-tions are performed. This analysis will focus on the identification of these factors and will try to find measures for improvements. The findings in the previous chapter will be analysed and, when feasible. Suggestions for ac-tions will be given.
5.1 Questionnaire
For a number of facilities, documented procedures for referral handling and for assessment of justification were missing. A prerequisite for the assess-ment of justification is an adequate referral. A written guideline on what the referral must contain is needed in order to ensure that everyone involved knows what is required. Written guidelines are also needed for justification assessments to be consistent, independent of who is making the assessment. Without documented routines it is difficult to systematically improve the referral handling and justification assessment.
5.2 Referral review
5.2.1 Method for assessing justification
As pointed out there were two options in this study to assess “justification”. In this report the assessment of the appropriateness of the examination was chosen. The differences between the two choices are small. A comparison between these two methods is shown in Table 9. The four-grade scale for the direct assessment of justification was reduced to a two-grade scale (yes or no) where it was assumed that “justified” and “probably justified” is
justi-fied, and “justified with doubt” and “not justified” is not justified. The two
methods are giving the same results for 94 % of all evaluations.
Table 9 Justification according to assessment of appropriateness and to a direct assessment, respec-tively, in % of the total number of evaluations.
Direct assessment Appropriateness
Justified and probably justified
Justified with doubt or not justified
Cannot be judged or data missing
Justified 74.0 5.0 0.2
Not justified 0.0 19.1 0.1
Cannot be judged or data missing
0.3 0.8 0.6
5.2.2 Auditors’ speciality
This study showed a relatively high inter-observer variance that varied with the examined anatomical region. To a large extent these differences in
judgements could be attributed to the speciality of the auditors. Two catego-ries of auditors were involved in this study: Physicians working in clinics referring patients for CT examinations (here called “clinicians”) and radiolo-gists. Preferably one radiologist and one clinician should evaluate each ex-amination. This was achieved for all examination except for extremity, spine and trauma, which to 95 % were evaluated by radiologists only because for these examinations there were no relevant clinicians in the group of auditors.
Table 10 shows the justification evaluated by clinicians and radiologists for those examinations where clinicians and radiologists carried out approxi-mately the same number of evaluations each. For some examinations the differences regarding assessment of justification between clinicians and ra-diologists are remarkably high. The percentage of justified examinations of the abdomen/pelvis, colon, and urinary tract are lower when assessed by clinicians and the opposite holds for neck, skull and thorax. It cannot be determined whether these findings are generally valid in Sweden because only a small number of auditors were engaged. But, some possible explana-tions can be given which could be checked in a follow-up study.
Table 10: Judgement of justification by (a) clinicians and (b) radiologists. The figures are given as percentage
of the total number of evaluation by the respective group of observers for the examination type in question
(a) Clinicians
Justified Not justified No answer
Angiography 93 5 2 Abdomen/pelvis 59 40 1 Colon 28 72 0 Neck 86 7 7 Brain 80 18 1 Multiregion 90 8 3 Skull 91 7 2 Thorax 91 7 1 Urinary tract 38 59 3
(b) Radiologists
Justified Not justified No answer
Angiography 88 13 0 Abdomen/pelvis 80 19 1 Colon 73 27 0 Neck 68 26 6 Brain 81 17 2 Multiregion 90 8 1 Skull 80 19 1 Thorax 82 14 4 Urinary tract 93 5 2
Radiologists and clinicians have a different role in the management of pa-tients which might lead to a different view on what is the best radiological procedure for a given patient history. It might be that clinicians are not fa-miliar with the newest examination methods and their possibilities, or that the radiologist is not aware of all details in the investigation schemes for certain diseases or suspects for disease. A closer cooperation between clini-cians and radiologists would improve the mutual understanding.
All auditors, both clinicians and radiologists are certainly influenced in their judgement by how the situation is at their own clinics. For instance it is likely that new radiological methods will not be introduced simultaneously in the whole country so there will be different practices in different clinics. That is one of the reasons why the study cannot unconditionally give the true answer to the questions about justification. But that does not mean that the study is not conclusive: when doubts on justification for a certain radiologi-cal procedure are brought forward from either side this is reason enough for a critical review.
5.2.3 Prescriber’s organisation
Examinations referred to by prescribers from the three types of hospitals had all similar degree of justification, between 82 and 84 %. However, the corre-sponding figure for prescribers from healthcare centres was only 64 %, and it was shown that for all types of examinations the degree of justification was lower for these prescribers. The quality of request forms showed a similar pattern: all the three types of hospitals provided 94-95 % “sufficient” refer-rals whereas prescribers from healthcare centres achieved 87 %.
It is to be expected that different categories of prescribers will have different categories of patients, and that might cause the differences observed for jus-tification. A possible reason could be that they have on average more
pa-tients with diffuse symptoms. The first examination in the current investiga-tion of the patient is more likely to fail in justificainvestiga-tion compared to a follow-up check which often is a part of a well elaborated program to be followed for certain patients, whereas for the first hand examination the knowledge about the patient’s possible disease might be more vague. The relative num-ber of such first hand examinations for prescrinum-bers from healthcare centres is only 10 % higher than for prescribers from hospitals, but the number of un-justified examinations is, relatively, twice for prescribers from healthcare centres.
Another possible explanation for the findings could be that there is less con-tact between those prescribers and the radiological departments indicating that these prescribers are not fully familiar with all the radiological options available. The lower quality of referrals could also contribute to the lower degree of justification for prescribers from healthcare centres. As shown before, the total of “insufficient” referrals could theoretically cause at most 3.7 % of all examinations to be not justified; for examinations with referrals from healthcare centres this figure is 8 %. The quality of the referral is im-portant, but poor quality is not the main reason examinations to be unjusti-fied.
Only those referrals that lead to a CT-examination were part of this study. Referrals for CT-examinations that were not performed were excluded. It would be of value to investigate also these referrals which could give addi-tional information on the quality of referrals and on how justification is as-sessed in clinical practice.
5.2.4 Anatomical region examined
As could be expected the degree of justification was varying with the type of examination, between 50 and 98 %. Colon, spine and urinary tract were at the low end of justification. Common for these three examinations is that they belonged in the past to rather frequent conventional x-ray examinations, and that there seem to be large differences about which modality is to be preferred, both among the prescribers and the auditors.
For example spine examinations referred to by prescribers from healthcare centres had a degree of justification with 50 % units lower than those from other prescribers. Similar differences in the degree of justification can be seen between radiologists and clinicians for examinations of the colon and urinary tract.
5.2.5 Geographical distribution
Differences in the level of justification in different parts of the country were obviously small. The Northern region was the only region with slightly lower figures. As seen in table 11 this was not because of a larger
contribu-tion of referrals from healthcare centres which have been shown to have less degree of justification. In fact, the Northern region had the lowest percentage of prescribers from health care centres, only half of that for the Stockholm region.
The reason for the lower figures for justification in the Northern region needs further evaluation. A possible explanation might be that this region is sparsely populated, often with long distances to the nearest hospital. Exami-nations might be prescribed and performed on weaker indications when the patient is anyhow present at the hospital.
Table 11 Percentage of examinations referred to by prescribers from healthcare centres for the six healthcare regions
Region Southern
South-eastern
Western Stockholm Uppsala/ Örebro
Northern
Percentage of referrals 15 % 20 % 22 % 28 % 19 % 14 %
5.2.6 Age and gender of patients
As could be expected the frequency of examinations was varying and be-comes more common with increasing age. It has been shown that 50 % of all examinations are performed on patients of age 65 years and older. The dis-tribution of the examination amongst the two genders is rather even: 52 % females and 48 % males.
The degree of justification is lower for younger patients. The reason for this is not quite clear. It could be that when evaluating the examinations the audi-tors had taken into special consideration the increased radiation risk for young patients. This might have resulted in more rigorous requirements for the justification of the procedures, possibly more strict than the judgement of the prescriber and the radiologist in charge for the actual patient.
5.2.7 Alternative diagnostic methods
In 8 % of all evaluations the auditors concluded that MR or US should be the preferred examination. Out of all examinations of the spine 30 % should have been replaced with MR or US according to the auditors. There were large variations of this figure between the regions, from 2 % (Uppsala re-gion) to 61 % (Western rere-gion). Likewise remarkable is the low number of spine examinations performed in Stockholm (14) compared to the Northern and Western regions (35 and 54, respectively). For brain examinations the differences between the regions are less pronounced, between 3 and 10 % with an average of 6 %. For examination of the abdomen the corresponding figures are 5 and 22 % with an average of 16 %.
These findings indicate that there were large differences in what modality was preferred for specific clinical requests. These differences were mostly
pronounced for examinations of the spine. It would be worth while to inves-tigate the reasons for these differences, which might be: different access to examination modalities in question, tradition, good or poor routines for as-sessment of justification, availability/lack of certain expertise.
6. Future prospects
The study has shown that there is a need for improvements concerning justi-fication of CT-examinations. This could be achieved by
Education and training, both the prescribers and the radiologists in matters
concerning justification.
Information to the prescribers, especially those from healthcare centres,
about requirements and criteria for referrals.
Promotion of the use of referral criteria e.g. RP 118 (5) for both prescribers
and radiologists.
Improved communication between radiologists and prescribers. QA documents on the content and the format of good referrals. QA documents on the justification process.
7. References
1. The Swedish Radiation Protection Authority. Regulations about General Obligations for medical and dental activities with ionising radiation. SSI FS 2000:1 (2000), (in Swedish).
2. The National Board of Health and Welfare. Regulations about the re-sponsibilities for referrals. SOS FS 2004:11 (2004), (in Swedish). 3. Almén A, Richter S and Leitz W. The number of radiological
examina-tions in Sweden 2005. SSI report 2008:03, (2008) (in Swedish).
4. UNSCEAR. Sources and effects of ionizing radiation. New York, United Nations (2000).
5. European Communities. Referral guidelines for imaging. Radiation pro-tection 118. Luxembourg: Office for Official Publications of the Euro-pean Communities, (2001).
8. Annex
The study was designed and conducted by a project group consisting of
Håkan Jorulf, Ass. Prof. in radiology, Uppsala
Bengt Isberg, MD, specialist in radiology, healthcare centre Odenplan
Stockholm
Ulla Svahn, research assistant, healthcare centre Hötorget, Stockholm.
The following physicians acted as auditors and evaluated the referrals:
Staffan Bremmer, MD, specialist in radiology, x-ray department,
Karolin-ska University Hospital, Solna
Göran Eklundh, MD, specialist in emergency care, University Hospital
Lund
Kaj Ericson, Professor in neuroradiology, Karolinska University Hospital
Solna
Staffan Eriksson, Ass. Prof.. in surgery, Central Hospital Västerås Jan Fagius, Ass. Prof. in neurology, Uppsala
Hans-Göran Hårdemark, MD, specialist in neurology, Academic Hospital
Uppsala
Stig Holtås, Prof. in neuroradiology. University Hospital Lund Bengt Isberg, MD, specialist in radiology healthcare centre Odenplan
Stockholm
Åse Johnsson, MD, specialist in radiology, University Hospital Göteborg Håkan Jorulf, Ass. Prof. in radiology. Uppsala
Anne-Charlotte Kinn, Ass. Prof. in urology. Stockholm
Evaldas Laurencikas, MD, specialist in radiology, Karolinska University
Hospital, Solna
Torbjörn Lindström – Ahl, MD, specialist in radiology, Helsingborg
Hos-pital
Ulrika Stierner, MD, specialist in oncology, Sahlgrenska University
Hospi-tal Göteborg
Johan Träff, MD, specialist in neurologi, medical care centre, Farsta Stefan Lundqvist, MD, specialist in radiology, Norrlands University
Hospi-tal Umeå
Anders Magnusson, Prof. in radiology, Academic hospital, Uppsala Åsa Rosenborg, MD, specialist in radiology, Central hospital, Kalmar.