Rapport 24 - 2012
Proficiency Testing
Drinking Water Microbiology
2012:2, September
by Tommy Šlapokas and Kirsi MykkänenProficiency Testing
Drinking Water
Microbiology
2012:2, September
Tommy Šlapokas1
Kirsi Mykkänen1,2
1 Compilation and writing 2 Laboratory work
1st edition
National Food Agency Box 622
SE-751 26 UPPSALA SWEDEN
Introduction
All analytical activities require the execution of work of a high standard that is accurately documented. For this purpose most laboratories carry out some form of internal quality assurance, but their analytical work also has to be evaluated by an independent party. Such external quality control of laboratory competence is commonly required by accreditation bodies and can be done by taking part in proficiency testing (PT).
In a proficiency test, identical test material is examined by a number of laboratories. The laboratories must follow instructions, perform analyses on the samples provided and report their results to the organiser. They are also expected to use their routine methods for their analyses. The organiser subsequently evaluates the results using statistical tools and finally compiles them in a report.
Benefits of the National Food Agency’s proficiency tests
1. Laboratories are externally evaluated with respect to their analytical competence, including usage of methods, documentation and orderliness. 2. Accreditation bodies are provided with a tool for inspections regarding new
accreditation or maintenance of accreditation.
3. Laboratories and the organiser improve their knowledge of the efficiency of analytical methods used routinely by participating laboratories with respect to various types of organisms.
Edition
Version 1 (17 December 2012)
Editor in chief
Annika Rimland, Head of the Science Department, National Food Agency
Responsible for the scheme
Contents
Introduction ... 2
Design ... 5
- Analyses and mixtures ... 5
- Quality control of the mixtures ... 6
Laboratory results ... 8
- General information regarding the results ... 8
- Mixture A ... 9
- Mixture B ... 12
- Mixture C ... 15
Outcome of the methods ... 19
- Method information by use of internet ... 19
- General information regarding methods outcome ... 19
- Results based on differences in use of methods ... 20
The outcome of deviating results – assessment ... 25
Figure 2 — Box plot ... 27
References ... 31
Annex A — All analytical results ... 32
Annex B— Z-values to use in the follow-up process ... 36
Design
Analyses and mixtures
This proficiency test was performed in September 2012, and is registered as no. 2639/2012 at the National Food Agency, Uppsala. Samples were sent to 114 laboratories, 36 of which were in Sweden, 58 in other Nordic countries and 20 in other countries. Eight laboratories did not report results.
Assessed parameters
Coliform bacteria and Escherichia coli with membrane filtration method (MF) Coliform bacteria and Escherichia coli with rapid kit methods using most
probable numbers (MPN)
Intestinal enterococci with MF
Pseudomonas aeruginosa with MF
Culturable microorganisms (total count) after incubation for 3 days at 22±2 °C Culturable microorganisms (total count) after incubation for 2 days at 36±2 °C Not assessed parameters
For the analyses using membrane filtration, the number of suspected colonies obtained on the primary culture plates could be reported by the participants, i.e. before the confirmation steps. However, these results are used as information for interpretation and discussion of analyses outcomes only.
The proficiency test comprised three simulated water samples. Each laboratory was assigned to perform the analyses according to the methods routinely used on drinking water samples. The test material is first and foremost adjusted to the EN ISO methods for analyses of drinking water, stated in the drinking water directive of the European Union (1). Accepted alternative methods in EU are also possible to use, as well as other similar methods.
Three freeze-dried test materials were produced with different microorganism mixtures. The material was manufactured and freeze-dried in portions of 0.5 ml in small vials, according to the description by Peterz and Steneryd (2). Each laboratory received one vial of each mixture. The simulated water samples were prepared by dissolving the content of the vials in 800 ml of sterile diluent. The composition of each mixture is listed in Table 1.
Abbreviations of the most commonly used media names
LES: m-Endo Agar LES
LTTC: m-Lactose TTC Agar with Tergitol (EN-ISO 9308-:2000)
m-FC m-FC Agar
m-Ent m-Enterococcus Agar (Slanetz & Barley)
PACN Pseudomonas Agar base + Cetrimide and Nalidixic acid YeA Yeast extract Agar (EN ISO 6222:1999)
Table 1 Microbial mixtures 1
Mixture Microorganisms Strain no. No. of cfu/100 ml2
A Enterobacter cloacae SLV-451 300 Enterococcus durans SLV-078 620 Pseudomonas aeruginosa SLV-453 130 Stenotrophomonas maltophilia SLV-041 39 * B Cronobacter sakazakii SLV-419 27 Escherichia coli SLV-082 32 Enterococcus hirae SLV-536 61 Staphylococcus saprophyticus SLV-013 <1 * Staphylococcus capitis SLV-463 84 * C Klebsiella oxytoca SLV-553 610 Escherichia coli SLV-295 250 Enterococcus faecium SLV-459 100 Pseudomonas aeruginosa SLV-455 47 Pseudomonas fluorescens SLV-535 29 *
1 The links between the mixtures and the randomised sample numbers are shown in Annex A
2 Results based on duplicate analyses of 10 vials per mixture, performed at the National Food Agency (Table 2); LES was used for E. coli, E. cloacae and K. oxytoca; m-FC for C. sakazakii; m-Ent for E. durans, E. hirae and E. faecium; PACN for P. aeruginosa; YeA for S. maltophilia,
S. saprophyticus, S. capitis and P. fluorescens – cfu = colony forming units
* cfu per ml
Quality control of the mixtures
It is essential to have a homogeneous mixture and a uniform volume in all vials in order to allow comparison of all freeze-dried samples derived from one mixture. The volume was checked in at least 9 vials of each mixture and the biggest differences between vials were 2, 5 and 3 mg for mixture A, B and C, respectively. The highest accepted volume variation is 15 mg (3%). Table 2 presents the coefficients of variation (CV) of the results from duplicate analyses of 10 vials from each mixture. The results relate to the unit by volume at which the colonies were counted. The highest accepted CV normally is 25%. For very low colony counts, like for the analysis of culturable microorganisms at 22˚C in mixture B, a higher CV is accepted. For more about the calculations, see the scheme protocol (3)
Table 2 Coefficients of variation (%; square root transformed results 1) for various microbial groups, in analyses performed in connection to the proficiency test
Analysis Mixture
A B C
Suspected coliform bacteria (MF) 2 5 a 4 b 5 a
Suspected thermotolerant colif. bact. (MF) 3 7 a 7 8 a
Intestinal enterococci (MF) 4 6 a 4 3
Pseudomonas aeruginosa (MF) 5 10 a – 8
Culturable microorg., 3d 22 °C (pour-plate) 6 4 61 8
Culturable microorg., 2d 37 °C (pour-plate) 6 4 6 8 1 n=10 mean values á 2 analyses of 100 ml for MF and 1 ml for pour-plate, if other is not stated; mixtures A,
B and C analysed 15, 14 and 12 weeks ahead of the proficiency test, respectively
2 m-Endo Agar LES according to SS 028167 [a preliminary analysis of concentrations was also done on Lactose TTC Agar with Tergitol according to SS-EN ISO 9308-1:2000]
3 m-FC Agar, 44 °C according to SS 028167 [a preliminary analysis of concentrations was also done on Lactose TTC Agar with Tergitol according to SS-EN ISO 9308-1:2000]
4 m-Enterococcus Agar according to SS-EN ISO 7899-2:2000
5 Pseudomonas Agar base Cetrimide Nalidixic acid Agar according to SS-EN ISO 16266:2008 6 Yeast extract Agar (yeast extract agar with tryptone) according to SS-EN ISO 6222:1999 a Results for 10 ml
b Only for E. coli. C. sakazakii was difficult to enumerate on LES during our control.
Laboratory results
General information regarding the results
The histograms (Figure 1) show the actual distribution of the results. False positives are not presented in histograms but are compiled in Table 3 together with the other results with annotations. All reported laboratory results are listed in
Annex A. Z-values for the all evaluated results are given in Annex B and pictures
of colony appearance on various media are presented in Annex C.
Most histograms have ―tails‖ in either or both directions, due to values that do not belong to a normal distribution. Calculations are performed after square root transformations of the results which give better normal distributions and therefore decrease the significance of the ―tails‖. Very deviating values are present in most analyses and are identified as outliers (black bars) with the aid of Grubbs’ test according to a modification by Kelly (4). A level of 1% is used as risk to incorrectly assess a result as being an outlier. Although the method is objective, it is a prerequisite that the results are normally distributed in order to obtain correct outliers. In special situations, e.g. when many zero results are reported and in some borderline cases, a few subjective adjustments are made in order to set the right limits based on the knowledge of the mixture’s contents.
False negative results are presented with white bars in the histograms. False results and outliers are not included in the calculations. Calculations are more elaborately described in the scheme protocol (3).
The coefficient of variation (CV) is used to measure the dispersion of the laboratory results. If the dispersion is <10% it is regarded as very small, 10-20% as small, 20-30% as medium, 30-40% as large and >40% as very large.
Table 3 Number of analytical results with annotation in evaluated analyses
Classification of results Number of results1 No. of
A B C Total laboratories
No. of evaluated results 617 616 617 1850 106 a
False positives 2 4 3 9 4
False negatives 6 5 7 18 14
Low outliers 9 4 5 18 13
High outliers 9 12 7 28 17
No. of results with annotation 26 25 22 73 36 b
1 Results from the analyses not assessed are not included a Number of laboratories that reported analytical results
Mixture A
The composition of mixture A is presented in Table 1. The microorganisms detected for each analysis are listed in Table 4, as well as the results average, their dispersion (CV) and the percentages of false results and outliers. The dispersion was very small or small for all parameters.
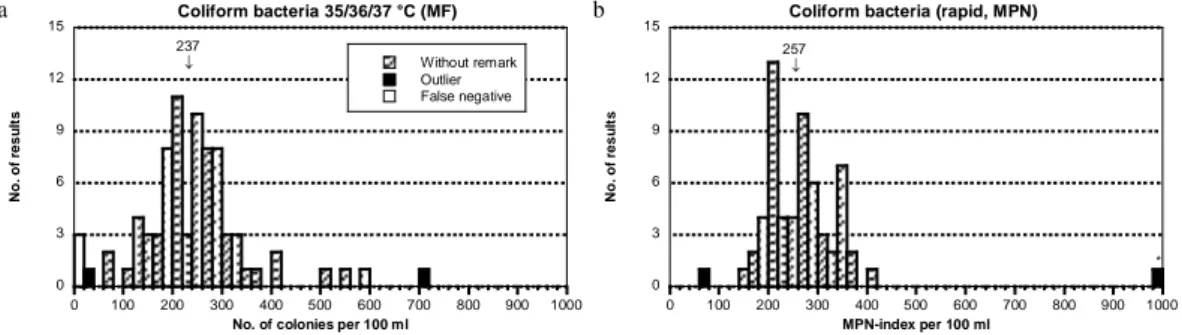
Coliform bacteria MF and rapid methods
For the analysis of coliform bacteria, E. cloacae formed colonies with the typical metal sheen on LES. The plate reading was also relatively easy on LTTC, where the strain formed large yellow colonies surrounded by a mixed
Table 4 Outcome of analyses for mixture A; F+ and F- are % of false positive and false negative results, respectively. Outl < and Outl > are % of low and high outliers, respectively. Shaded analyses are not numerically assessed and the median is stated instead of mean.
Analysis Organisms cfu/
vol1 CV 2 (%) F+ F- Outl < Outl >
Susp. coliform bacteria (MF) E. cloacae 245
Coliform bacteria (MF) E. cloacae 237 19 - 4 1 1 Susp. thermotol. colif. bact. (MF) E. cloacae 0
E. coli (MF) [E. cloacae] 0 - 1 - - -
Coliform bact. (rapid method) E. cloacae 257 11 - 0 2 2
E. coli (rapid method) — 0 - 2 - - -
Susp. intest. enterococci (MF) E. durans 530
Intest. enterococci (MF) E. durans 566 9 - 3 9 0 Susp. P. aeruginosa (MF) P. aeruginosa 75
P. aeruginosa (MF) P. aeruginosa 67 20 - 2 0 8 Culturable microorganisms
(total count) 22±2 °C, 3 days
S. maltophilia E. durans E. cloacae (P. aeruginosa) 38 11 - 0 0 1 Culturable microorganisms (total count) 36±2 °C, 2 days
S. maltophilia E. durans E. cloacae (P. aeruginosa)
38 9 - 0 0 1
1 "colony forming units" per unit of volume – 1 ml for total count microorg., otherwise 100 ml 2 "Coefficient of Variation" – calculated from square root transformed results (see Annex A) - numerical value impossible to obtain
— organism absent or numerical value has not been calculated ( ) the organism contributes with very few colonies
[ ] the organism is false positive on the primary growth medeium
flora, even if the yellow colour under the colonies was impossible to distinguish as all the medium became yellow.
- E. cloacae is a coliform bacterium producing β-galactosidase that is detected with rapid methods based on this enzymatic activity.
Suspected thermotolerant coliform bacteria (MF)
- Suspected thermotolerant coliform bacteria were reported by 15 out of 43 laboratories performing the analysis. E. cloacae formed small blue colonies on m-FC but the strain did not grow at all on LTTC at 44°C.
E. coli MF and rapid methods
- There was no E. coli in mixture A. One false positive result was reported for each method.
Figure 1a-b Mixture A, Histogram of all analytical results. False negatives are presented as
white bars. Outliers, false negatives excluded, are represented by black bars. The x-axis scale is not adjusted to very high deviating results. They are marked with an asterisk. The mean value of the analysis is stated and indicated by an arrow above the bars. Calculations have been made from square root transformed results, outliers and false negatives excluded.
Intestinal enterococci
- The target organism for this analysis was E. durans. Results had revealed that the strain could grow poorly on some batches of membrane filters and is therefore a good ―indicator‖ of filter-related problem with enterococci. Such observations could give an explanation for the 9 low outliers reported. We have noticed that filter batches from Pall Life Science (Gelman) can lead to very low results.
Pseudomonas aeruginosa
- The strain of P. aeruginosa included in the mixture formed clearly blue-green colonies on PACN. Hence, no confirmation step was necessary if the analysis was done according to the standard method describing the use of this medium. However, on this medium, also some white colonies of E. cloacae grew that could cause misinterpretation, especially as they turn up green during the second
0 3 6 9 12 15 0 100 200 300 400 500 600 700 800 900 1000 Coliform bacteria 35/36/37 °C (MF) Without remark Outlier False negative N o . o f re s u lt s
No. of colonies per 100 ml
237 0 3 6 9 12 15 0 100 200 300 400 500 600 700 800 900 1000
Coliform bacteria (rapid, MPN)
N o . o f re s u lt s MPN-index per 100 ml 257 * a b
day of incubation. These colonies might be the reason of the 5 high outliers reported. However, the ―white‖ colonies do not fluoresce under UV exposure.
Figure 1c-d Mixture A, see figure 1a-b for explanation
Culturable microorganisms 22 °C, 3 days and 36 °C, 2 days
- All four strains present in mixture A formed colonies for these analyses in relation to their concentrations. S. maltophilia was the most abundant in the mixture.
Figure 1e-f Mixture A, see figure 1a-b for explanations
0 3 6 9 12 15 0 100 200 300 400 500 600 700 800 900 1000 Intestinal enterococci (MF) N o . o f re s u lt s
No. of colonies per 100 ml
566 0 3 6 9 12 15 0 20 40 60 80 100 120 140 160 180 200 Pseudomonas aeruginosa (MF) N o . o f re s u lt s
No. of colonies per 100 ml
67 * 0 4 8 12 16 20 0 10 20 30 40 50 60 70 80 90 100
Total plate count 22±2 °C, 3 days
N o . o f re s u lt s
No. of colonies per ml
* 38 0 4 8 12 16 20 0 10 20 30 40 50 60 70 80 90 100
Total plate count 36±2 °C, 2 days
N o . o f re s u lt s
No. of colonies per ml
* 38
c d
Mixture B
The composition of mixture B is presented in Table 1. The microorganisms detected for each analysis are listed in Table 5, as well as the results average, their dispersion (CV) and the percentages of false results and outliers. The distribution of the results was very small or small for most analyses except for culturable microorganisms at 22 °C. For E. coli (MF) the distribution was medium.
Table 5 Outcome of each analysis for mixture B; see Table 4 for explanations.
Analysis Organisms cfu/
vol1 CV 2 (%) F+ F- Outl < Outl >
Susp. coliform bacteria (MF) E. coli
C. sakazakii
52
Coliform bacteria (MF) E. coli C. sakazakii
55 16 - 1 1 3 Susp. thermotol. colif. bact. (MF) E. coli
C. sakazakii
35
E. coli (MF) E. coli
[C. sakazakii]
30 21 - 1 0 2 Coliform bact. (rapid method) E. coli
C. sakazakii
65 10 - 0 2 2
E. coli (rapid method) E. coli 36 11 - 2 0 0 Susp. intest. enterococci (MF) E. hirae
{S. saprophyticus}
59
Intest. enterococci (MF) E. hirae 58 8 - 3 0 1
Susp. P. aeruginosa (MF) — 0
P. aeruginosa (MF) — 0 - 3 - - -
Culturable microorganisms (total count) 22±2 °C, 3 days
(E. hirae) (S. saprophyticus) (C. sakazakii) (E. coli) 2 44 - 0 0 5 Culturable microorganisms (total count) 36±2 °C, 2 days
S. capitis (E. hirae) (S. saprophyticus) (C. sakazakii) (E. coli) 76 8 - 0 2 1 Coliform bacteria (MF)
- C. sakazakii and E. coli grew as coliform bacteria on LES and LTTC. On LES both E. coli and C. sakazakii formed colonies with clear metallic sheen, although somewhat different. On LTTC the colonies from both strains were
yellow. On this medium grew also a background of small yellow colonies from the intestinal enterococcus strain E. hirae.
Suspected thermotolerant coliform bacteria
- Suspected thermotolerant coliform bacteria were reported by 43 laboratories. Colonies that grow on m-FC and LTTC at 44/44.5 °C were from C. sakazakii and E. coli.
E. coli, MF
- Regardless the primary analysis (at 36±2 °C or 44/44.5°C), for which both the strains of E. coli and C. sakazakii grew, confirmation steps must be performed. This allows eliminating C. sakazakii as suspected E. coli, as this strain is negative for indol production and β-glucuronidase activity.
Coliform bacteria and E. coli (rapid methods, MPN)
- Both E. coli and C. sakazakii were detected as coliform bacteria with methods based on β-galactosidase activity, e.g. Colilert®-18/24 Quanti-Tray® which is clearly the most widely used.
- In mixture B, only the E. coli strain is β-glucuronidase positive and is therefore the only microorganism detected as E. coli with Colilert®-18/24 Quanti-Tray®.
Figure 1g-j Mixture B, see figure 1a-b for explanations
0 3 6 9 12 15 0 15 30 45 60 75 90 105 120 135 150 Coliform bacteria 35/36/37 °C (MF) N o . o f re s u lt s
No. of colonies per 100 ml
* 55 0 3 6 9 12 15 0 15 30 45 60 75 90 105 120 135 150 Escherichia coli (MF) N o . o f re s u lt s
No. of colonies per 100 ml
30 0 3 6 9 12 15 0 15 30 45 60 75 90 105 120 135 150
Coliform bacteria (rapid, MPN)
N o . o f re s u lt s MPN-index per 100 ml * 65 0 3 6 9 12 15 0 15 30 45 60 75 90 105 120 135 150
Escherichia coli (rapid, MPN)
N o . o f re s u lt s MPN-index per 100 ml 36 g h i j
Intestinal enterococci
- E. hirae was the target organism for this analysis. Mixture B also contained a strain of Staphylococcus saprophyticus which can form reddish colonies on m-Ent and sometimes be reckoned as suspected intestinal enterococci.
Figure 1k Mixture B, see figure 1a-b for explanations
Pseudomonas aeruginosa
- Mixture B contained no P. aeruginosa. Two false positive results were reported.
Culturable microorganisms 22°C, 3 days
- Results were good considering the low average value, 2 cfu per ml. S. capitis did not grow at 22°C while the four other strains did but in low numbers. Few high outliers were reported and because of the low average value, the relative dispersion of the results became very large (44 %).
Culturable microorganisms 36°C, 2 days
- S. capitis grew at 36°C and is responsible for the majority of the colonies counted for in this analysis. The other microorganisms present in mixture B formed only few colonies. The relative dispersion of the results was very small.
Figure 1l-m Mixture B, see figure 1a-b for explanations
0 3 6 9 12 15 0 10 20 30 40 50 60 70 80 90 100 Intestinal enterococci (MF) N o . o f re s u lt s
No. of colonies per 100 ml
* 58 0 8 16 24 32 40 0 5 10 15 20 25 30 35 40 45 50
Total plate count 22±2 °C, 3 days
N o . o f re s u lt s
No. of colonies per ml
* 2 0 4 8 12 16 20 0 15 30 45 60 75 90 105 120 135 150
Total plate count 36±2 °C, 2 days
N o . o f re s u lt s
No. of colonies per ml
76
k
Mixture C
The composition of mixture C is presented in Table 1. The microorganisms detected for each analysis are listed in Table 6, as well as the results average, their dispersion (CV) and the percentages of false results and outliers. The results dispersion was small to medium for all analyses.
Table 6 The outcome of each analysis in mixture C; see Table 4 for explanations.
Analysis Organisms cfu/
vol1 CV 2 (%) F+ F- Outl < Outl >
Susp. coliform bacteria (MF) E. coli MUG- K. oxytoca
703 Coliform bacteria (MF) E. coli MUG-
K. oxytoca
690 11 - 1 4 0 Susp. thermotol. colif. bact. (MF) E. coli MUG-
K. oxytoca
219
E. coli (MF) E. coli MUG-
{K. oxytoca}
218 * 15 * - 0 # 2 5 Coliform bact. (rapid method) E. coli MUG-
K. oxytoca
777 11 - 0 0 2
E. coli (rapid method) — 0 - 5 - - -
Susp. intest. enterococci (MF) E. faecium 87
Intest. enterococci (MF) E. faecium 59 29 - 4 0 0 Susp. P. aeruginosa (MF) P. aeruginosa 25
P. aeruginosa (MF) P. aeruginosa 23 20 - 5 0 0 Culturable microorganisms
(total count) 22±2 °C, 3 days
P. fluorescens K. oxytoca E. coli (E. faecium) (P. aeruginosa) 20 18 - 0 0 1 Culturable microorganisms (total count) 36±2 °C, 2 days
K. oxytoca E. coli (E. faecium) (P. aeruginosa)
9 17 - 0 0 1
* Values without both the outliers and the 9 accepted ‖0‖ results
# Nine ‖0‖ results were reported and considered as correct based on the method used
Coliform bacteria (MF)
- The target organisms for this analysis were E. coli and K. oxytoca which form typical colonies on LES and LTTC.
Suspected thermotolerant coliform bacteria
- Suspected thermotolerant coliform bacteria were reported by 43 laboratories. Colonies that grows on m-FC and LTTC at 44/44.5 °C were from E. coli. No assessment is done for this analysis.
E. coli (MF)
- E. coli and K. oxytoca appear with typical colonies on LES and LTTC at 35- 37 °C. In the confirmation step, K. oxytoca could grow in broth at 44 °C and moreover be positive for indol reaction. However, K. oxytoca does not produce gas and is β-glucuronidase negative. The high outliers reported could be due to the count of K. oxytoca colonies interpreted as E. coli based on the indol test. - Only E. coli grows on m-FC and LTTC at 44/44.5 °C and, hence, no K. oxytoca
will be present for confirmation.
- The E. coli strain in mixture C is often considered as β-glucuronidase negative. However the strain can appear slightly positive by a confirmation step in broth complemented with MUG reagent. The strain does not form typical colonies on chromogenic medium based on the detection of β-glucuronidase activity, e.g. Chromocult Coliform Agar® (Merck). Therefore, for laboratories that primarily detected E. coli based on β-glucuronidase activity a null result is correct. When confirmation is practiced, the correct answer may vary based on the interpretation of fluorescence that will be done. These outcomes explain the bar with 9 zero results in the histogram.
Figure 1n-p Mixture C, see figure 1a-b for explanations
0 3 6 9 12 15 0 150 300 450 600 750 900 1050 1200 1350 1500 Coliform bacteria 35/36/37 °C (MF) N o . o f re s u lt s
No. of colonies per 100 ml
690 0 3 6 9 12 15 0 100 200 300 400 500 600 700 800 900 1000 Escherichia coli (MF) N o . o f re s u lt s
No. of colonies per 100 ml
218 (Without zero results)
* Zero results 0 3 6 9 12 15 0 150 300 450 600 750 900 1050 1200 1350 1500
Coliform bacteria (rapid, MPN)
N o . o f re s u lt s MPN-index per 100 ml 777 * n o p
- Because of the different methods used for this analysis and the different interpretation of what is an E. coli, the average value was calculated as usual with the outliers excluded, but here also without the 9 accepted zero results.
Coliform bacteria (rapid methods, MPN)
- Both E. coli and K. oxytoca produce β-galactosidase and are detected as coliform bacteria with methods based on the activity of this enzyme, e.g. Colilert®-18/24 Quanti-Tray® that uses the ONPG substrate.
E. coli (rapid methods, MPN)
- The E. coli strain in mixture C is β-glucuronidase negative or slightly positive but does not fluoresce with Colilert® -18/24 Quanti-Tray®. The bacteria cannot be detected as E. coli with this method. Earlier tests performed at National Food Agency show that fluorescence does not appear even after incubation up till 22 hours.
Intestinal enterococci
- A strain of E. faecium was included in mixture C. The colonies of this strain can differ in size and vary in colony appearance being more or less purple. Sometimes colonies produce only weak blackness on bile-esculine-azide agar in the confirmation step, or even no blackness at all for the smallest. This can explain the zero results and low outliers reported. It happened that low values were obtained also with this strain when the filters that gave low results for E.
durans in mixture A were used. This might be a second explanation to the low
results.
- For all the reasons mentioned above, the results dispersion was quite high (29 %), which was much higher than for the enterococci in mixture A and B.
Figure 1q-r Mixture C, see figure 1a-b for explanations
Pseudomonas aeruginosa
- Colonies from mixture C were not as clearly blue-green as those from mixture A. On the most outer part of the filter, they could instead be light green-yellow on PACN. Even if these colonies fluoresce under UV light, confirmation steps would probably be performed due to their appearance.
0 3 6 9 12 15 0 20 40 60 80 100 120 140 160 180 200 Intestinal enterococci (MF) N o . o f re s u lt s
No. of colonies per 100 ml
59 0 3 6 9 12 15 0 10 20 30 40 50 60 70 80 90 100 Pseudomonas aeruginosa (MF) N o . o f re s u lt s
No. of colonies per 100 ml
23
- The dispersion of the results was the same as for mixture A, in spite the average was lower, 23 and 67 cfu/100 ml, respectively. In both cases the dispersion was larger than usual, which can be explained by the presence of coloured background flora in mixture A and various coloured colonies in mixture C.
Culturable microorganisms 22±2 °C, 3 days and 36±2 °C, 2 days
- All strains present in mixture C grew at 22 °C, but colonies of P. fluorescens are the most abundant.
- At 36±2 °C the strain P. fluorescens did not grow and the majority of colonies were the coliform bacteria.
- Despite the low average value at 36±2 °C, the dispersion is not higher than at 22 °C, which could have been expected. On the other hand, the dispersion from results at 22 °C is higher than usual. It is known that the strain of P. fluorescens leads to a larger variation than many other strains at this temperature.
Figure 1s-t Mixture C, see figure 1a-b for explanations
0 4 8 12 16 20 0 5 10 15 20 25 30 35 40 45 50
Total plate count 22±2 °C, 3 days
N o . o f re s u lt s
No. of colonies per ml
* 20 0 4 8 12 16 20 0 5 10 15 20 25 30 35 40 45 50
Total plate count 36±2 °C, 2 days
N o . o f re s u lt s
No. of colonies per ml
* 9
Outcome of the methods
Method information by use of internet
According to EN ISO/IEC 17043, for which the proficiency testing program organized by the National Food Agency is accredited since early 2012, the provider shall be able to group results according to the methods used. Therefore, it is mandatory to also report information for the methods for which results that will be assessed are reported. The method information is reported via our website
www.slv.se/absint, after logging on.
General information regarding methods outcome
The number of results for the various methods can be seen in the descriptive part of
Annex A. Although method information is available for all numerical results, it is
not always easy to interpret. For example, sometimes the medium used differs from what is stated in the standard. Results from such laboratories are usually not shown in this report. They will be omitted or placed in the group ―Other/Unknown‖ together with results from laboratories with methods used only by a few participants.
Method information from laboratories with outliers or false results for a particular analysis will not be included in the compilations, to make fair method comparisons. Instead, the number of low deviant results (false negatives included) and high deviant results (false positives included) are presented separately, together with the mean etc. The numbers of false results indicate if a particular method leads to more of such results than others. For methods with 6 or fewer results, results dispersion is not calculated and will normally not be discussed in the comparisons. The judgements done are partly subjective.
Tables and figures legends
Tot n total number of laboratories that reported method and result n number of results, outliers and false results excluded
Mv mean value for a method – outliers and false results excluded Med median value for an analyses not assessed
CV Coefficient of variation = relative standard deviation in percent of mean, calculated from the squared-root transformed results. < number of low outliers and/or false negative results
> number of high outliers or false positive results results close to the mean value
highlight low results
highlight high results or many deviant results
highlight results of the group ‖Other/Unknown‖ not evaluated
47 278 601 229
Results based on differences in use of methods
Coliform bacteria (MF)In many cases, laboratories reported the primary medium used, which differs from the one described in the reported standard method. It is unclear if it is the medium or the method reported that is correct, which makes it difficult to compare methods appropriately. Here, we have chosen to consider the reported medium as correct.
The medium m-Endo Agar LES was used 3 to 4 times more than Lactose TTC Agar by laboratories. With the use of Lactose TTC Agar, a higher average value was obtained for mixture A and B but lower for mixture C in comparison with the use of m-Endo Agar LES. None of the mixture caused difficulties for this analysis. The differences may be by chance only or could reflect growth differences of the strains present in each mixture on those media.
Coliform bacteria MF
Medium Tot A B C
n n Mv CV < > n Mv CV < > n Mv CV < >
Total 80 74 237 19 4 1 76 55 16 2 2 76 690 11 4 0
m-Endo Agar LES 56 54 229 18 2 0 54 53 14 1 1 53 724 9 3 0
Lactose TTC Agar 17 14 278 22 1 1 16 58 21 0 1 17 601 13 0 0
Chromocult 1 2 2 220 – 0 0 2 86 – 0 0 2 624 – 0 0
Other/unknown 5 4 216 – 1 0 4 47 – 1 0 4 663 – 1 0
1 Chromocult Coliform Agar® (Merck)
Suspected thermotolerant coliform bacteria (MF)
The two most used media for this analysis were m-FC Agar (described in several national standard methods) and Lactose TTC Agar (EN ISO 9308-1). Incubation was done at 44 or 44.5°C.
Results obtained for this analysis can further be separated according to the standard methods most widely used. These were EN ISO 9308-1 and 3 standards from Nordic countries, i.e. SS 028167 from Sweden, SFS 4088 from Finland and NS 4792 from Norway. In Sweden and according to the standard EN ISO 9308-1 incubation is done at 44 °C. This temperature is also used in most of the Finnish laboratories and in some of the Norwegian laboratories. For the others, incubation takes place at 44.5°C.
As this analysis is not evaluated, only median values are presented in the table. More than half of the laboratories using the standard method SS 028167 got a positive results for the analysis, contrary to the laboratories using other methods. Small, bluish, atypical colonies of E. cloacae usually appear at 44 °C and were probably more or less counted by the laboratories.
For mixture B, higher average value was obtained when using the Finnish standard than when using the Swedish or Norwegian ones. This is related to the way the large grey colonies of C. sakazakii were interpreted. The average is lower if they were not taken into account because they were grey on m-FC Agar. How they were taken into account was probably different among the laboratories.
The results for mixture C were more homogenous as only E. coli was present. Thermotolerant coliform bacteria MF
Standard, Method Tot A B C
n n Med CV < > n Med CV < > n Med CV < >
Total 43 43 0 – – – 43 35 – – – 43 219 – – – EN ISO 9308-1 9 9 0 – – – 9 35 – – – 9 234 – – – SS 028167 11 11 30 – – – 11 28 – – – 11 222 – – – SFS 4088 17 17 0 – – – 17 45 – – – 17 200 – – – NS 4792 5 5 0 – – – 5 24 – – – 5 180 – – – Other/unknown 1 1 0 – – – 1 32 – – – 1 160 – – – E. coli (MF)
E. coli was quantified after confirmation of colonies that grew either at 36±2 °C or
44/44.5 °C. Different media are used for the different temperatures and correspond to the analysis of coliform bacteria or thermotolerant coliform bacteria. The results are presented for each temperature of incubation. Results where it is not clear which incubation temperature was used for the primary growth medium are not included.
E. coli was present in mixture B and C. No method difference could be seen
for mixture B at any temperature. On the other hand, for mixture C results were higher with use of Lactose TTC Agar compared to both Endo Agar LES and m-FC Agar. However, at 44/44.5 °C it seems that there are large differences between the laboratories using the various Nordic standards. For mixture C, Swedish and Finnish standard seem to give higher and lower results than average on m-FC Agar, respectively. However there are too few results to draw any certain conclusion. E. coli MF (from 36±2 °C)
Medium Tot A B C
n n Mv CV < > n Mv CV < > n Mv CV < >
Total 49 48 0 – 0 1 47 34 18 1 0 48 158 44 0 1
m-Endo Agar LES 36 35 0 – 0 1 35 33 16 1 0 36 137 50 0 0
Lactose TTC Agar 10 10 0 – 0 0 9 35 27 0 0 9 228 23 0 0
Chromocult 1 2 2 0 – 0 0 2 30 – 0 0 2 242 – 0 1
Other/unknown 1 1 0 – 0 0 1 49 – 0 0 1 220 – 0 0
1 Chromocult Coliform Agar® (Merck)
E. coli MF (from 44 °C) Medium Tot A B C n n Mv CV < > n Mv CV < > n Mv CV < > Total 14 14 0 – 0 0 13 25 14 0 1 13 188 33 0 1 m-FC Agar 8 8 0 – 0 0 8 24 14 0 0 7 169 49 0 1 Lactose TTC Agar 4 4 0 – 0 0 3 23 – 0 1 4 221 – 0 0 Other/unknown 2 2 0 – 0 0 2 32 – 0 0 2 197 – 0 0
E. coli MF (from 44 °C)
Standard, Method Tot A B C
n n Mv CV < > n Mv CV < > n Mv CV < > Total 14 14 0 – 0 0 13 25 14 0 1 13 188 33 0 1 EN ISO 9308-1 4 4 0 – 0 0 3 23 – 0 1 4 221 – 0 0 SS 028167 2 2 0 – 0 0 2 27 – 0 0 2 324 – 0 0 SFS 4088 3 3 0 – 0 0 3 24 – 0 0 3 76 – 0 0 NS 4792 3 3 0 – 0 0 3 23 – 0 0 2 207 – 0 1 Other/unknown 2 2 0 – 0 0 2 32 0 0 0 2 197 14 0 0
Coliform bacteria and E. coli (rapid methods with MPN)
The rapid method used for these two analyses is almost exclusively Colilert® Quanti-Tray® from IDEXX Inc. Of 60 reporting laboratories, some used trays with 51 wells and others trays with 97 wells, and for still others it is difficult to know which type of trays they used. Analyses were performed either without sample dilution, or with and without dilution. In few cases other methods were used, as national standard, some not being rapid methods, like the classic method with MPN quantification of cfu in tubes. In one case qualitative analysis was made using Colilert substrate. Results with no stated method are not evaluated.
No obvious differences appeared in the results of the two analyses depending on types of trays used. Most of the outliers were obtained with 97 wells trays which were the most used. Two outliers were obtained also by another rapid method. Coliform bacteria, rapid method with MPN
Medium Tot A B C n n Mv CV < > n Mv CV < > n Mv CV < > Total 60 58 256 11 1 1 59 65 10 0 1 59 785 10 0 1 Colilert Quanti-51 20 20 251 12 0 0 20 63 11 0 0 20 765 11 0 0 Colilert Quanti-97 32 31 264 11 1 0 31 67 8 0 1 31 806 10 0 1 Colilert Quanti-? 7 7 240 11 0 0 7 70 12 0 0 7 733 7 0 0 Other/unknown 1 0 – – 0 1 1 35 – 0 0 1 920 – 0 0
E. coli, rapid method with MPN
Medium Tot A B C n n Mv CV < > n Mv CV < > n Mv CV < > Total 59 58 0 – 0 1 58 37 11 1 0 56 0 – 0 3 Colilert Quanti-51 20 20 0 – 0 0 20 35 11 0 0 20 0 – 0 0 Colilert Quanti-97 33 32 0 – 0 1 32 37 11 1 0 31 0 – 0 2 Colilert Quanti-? 5 5 0 – 0 0 5 41 12 0 0 5 0 – 0 0 Other/unknown 1 1 0 – 0 0 1 35 – 0 0 0 0 – 0 1 Intestinal enterococci (MF)
For this analysis, the method XX-EN ISO 7899-2:2000 was almost always the one used. In some cases an earlier version of this method was used, i.e. ISO
7899-2:1984. The medium used (with 1 obvious and 2 probable exceptions) was m-Enterococcus Agar, often referred to also as Slanetz & Bartley Agar in comments. Temperature of incubation was always 36±2 °C, and confirmation was in the majority of the cases performed with Bile-esculine-azide agar at 44 °C. Seven laboratories also performed the catalase test.
Intestinal enterococci MF Medium Tot A B C n n Mv CV < > n Mv CV < > n Mv CV < > Total 80 71 566 9 9 0 77 58 8 2 1 77 59 29 3 0 m-Enterococcus A 77 68 566 9 9 0 74 58 8 2 1 74 60 29 3 0 KF Streptococcus A 1 1 560 – 0 0 1 53 – 0 0 1 85 – 0 0 Other/unknown 2 2 577 – 0 0 2 68 – 0 0 2 38 – 0 0 Pseudomonas aeruginosa (MF)
The method XX-EN ISO 16266:2008 (with or without modification) was used by almost all the 60 laboratories reporting results for this analysis. An alternative was the identical and now withdrawn CEN-method EN 12780:2002 (with or without modification). Incubation was done at 36±2°C with one exception and laboratories used ‖Pseudomonas Agar base‖ with cetrimid and/or nalidixic acid (C/N-supplement). In two cases Pseudomonas Isolation agar was used. Different confirmation tests were performed when necessary.
Method and medium used did not differ for this analysis, making any discussion of these irrelevant. However, the added supplements differ. Several laboratories reported to add both cetrimide and nalidixic acid to the medium, quite many added only cetrimide, while few added only nalidixic acid. One laboratory reported the use of Irgasan in Pseudomonas Agar base. In some cases the supplement added was not clear.
Mixture A and C contained P. aeruginosa. For mixture A the addition of only nalidixic acid seemed to give lower results. This is however not the case for mixture C in which another strain of P. aeruginosa was included. The laboratory that used Irgasan reported higher results for both mixtures A and C. No other possible differences are visible.
Pseudomonas aeruginosa MF
Selective substrate Tot A B C
n n Mv CV < > n Mv CV < > n Mv CV < > Total 64 58 67 20 1 5 62 0 – 0 2 60 23 20 3 0 Cetrimide+Nalidix. 35 32 66 15 0 3 35 0 – 0 0 34 23 22 1 0 Cetrimide 20 17 70 26 1 2 18 0 – 0 2 18 22 19 1 0 Nalidixic acid 5 5 51 17 0 0 5 0 – 0 0 5 24 5 0 0 Irgasan 1 1 126 – 0 0 1 0 – 0 0 1 33 – 0 0 Other/unknown 3 3 71 – 0 0 3 0 – 0 0 2 28 – 1 0
Culturable microorganisms at 22±2 and 36±2 °C
Around 100 and 90 results were reported for the analyses at 22 °C and 36 °C, respectively. Only 4 and 5 laboratories used another method than XX-EN ISO 6222:1999 for the analyses at 22 °C and 36 °C, respectively, and none of these obtained any deviant results.
Because of the almost exclusive use of XX-EN ISO 6222:1999, we looked at potential results difference depending of the culture medium and magnification to read the plates.
For mixture A and B, at 22 °C, there is a possible trend that results obtained with ‖Plate Count Agar‖ are lower than with ‖Yeast extract Agar‖. However, this was not true for the analysis performed at 36±2 °C. Although the results are very similar, it seems that results are slightly higher when higher magnification is used. However, this is not confirmed for mixture B and C at 36 °C. Outliers were obtained independently of the magnification.
Culturable microorganisms at 22 °C, 3 days
Medium Tot A B C
n n Mv CV < > n Mv CV < > n Mv CV < >
Total 99 98 38 11 0 1 94 2 44 0 5 98 20 18 0 1
Yeast extract Agar 83 82 39 9 0 1 80 2 42 0 3 82 20 16 0 1
Plate Count Agar 14 14 32 16 0 0 13 1 52 0 1 14 21 21 0 0
Other/unknown 2 2 29 – 0 0 1 0 – 0 1 2 9 – 0 0 Magnification Tot A B C n n Mv CV < > n Mv CV < > n Mv CV < > Total 99 98 38 11 0 1 94 2 44 0 5 98 20 18 0 1 None 24 24 36 10 0 0 23 1 61 0 1 24 19 19 0 0 1,1–4,9× 43 43 37 12 0 0 41 2 39 0 2 43 20 18 0 0 5–11,9× 32 31 40 9 0 1 30 2 40 0 2 31 21 18 0 1 > 12× 0 0 – – – – 0 – – – – 0 – – – – Unknown 0 0 – – – – 0 – – – – 0 – – – –
Culturable microorganisms at 36±2 °C, 2 days
Medium Tot A B C
n n Mv CV < > n Mv CV < > n Mv CV < >
Total 81 80 38 9 0 1 78 75 8 2 1 80 9 17 0 1
Yeast extract Agar 72 71 38 9 0 1 70 76 7 1 1 71 8 15 0 1
Plate Count Agar 7 7 37 14 0 0 7 69 11 0 0 7 8 26 0 0
Other/unknown 2 2 35 – 0 0 1 48 – 1 0 2 16 – 0 0 Magnification Tot A B C n n Mv CV < > n Mv CV < > n Mv CV < > Total 81 80 38 9 0 1 78 75 8 2 1 80 9 17 0 1 None 19 19 36 11 0 0 18 74 10 1 0 19 9 20 0 0 1,1–4,9× 39 39 37 9 0 0 38 76 7 1 0 39 8 18 0 0 5–11,9× 23 22 42 8 0 1 22 75 8 0 1 22 9 13 0 1 > 12× 0 0 – – – – 0 – – – – 0 – – – – Unknown 0 0 – – – – 0 – – – – 0 – – – –
The outcome of deviating results – assessment
The results of all laboratories are listed in Annex A. A summary of the results of each laboratory – false results excluded – is illustrated by a box plot based on their z-scores (Figure 2). The smaller, and the more centred around zero the box of a laboratory is, the closer its results are to the general mean values calculated for all laboratory results.
The laboratories are not grouped or ranked based on their results. However,
the assessment aims to clearly give information regarding the number of false results and outliers which are presented below the box plots. These results are also
are highlighted in Annex A, where also the minimum and maximum accepted values for each analysis are stated in the summarizing rows at the end.
In cases where it is obvious, it is also stated if a laboratory has mixed up the analytical results. If mixtures have been mixed up, it is shown by crossing of their sample numbers in Annex A. One laboratory seemed to have mixed up the results from mixture A and B, except for the analysis of culturable microorganisms. No laboratory seemed to have mixed results for single analyses. In a few cases, it is suspected that laboratories have missed to give their results for the volumes asked for, namely 100 ml in all analyses except for culturable microorganisms where 1 ml is appropriate.
Laboratories that have not reported results or reported too late can compare their results with results from other laboratories presented in Annex A.
Z-values listed in Annex B are the base for the box plots but they are not commented or evaluated. They can be used by laboratories in their follow-up process.
In the scheme protocol (3) the calculation of uncertainty of measurement of the assigned value is described. The assigned value for an analysis is calculated from the squared-root transformed results and is the squared-root of ―Mean‖ in Annex A, and there denoted as mv. The standard uncertainty of measurement (u) correspond to the standard deviation of the assigned value (s) divided by the number of results squared-root transformed, i.e.: u = s/ nmv where nmv is the number of results in Annex A, except the deviating ones. Here is the relative uncertainty (urel) used and expressed as per cent by multiplication by 100.
Description of the result processing and recommendations on follow-up work are given in the scheme protocol (3). A PDF file of that document is available on the website www.slv.se/absint.
Figure 2 Box plots and number of deviating values for each participating laboratory. The square root transformed results of a laboratory is converted into standardised values (z-value) to be able to compare the different analyses.
- Standardised values are calculated from the formula z = (x – mv) / s
- Standardised values > +4 and < 4 have in the plots received the values +4 and 4, respectively.
- False results do not generate z values and are not included in ‘No. of results’.
False positive results cannot be illustrated in the box plots. The no. of false positives and false negatives are clear from the table beneath the plots.
- The outliers in the table are included in the plots after recalculation to
standardised values with the same s values as the rest of the results.
- The horizontal line in each box indicates the median for the laboratory.
- The two box area parts include 25% of the results above and below the median,
respectively. The lines reaching out from the box and/or the circles include the remaining 50% of the results, false results excluded.
- A circle is created when a result is highly deviating* from the rest.
- The background is decorated by fields with colours of different intensity in order
to simplify localisation of the laboratory results.
_________________
* < [smallest value of the box - 1.5 × (largest value of the box - smallest value of the box)] or > [largest value of the box + 1.5 × (largest value of the box - smallest value of the box)]
z-va lue Lab no. 1131 1149 1237 1254 1290 1545 1594 1611 1753 1868 1970 2050 2386 2637 2670 2704 2745 3042 3055 3076 No. of results 15 3 12 24 17 18 24 23 24 15 17 24 18 15 - 21 9 23 3 9 False positive - - - -False negative - - - - 1 - - 1 - - - -Low outliers - - 1 - - - -High outliers - - - - 1 - - 1 - - - 1 - - - 3 - -False negative ? - - - --4 -2 0 2 4
z-va lue Lab no. 3159 3162 3305 3339 3475 3511 3533 3588 3730 4015 4064 4180 4278 4288 4319 4339 4343 4356 4539 4633 No. of results 21 23 24 18 - 15 - 18 3 17 14 16 5 3 20 24 24 24 18 21 False positive - - - 1 - - - - -False negative - - - 1 1 1 1 3 - - - -Low outliers - - - 1 - - 2 - - - 1 - - -High outliers - - - 1 - 1 - - - -False negative ? - - - -RSZ -1,93 1,01 -0,22 0,23 - -0,22 - -0,07 4,82 -1,38 0,12 -1,61 -5,12 -1,39 0,25 0,49 -1,24 0,03 0,2 -0,57 SD 0,93 0,76 0,83 0,72 - 0,97 - 0,81 4,34 1,81 1,86 0,74 3,32 0,97 1,11 0,57 1,09 0,69 0,9 0,72 z-va lue Lab no. 4713 4723 4889 4980 5018 5094 5120 5197 5201 5220 5352 5447 5553 5893 5950 6180 6233 6253 6456 6563 No. of results 21 12 - 20 23 12 24 14 9 12 3 15 3 9 24 24 18 9 21 24 False positive - - - -False negative - - - 1 - - - 1 - - - -Low outliers - - - -High outliers - - - 1 - - - -False negative ? - - - --4 -2 0 2 4 -4 -2 0 2 4
z-va lue Lab no. 6731 6852 7096 7191 7248 7282 7302 7330 7442 7564 7596 7626 7688 7728 7876 7896 7906 7930 7946 7962 No. of results 8 9 18 - 24 15 18 15 15 6 24 24 23 18 24 18 6 24 22 22 False positive - - - 3 - - - 2 -False negative - - - 3 - - - 1 - - - -Low outliers - 1 - - - - 2 - - - - 1 1 - - - - 1 - 1 High outliers - - - - 1 - 7 - - - 2 -False negative ? - - - -RSZ -1,54 -2,52 1,51 - 0,95 0,61 25,3 -2,72 0,73 -0,96 0,25 -2,68 -1,17 -0,01 0,95 0,37 -0,05 -3,44 1,84 -0,71 SD 1,39 2,09 0,58 - 2,47 1,42 10,3 0,7 0,42 0,48 1,01 0,88 1,24 0,69 0,6 1,16 1,38 2,1 3,55 1,83 z-va lue Lab no. 7968 8068 8177 8255 8260 8329 8380 8428 8435 8569 8598 8626 8628 8663 8742 8766 8809 8862 8891 8898 No. of results 24 23 20 23 9 - 24 14 18 9 - 9 18 24 6 23 14 23 3 24 False positive - - - 1 - -False negative - - - 1 - - - 1 - - -Low outliers - - 1 - - - 2 - - -High outliers - - - - 1 - 1 - 2 - - - 1 - - 1 2 - - --4 -2 0 2 4 -4 -2 0 2 4
z-va lue Lab no. 8955 9002 9051 9306 9359 9436 9441 9451 9465 9569 9736 9899 9903 9956 No. of results 24 11 18 12 - 24 12 18 24 24 23 24 18 24 False positive - - - -False negative - - - 1 - - -Low outliers - - - 3 High outliers - - - 1 - - - -False negative ? - - - --4 -2 0 2 4
References
1. Anonymous 1998. Council Directive 98/83/EC of 3 November 1998 on the quality of water intended for human consumption. Official Journal of the European Communities. 5.12.98, L 330/32-54 (there are national translations). 2. Peterz, M., Steneryd, A.-C. 1993. Freeze-dried mixed cultures as reference
samples in quantitative and qualitative microbiological examinations of food. J. Appl. Bacteriol. 74:143-148.
3. Anonymous 2012. Proficiency Testing Schemes, Protocol, Microbiology, Drinking water & Food. National Food Administration, Uppsala, 26 p.
4. Kelly, K. 1990. Outlier detection in collaborative studies. J. Assoc. Off. Chem. 73:58-64.
5. Niemi, R. M., Mentu, J., Siitonen, A., Niemelä, S. I. 2003 Confirmation of
Escherichia coli and its distinction from Klebsiella species by gas and indole
Lab no. A B C A B C A B C A B C A B C A B C A B C 1131 2 1 3 200 63 727 200 63 727 - - - 0 34 264 185 66 1120 0 39 0 1149 3 2 1 184 35 620 - - - -1237 2 3 1 - - - 210 67 350 - - - 201 44 501 - - -1254 2 3 1 - - - 130 51 680 - - - 0 26 210 210 54 660 <1 26 <1 1290 2 3 1 - - - 185 10 390 - - - <1 8 390 - - - -1545 1 2 3 360 42 810 360 42 810 360 11 260 0 11 260 - - - -1594 2 1 3 290 41 860 290 41 860 0 14 190 0 25 240 290 43 870 0 35 0 1611 1 2 3 350 88 500 350 84 400 0 46 190 0 40 200 326 67 784 0 32 0 1753 2 3 1 218 62 836 218 62 836 - - - 0 38 282 275 69 876 0 49 0 1868 1 3 2 238 50 784 238 50 784 - - - 0 25 236 365 64 982 0 36 0 1970 1 3 2 290 58 750 290 48 750 37 48 170 0 48 0 - - - -2050 1 3 2 - - - 209 61 755 - - - 0 35 282 206 81 1874 0 39 0 2386 2 1 3 260 69 680 260 69 680 0 62 180 0 35 180 - - - -2637 3 1 2 - - - 345 57 727 <1 33 <1 2670 2 3 1 - - - -2704 3 2 1 - - - 210 49 610 - - - 0 44 180 222 83 945 <1 45 <1 2745 1 2 3 280 57 650 280 57 650 0 33 250 0 33 250 - - - -3042 2 3 1 - - - >100 220 500 - - - 0 110 400 200 53 1000 0 31 0 3055 2 3 1 - - - -3076 2 1 3 - - - -3159 3 1 2 - - - 210 38 470 - - - 0 15 150 178 53,1 831 <1 28,8 <1 3162 1 2 3 270 50 600 270 50 600 - - - 0 27 0 308 73 816 0 35 0 3305 2 3 1 - - - 300 45 600 - - - <1 38 300 340 57 890 <1 27 <1 3339 2 3 1 100 70 650 100 70 650 - - - 0 30 190 - - - -3475 1 2 3 - - - -3511 2 1 3 - - - 288 78 831 0 43 0 3533 2 1 3 - - - -3588 3 1 2 270 71 830 270 71 830 0 34 132 0 17 132 - - - -3730 2 3 1 100 45 600 - - - 0 23 440 - - - -4015 2 1 3 243 61 773 243 61 773 85 50 291 0 32 196 344 59 866 0 27 0 4064 3 1 2 262 47 775 262 47 775 - - - 0 38 775 - - - -4180 3 1 2 - - - 220 47 762 - - - 0 - 117 - - - -4278 3 1 2 - - - 0 2 66 - - - -4288 1 2 3 <1 <1 <1 <1 <1 <1 - - - -4319 1 3 2 273 57 665 263 57 665 0 54 240 0 34 140 345 70 734 0 43 220 4339 1 2 3 - - - 200 75 809 <1 51 250 <1 32 270 260 78 726 <1 38 <1 4343 1 2 3 297 45 640 297 45 640 - - - 0 28 37 248 49 517 0 36 0 4356 1 3 2 280 55 750 280 55 750 0 43 200 0 28 180 220 49 870 <1 31 <1 4539 1 3 2 - - - 280 52 855 0 29 0 4633 1 3 2 - - - 182 55 516 0 25 130 0 25 130 270 75 583 0 35 0 4713 3 1 2 130 52 590 130 52 590 <1 15 220 <1 21 240 210 56 740 <1 36 <1 4723 2 1 3 545 35 703 545 35 703 30 2 145 0 26 215 - - - -4889 2 1 3 - - - -4980 1 3 2 - - - 0 24 160 0 24 160 344 83,1 624 <1 50,4 <1 5018 1 2 3 320 64 560 320 64 560 - - - 0 26 0 411 69 649 0 32 0 5094 2 3 1 330 37 800 330 37 800 0 24 200 0 18 200 - - - -5120 3 2 1 180 45 670 180 45 670 110 58 330 0 27 210 214 93 770 0 64 0 5197 1 3 2 - - - 0 18 180 - - - -5201 1 2 3 225 49 665 225 49 665 - - - 0 49 220 - - - -5220 3 2 1 - - - 0 20 180 - - - -5352 2 1 3 - - - -5447 2 1 3 - - - 191 68 827 - - - 0 35 331 - - - -5553 3 1 2 - - - -5893 3 2 1 - - - <1 34 760 - - - -5950 2 3 1 270 49 845 270 49 845 21 48 196 0 29 260 251 70 689 0 38 0 6180 1 3 2 290 73 780 290 73 780 0 48 230 0 38 152 248 59 950 <1 32 <1 6233 1 2 3 - - - 0 45 240 - - - 290 69 1230 0 34 0 6253 1 2 3 - - - 300 71 710 0 40 0 6456 3 1 2 - - - 245 48 765 - - - 0 26 195 158 62 831 0 32 0 6563 2 1 3 182 66 760 182 66 760 182 66 760 0 33 380 164 84 722 0 45 0 6731 3 2 1 - - - >1 >1 >1 0 >1 0 6852 2 3 1 - - - 280 13 350 <1 27 <1 7096 2 3 1 - - - 240 65 840 - - - 0 35 170 - - - -7191 3 1 2 - - - -7248 1 2 3 305 38 741 305 38 741 0 3 88 0 3 88 225 76,9 935,2 0 50,5 0 7282 2 3 1 - - - 0 18 160 - - -
-Sample Suspected coliform
bacteria (MF) Coliform bacteria (MF) Susp. thermotolerant coliform bact. (MF) E. coli (MF) Coliform bacteria ("rapid" MPN) E. coli ("rapid" MPN)
Annex A Results of the participants. Susp. = suspected on membrane filter before confirmation. Results given as <1, <2, <10 and <100 are treated as zero. The fields with other results given as < 'value' and results given as > 'value' are yellow, and those results are not included in calculations or evaluations. This is also valid for results in shaded
columns. Empty hatched fields indicate that the result has been deleted due to
misunderstanding of instructions or use of improper method. A hyphen indicate that no result has been reported. Figures written in bold in yellow fields indicate outliers, false positive and false negative results. Underlined zero values indicate results characterized as 'False negative ?'. Crossed out sample numbers in a row indicate that the samples probably are mixed up. False positive and false negative values are excluded, as well as other outliers, in
Lab no. A B C A B C A B C A B C A B C - - - 31 1 9 - - - 1131 - - - 33 3 13 - - - 1149 - - - 31 2 9 27 38 10 1237 - - - 670 68 30 - - - 55 0 42 38 2 27 33 75 10 1254 - - - 525 62 71 - - - 66 <1 <1 35 30 15 35 103 11 1290 690 54 67 690 54 67 59 0 31 59 0 31 45 2 22 44 75 11 1545 600 62 88 600 62 84 50 0 26 50 0 26 46 3 23 48 76 11 1594 560 52 116 0 52 116 400 0 36 400 0 36 60 2 16 40 73 4 1611 773 55 90 773 55 85 90 0 33 90 0 33 31 0 13 41 53 6 1753 445 55 88 - - - 33 2 28 - - - 1868 460 51 23 460 51 23 150 0 29 150 0 29 30 3 35 39 73 6 1970 - - - 600 55 12 - - - 118 0 18 43 2 32 47 95 7 2050 620 52 91 620 52 14 100 0 21 100 0 21 49 5 21 31 57 10 2386 - - - 640 55 27 - - - 42 <1 16 30 66 5 2637 - - - 2670 - - - 490 65 6 - - - 45 0 7 45 79 11 2704 - - - 42 1 13 - - - 2745 - - - 630 55 84 - - - 1000 0 15 49 2 17 43 77 10 3042 - - - 43 1 26 - - - 3055 - - - 50 0 14 50 0 14 42 2 17 40 81 9 3076 - - - 660 58 7 - - - 34 5 26 38 66 9 3159 530 70 70 530 40 70 80 0 34 80 0 37 41 2 26 45 98 11 3162 600 65 100 600 65 100 34 <1 13 34 <1 13 35 1 24 30 65 11 3305 600 58 83 600 58 83 60 0 22 60 0 22 39 2 22 42 98 7 3339 - - - 3475 - - - 350 49 79 - - - 31 2 30 29 79 9 3511 - - - 3533 540 54 97 540 54 79 71 0 14 71 0 14 45 3 22 39 86 5 3588 - - - 129 3 19 - - - 3730 132 115 0 83 59 0 - - - 40 3 15 - - - 4015 480 47 7 480 0 7 - - - 34 2 17 34 56 8 4064 - - - 440 56 79 - - - 38 0 0 39 2 11 30 79 8 4180 - - - 42 3 13 - - - 4278 - - - 24 1 20 - - - 4288 545 77 29 540 77 15 - - - 17 2 34 38 81 10 4319 - - - 640 63 40 50 <1 27 50 <1 27 35 4 19 35 67 7 4339 613 98 86 613 60 19 72 0 21 72 0 21 52 2 33 39 74 6 4343 630 56 93 630 56 93 100 0 37 100 0 37 38 3 20 28 74 7 4356 453 55 73 453 54 45 800 0 20 90 0 20 38 9 22 41 72 10 4539 - - - 500 64 76 - - - 35 2 24 32 90 11 4633 570 47 88 570 47 61 110 <1 20 110 <1 5 46 2 28 - - - 4713 555 118 118 555 55 118 - - - 49 2 44 - - - 4723 - - - 4889 600 64 80 600 64 8 38 0 0 38 0 0 30 1 15 29 60 8 4980 530 51 136 530 51 36 75 0 24 75 0 24 44 1 15 50 78 11 5018 600 45 91 - - - 50 0 200 - - - 46 0 12 33 68 5 5094 500 78 95 500 78 95 59 0 38 59 0 34 39 1 34 46 74 15 5120 - - - 0 70 51 - - - 59 0 29 38 0 25 22 73 5 5197 - - - 43 2 21 - - - 5201 - - - 720 53 80 - - - 20 2 10 32 82 3 5220 - - - 37 79 11 5352 - - - 673 56 83 - - - 44 2 22 39 67 9 5447 - - - 540 63 68 - - - 5553 - - - 530 70 65 - - - 37 93 14 5893 600 57 93 600 57 93 100 0 35 100 0 35 40 2 22 48 91 10 5950 590 110 105 590 55 41 56 0 18 56 0 18 39 2 20 35 73 10 6180 630 58 93 630 58 93 43 0 28 43 0 28 42 5 20 44 87 10 6233 500 59 100 - - - 36 4 22 - - - 6253 - - - 570 45 80 - - - 48 0 27 44 59 7 6456 560 48 57 560 48 30 70 0 26 70 0 26 50 2 36 55 65 9 6563 - - - 30 1 12 28 106 3 6731 - - - 40 88 10 6852 - - - 640 63 94 - - - 100 0 21 40 3 16 47 87 8 7096 - - - 7191 331 59 64 331 59 64 75 0 28 75 0 28 37 55 18 43 65 7 7248 - - - 740 32 83 - - - 130 0 25 40 2 29 54 90 5 7282 50 560 130 50 560 130 0 64 29 0 64 29 54 153 573 140 90 196 7302 Pseudomonas
aeruginosa (MF) Total plate count 22 °C, 3 days Total plate count 36±2 °C, 2 days Susp. Pseudomonas aeruginosa (MF) Intestinal enterococci (MF) Susp. intestinal enterococci (MF)
the summarizing calculated results at the end of the table. The mean value (Mean) is the square of the mean value for the square root transformed results (mv). The coefficient of variation (CV) is the standard deviation (s) in percentage of the mean value for the square root transformed results. As means to calculate the z-values of your own, the appropriate values of mv and s are given at the end of the table. The x-values of a laboratory are obtained as the square roots of each reported result, respectively.
z = (x - mv) / s. urel,mv is the relative standard uncertainty of mv in per cent. For calculation see the scheme protocol (3); also briefly described in the text.
* The 9 zero results for E. coli (MF) in sample C are considered to be correct and not false negative, even though they are marked.