I N T E R A C T I O N S O F M U C I N S W I T H B I O P O L Y M E R S A N D D R U G D E L I V E R Y P A R T I C L E S
Malmö University
Health and Society Doctoral Dissertations 2008:2
© Olof Svensson 2008 ISBN 978-91-7104-212-5 ISSN 1653-5383 Holmbergs, Malmö 2008
Malmö University, 2008
The Faculty of Health and Society
OLOF SVENSSON
INTERACTIONS OF MUCINS
WITH BIOPOLYMERS AND
DRUG DELIVERY PARTICLES
CONTENTS
ABSTRACT ... 10
LIST OF PAPERS ... 12
INTRODUCTION ... 14
Background and aim ... 14
The mucous gel and mucins ... 16
Polyelectrolyte multilayers ... 22
MATERIALS AND METHODS ... 27
Proteins and polymers ... 27
Surfaces ... 30
Ellipsometry ... 31
Particle electrophoresis ... 40
Atomic force microscopy ... 41
Electrochemistry ... 42
RESULTS AND DISCUSSION ... 44
Layer-by-layer film formation with mucin ... 44
Interactions between drug delivery particles and mucin ... 58
SUMMARY AND CONCLUDING REMARKS ... 65
POPULÄRVETENSKAPLIG SAMMANFATTNING ... 67
ACKNOWLEDGEMENT ... 70
REFERENCES ... 71
ABSTRACT
The main components in the mucous gels apart from water are mucins, which are proteins with high molecular weights and an abundance of negatively charged oligosaccharide side chains. The aim of the investigations was to char-acterize interactions between mucins and other proteins that are present in the mucous gel, and also between mucins and components used in pharmaceutical formulations. More specifically, the main objectives were (I) to investigate the possibility to assemble multilayer films with mucins and oppositely charged polymers or proteins on solid substrates; (II) to evaluate mucoadhesive proper-ties of drug delivery particles by examination of their interactions with mucins. The construction of multilayer films was performed on silica and hydropho-bized silica surfaces by alternate adsorption, and the adsorbed amount and thickness of the films were measured in situ by time resolved ellipsometry. It was demonstrated that films could be assembled using mucins in combination with both chitosan and lactoperoxidase. The build-up was characterized by ad-sorption and redissolution processes, and the extent of redissolution could be explained by taking the charge densities and concentrations of the components into account. It was also demonstrated that the nature of the substrate can be crucial for the possibilities to assemble multilayer films, and from the results it may be concluded that a high amount of mucin in the first step is important for successful layer-by-layer assembly. Furthermore, it was demonstrated that lac-toperoxidase is catalytically active when adsorbed to mucin layers, and it may thereby exert its antimicrobial action.
The evaluation of mucoadhesive properties of drug delivery particles was per-formed with lipid nanoparticles stabilized by a poly(ethylene oxide) based polymer and with particles modified by chitosan. Both types of model particles (unmodified and chitosan modified) were investigated by measuring their ad-sorption to mucin-coated silica surfaces by ellipsometry. It was shown that the binding of unmodified particles to mucin-coated silica surfaces was weak and pH-dependent. Based on the pH and electrolyte dependence of the adsorption, it was proposed that the interaction is mediated by hydrogen bonding between protonated carboxyl groups in the mucin molecule and oxygen atoms in poly(ethylene oxide). Chitosan modified particles, on the other hand, showed a substantial and strong binding to mucin-coated surfaces, which can probably be attributed to interactions between amino groups in chitosan and negatively charged groups in the mucin layer. The findings from the present investigations are in agreement with previous reports on the interaction of mucins with poly(ethylene oxide) and chitosan. It can therefore be concluded that the meth-odology applied is useful for evaluating mucoadhesive properties of nanoparti-cles.
LIST OF PAPERS
I. Layer-by-layer assembly of mucin and chitosan - Influence of surface properties, concentration and type of mucin. Olof Svensson, Liselott Lindh, Marité Cárdenas and Thomas Arnebrant, Journal of Colloid and Interface Science 2006, 299(2), 608-16.
II. The salivary mucin MUC5B and lactoperoxidase can be used for layer-by-layer film formation. Liselott Lindh, Ida Svendsen, Olof Svensson, Marité Cárdenas and Thomas Arnebrant, Journal of Colloid and Inter-face Science 2007, 310(1), 74-82.
III. Activity of lactoperoxidase when adsorbed on protein layers. Karolina Haberska, Olof Svensson, Sergey Shleev, Liselott Lindh, Thomas Arne-brant and Tautgirdas Ruzgas, Manuscript
IV. Interactions between drug delivery particles and mucin in solution and at interfaces. Olof Svensson, Krister Thuresson and Thomas Arnebrant, Ac-cepted for publication in Langmuir
V. Interactions between chitosan-modified particles and mucin-coated sur-faces. Olof Svensson, Krister Thuresson and Thomas Arnebrant, Manu-script
Reprint permission of papers I and II has been granted by Elsevier Inc. and a blanket permission is granted by the American Chemical Society for reprinting of paper IV.
Contributions to the publications
I performed most of the planning and essentially all experimental work in pa-pers I, IV and V. In addition I did the writing of the manuscripts with support from the co-authors. My contribution to paper II was to perform data analysis, take part in discussions of the results and write parts of the manuscript. I also made minor contributions to the experimental work. In paper III, I was con-tributing to the planning of the experimental work as well as performing most of the ellipsometric measurements.
INTRODUCTION
Background and aim
The mucous gel layer is a highly hydrated protein gel that covers the mucosal surfaces of our body and its general function is to protect the underlying muco-sal tissues from dehydration, mechanical stress and bacterial infections. In hu-mans the average thickness of the mucous gel is estimated to be a few hundred micrometers, and the main component apart from water is a group of glycopro-teins referred to as mucins. This class of high molecular weight glycoproglycopro-teins is important in many aspects and is for example considered to form the backbone of the gel.
As all nutrients and most pharmaceuticals on the market enter our body through the mucous gel, the composition and structure of this gel is of obvious scientific interest. From this perspective my research at Malmö University has been focused on the interactions of mucins with other types of proteins that are naturally present in the mucous gel as well as molecules and assemblies of molecules used in pharmaceutical formulations. The general aim has been to gain a deeper understanding of how molecules present in the native mucous gel can combine to form a three-dimensional network and how mucins interact with pharmaceutical constituents.
The main objectives have been:
I. To investigate the possibility to form multilayer films with mucins and oppo-sitely charged polymers or proteins on solid substrates. The possibility to meas-ure enzymatic activity of proteins in these structmeas-ures was also addressed. This work was done with the ambition to create artificial gels that could act as
mu-cous models to study the interactions with for example pharmaceutical formu-lations. In addition the assembled films could have interesting lubricating and antiadhesive properties that would be of interest for coatings of contact lenses and dental implants.
II. To study the interactions between drug delivery particles and mucin in order to evaluate their mucoadhesive properties and also to understand interactions between mucin and pharmaceutical constituents. Such knowledge is of interest in the area of mucosal drug delivery and the development of novel mucosal drug delivery systems.
The Introduction of the thesis consists of a description of the general properties of the mucous gel with emphasis on mucins and their interactions with other mucus components and adsorption to solid surfaces. Also the layer-by-layer as-sembly of oppositely charged polymers or proteins is described focusing on the assembly process and the use of proteins in these structures. In the Materials and Methods part, the experimental techniques are described and information about the key proteins and polymers is provided. The emphasis of this section is on ellipsometry, which was the main experimental technique used, and mucins, which were the key proteins in my investigations.
The Result and Discussion section is divided into two parts, where the first part presents layer-by-layer assembly of mucin and oppositely charged biopolymers (papers I, II and III). The second part is devoted to the interactions between particles aimed for drug delivery and mucin-coated surfaces (papers IV and V). I have presented what I consider to be the most important and interesting ob-servations and the results obtained in the individual papers are discussed in re-lation to each other.
The mucous gel and mucins
The mucous gel
The mucous gel layer (mucus) is a highly hydrated protein gel that covers the mucosal surfaces in for example the gastrointestinal, pulmonary, oral, nasal and genital tracts. Its function and composition differs at different locations of our body, but a general function of the mucus is to protect mucosal tissues from dehydration, mechanical stress, harmful microorganisms and toxic sub-stances.
Mucus proteins originate from mucous producing goblet cells that are localized in the epithelial cell layer or in mucous producing glands. The secreted mucous forms a viscoelastic gel on the epithelial surfaces, and the thickness of the gel depends on its location. In for example the gastrointestinal tract of rats, the thickness has been reported to vary between 100 µm in the jejunum to 800 µm in the colon.1 The water content of mucus is high and reported values suggest that the water content of native mucus is approximately 90%.2, 3
The compositions of various mucous gels have been investigated in several stud-ies, with the conclusion that a group of glycoproteins identified as mucins is the main component apart from water in terms of mass of the gel, with an ap-proximate concentration of 50 mg/mL.3 In addition to mucins, other proteins, lipids and nucleic acids have been identified in the mucous gel.4, 5
Many proteins that are specifically secreted in the body have an active role in the protection against bacterial infections. For example IgA, lysozyme, lactoferrin and lactop-eroxidase, which all have protective functions, have been identified in mucous secretions.4, 6
Mucins
Mucins are structurally similar and have many properties in common, although a high degree of diversity exists within this group. The molecular weight is gen-erally high, ranging between 0.2 and 10 million Dalton, and all mucins contain one or more domains which are highly glycosylated. The glycosylated domains are enriched in serine and threonine residues which serve as anchoring points
for oligosaccharide side chains. These O-linked oligosaccharide side chains are complex both in terms of composition and length, and apart from differences in glycosylation between different mucins, different “glycoforms” have been iden-tified.7
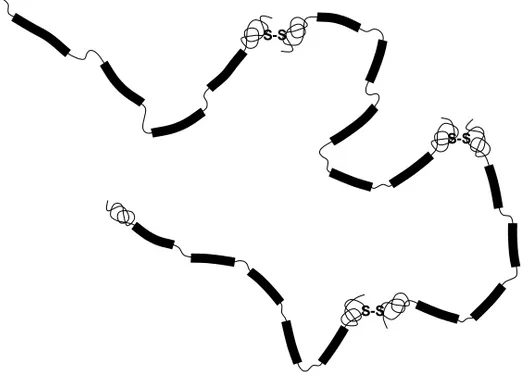
The carbohydrate weight fraction is substantial and values between 68 and 81% by weight have been reported.8, 9 Apart from glycosylated domains, mucins also contain “naked domains” with little or no glycosylation and these domains are typically found in the N-terminal and C-terminal part of the pro-tein and are enriched in cyspro-teine residues. The cyspro-teine residues can form inter-molecular bonds, and in the native state mucins are often found as oligomers composed of several end-to-end linked mucin subunits. Figure 1 presents a model of mucin according to Carlstedt and co-workers.10 This particular mucin has on average four subunits per mucin molecule, and each subunit contains on average four to five glycosylated domains.
Figure 1. A proposed architecture of cervical mucin adopted from Carlstedt and co-workers.10
Black thick lines represent glycosylated domains, thin lines represent non-glycosylated domain and sulphate bonds between subunits are shown as S-S.
S-S
S-S
A common feature of mucins, apart from a high molecular weight and a high carbohydrate content, is the abundance of negatively charged groups. The nega-tive charges arise mainly from sialic acid residues (pKa ≈ 2.6
11
) and in some cases from sulphated sugars (pKa ≈ 1
12
). These acidic groups account for the low isoelectric point of mucins that is estimated to be between 2 and 3.13-15
The glycosylated regions of mucins interact favourably with water and force the molecule to an extended random coil conformation, and the high molecular weight enables individual mucin molecules to overlap and entangle at relatively low concentrations. These characteristics are ideal with respect to the formation of hydrogels and investigations have shown that reconstructed mucous gels from mucins have similar rheological properties as native mucous gels at physiological concentrations.16
Although the ability of mucins to form the struc-tural backbone of the mucous gel is one of its most important functions, other physiological functions have been reported and a more comprehensive review on mucins and their biological functions can be found elsewhere.3, 17
Mucin association in solution
Entanglement is a general feature of polymer solutions and depends on both the molecular weight of the polymer and the concentration of the polymer solution. The concentration at which the individual polymer coils starts to overlap and entangle is referred to as overlap concentration (C*) and above this concentra-tion the viscosity increases rapidly with increasing concentraconcentra-tion. This general type of polymer interaction is also the most important type of interaction that accounts for the viscoelastic properties of concentrated mucin solutions. As mucins are high molecular weight molecules, the overlap concentration is low (2-4 mg/mL18) and thus the mucin molecules in a native mucous gel (approx. 50 mg/mL3) are expected to be highly entangled. Since entanglement is dependent on the molecular size of the molecules, reduction of molecular weight should have a strong influence on the viscoelastic properties of mucin solutions. This has also been demonstrated by showing that a reduction of disulphide links be-tween mucin subunits causes the gel to collapse and form a viscous solution.16
Hydrophobic interactions between the non glycosylated parts of mucin mole-cules may also be important for the gel properties of mucin solutions. For ex-ample, it has been proposed that pig gastric mucin self-assembles through hy-drophobic interactions at low pH.19, 20
Mucin interactions with other mucous gel components
Raynal and co-workers have investigated the gel forming properties of mucin purified from human saliva (MUC5B) and no evidence was found of any spe-cific interactions besides entanglement in aqueous solution.21 Furthermore, since the investigation showed that mucin solutions did not replicate the gel forming properties of saliva, a subsequent investigation was performed to examine the influence of calcium.22 It was evident that calcium had the ability to crosslink mucin into larger aggregates and it was also suggested that the binding was mediated by a protein site.
Trefoil factors is a group of peptides that are co-secreted with mucins in most mucus producing cells in the gastrointestinal tract and their importance for the rheological properties of pig gastric mucin solutions have been investigated.23 It was found that the addition of trefoil peptides could result in a tenfold increase in viscosity of mucin solution. This result demonstrates that these peptides in-teract with mucin and it is likely that they are important for the rheological properties of the native mucous gel.
The association between the separated gel phase of human saliva and IgA, lac-toferrin and lysozyme has been reported, indicating that these proteins bind to salivary mucins.24
The complex formation between human salivary mucin and other salivary proteins has also been investigated, with the conclusion that amy-lase, proline-rich proteins, statherins and histatins could form complexes with mucins.25
Mucin adsorption to solid surfaces
Proteins usually readily adsorb to solid surfaces from aqueous solutions to form a protein film, which is usually mixed with water. Many types of interactions can mediate the adsorption, and among these hydrophobic and electrostatic in-teractions have been identified as central factors determining protein adsorp-tion.26
In addition, structural rearrangements of proteins as well as hydrogen bonding are suggested to influence the adsorption.27 The predictions made for protein adsorption can be applied for mucins as well, but some features of mucins require some special attention. First, the mucin molecule has an amphi-philic character with hydroamphi-philic glycosylated regions as well as regions with no or little glycosylation. It could therefore be advisable to consider the adsorption behaviour of both regions separately. Second, the molecular weights of mucins are generally high, which in turn requires adsorption studies to be performed over long time periods. Low diffusion coefficients also put demands on purity of mucin preparations since low molecular weight impurities may preferentially be adsorbed, at least in the initial phase.
Numerous studies have been devoted to the adsorption of mucins to solid sur-faces, and it is evident that mucins adsorb to most types of surfaces independ-ently of mucin preparation or solution properties. The characteristics of the ad-sorbed layer has been investigated by surface force measurements for different types of mucins adsorbed to different types of surfaces with the conclusion that a long range steric repulsion exists between mucin-coated surfaces.13, 28, 29 Steric forces could be detected at a distance between surfaces of 100 nm or more, in-dicating that mucin segments protrude far into the ambient solution. The mor-phology of adsorbed mucin layers has been examined by transmission electron microscopy and atomic force microscopy with the general conclusion that the adsorbed mucin can be found as fibres with average contour lengths of a few hundred nanometers.5, 30 Thus the morphology of adsorbed mucin seems to re-flect their extended conformation in solution. As indicated from surface force measurements, segments of the mucin molecule extend from the surface, and by considering the amphiphilic character of the mucin molecules it is likely that the non-glycosylated parts of the mucin molecule interact with the surface while glycosylated regions are oriented towards the ambient solution. Thus mucin ad-sorbs in a fashion similar to synthetic poly(ethylene oxide) based block co polymers (PEO-PPO-PEO) and provides steric repulsion with promising
anti-adhesive properties. Their anti-anti-adhesive properties has, for example, been util-ized to suppress cell adhesion to polymeric surfaces.31-33
The influence of surface properties has been investigated with respect to the amount of mucin adsorbed.28, 31, 34, 35 The conclusion is that the adsorbed amount is very dependent on the substrate although no correlation could be found be-tween the hydrophobicity of the surface, as determined by contact angle meas-urements, and the adsorbed amount.31 However, firm attachment of adsorbed mucin on hydrophobic surfaces is indicated as only a very small fraction was removed when rinsing with a mucin free solution.29, 36
The electrolyte concentra-tion and pH of the ambient soluconcentra-tion have also been investigated with respect to adsorption. For electrolyte concentration below 0.1 M a general trend is that the amount increases with increasing electrolyte concentration.14, 15, 35
Also, ef-fects of solution pH has been examined, showing a trend of increasing adsorbed amount with decreasing pH at low ionic strength.14, 15 The dependence of elec-trolyte concentration and pH can be understood by considering electrostatic in-teractions between the surface and the mucin molecules as well as the electro-static interactions between mucin molecules. Accordingly, an increase in elec-trolyte concentration is screening the electrostatic repulsion between the surface and the mucin molecules as well as the electrostatic repulsion between mucin molecules. Similarly, by lowering the pH, the net charge of the mucin molecule decreases.
A final remark is that mucins constitute a diverse group of molecules with dif-ferences in molecular weight, charge density and structure which has also been reflected in the adsorbed amount.14, 35, 37 Furthermore, it should be noted that the preparation procedure may affect the quality of the mucin sample as well as the amount of impurities, which in turn may affect the adsorption behaviour.
Polyelectrolyte multilayers
General
The alternate adsorption of oppositely charged polyelectrolytes was demon-strated by Decher and co-workers who showed that polyelectrolyte multilayers (PEM) with arbitrary thickness can be obtained by simply controlling the num-ber of adsorption cycles.38 It was proposed that the surface charge is reversed during the adsorption and this has later been confirmed by zeta potential meas-urements.39 Figure 2 illustrates the basic principle of how to construct a bilayer on a solid substrate. The surface can either be consecutively dipped in the solu-tions or the ambient solution can be exchanged while keeping the surface fixed. A variation of these assembly procedures is alternate deposition by spraying, which enables a more rapid build-up.40
Figure 2. Illustration of how to construct polyelectrolyte multilayers.
As electrostatic interactions are important for the interaction electrolyte concen-tration, polyelectrolyte charge density and solution pH should influence the build-up and this has also been demonstrated.41-43
Also for overcompensation to occur the combined effect of polyelectrolyte concentration and adsorption time has to be considered in the experimental set-up.41
Few studies have so far re-ported on how substrate properties affect the subsequent build-up.39, 44
In some investigations the solid substrate is used without modification and in other cases the substrate is modified to provide a high surface charge density to facili-tate build-up. For example, chemical modification with amino groups or pread-sorption of poly(ethylene imine) is frequently reported.
1 adsorption cycle / 2 layers
Build-up mechanisms
In initial investigations it was reported that the film thickness increases linearly with the number of adsorption cycles for highly charged polymers.38, 41, 45
How-ever, it was later discovered that many systems that include polypeptides and polysaccharides show an exponential growth with the number of adsorption cycles.46-49
To explain this exponential increase, a growth mechanism was pre-sented in which the polyelectrolytes are able to diffuse into and out from the film during build-up.50 The adsorbing polymer diffuses into the polymer film, which acts as a “reservoir” for the polymer. When the oppositely charged polyelectrolyte adsorbs, the polymer that had diffused into the film diffuses out from the film and form complexes. The existence of such a mechanism has later been verified, showing that one of the polyelectrolytes indeed diffused into and out from the film during build-up.51 Figure 3 presents build-up mechanisms for a system with no diffusion of polyelectrolytes within the film, resulting in a lin-ear increase with the number of layers and a system in which one of the polye-lectrolytes is able to diffuse into and out from the film during build-up, result-ing in an exponential growth.
Figure 3. A linearly growing system (a) and a system where one of the polyelectrolytes is able to diffuse into and out from the film, leading to an exponential growth (b).
Recently a different build-up pattern was reported which is characterized by an alternating increase and decrease during build-up using hyaluronic acid and chi-tosan.49
At a low salt concentration the mass of the film decreased after chito-san addition and increased after hyaluronic acid addition. However, the net
+ + + - - - + + + - - -- - - + + + + + + - - -a) b)
growth with the number of bilayers proved to be linear. To explain this com-plex behaviour, a build-up mechanism similar to the one depicted in figure 3b was suggested. According to this mechanism, chitosan is able to diffuse into the film and when hyaluronic acid is added it interacts with chitosan on the surface of the film and form complexes. In addition, chitosan diffuses out from the film and form other complexes with hyaluronic acid. However, these complexes formed from chitosan diffusing out from the film are considered to be of differ-ent nature and dissolve upon the second addition of chitosan. Even if no expla-nation is given to why complexes formed from chitosan that diffuses out from the film are of a different nature and in what way they differ, this mechanism explains the redissolution as well as the linear growth.
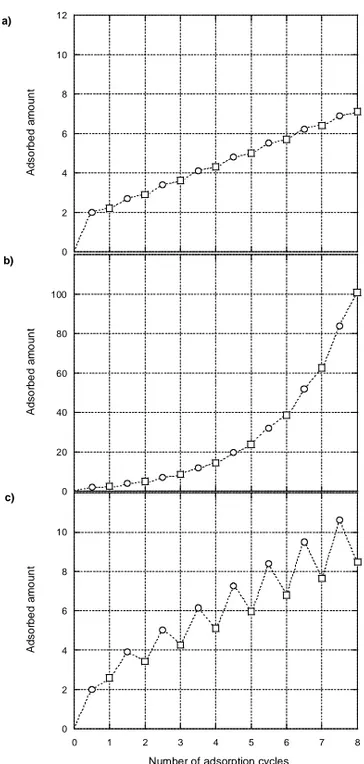
To illustrate different build-up mechanisms, figure 4 presents three theoretical systems, where the film mass versus the number of adsorption cycles is shown. Figure 4a presents a linearly growing system in which the polymers are not able to diffuse during build-up. The increase in adsorbed amount for a system in which one of the polymers is able to diffuse into and out from the film and form complexes is shown in figure 4b. Finally, figure 4c shows the build-up pattern for a system in which one of the polymers diffuses into and out from the film and forms complexes, which are subsequently dissolved.
Proteins in PEM
The incorporation of proteins in multilayered structures is of significant interest in the areas of biotechnology and bioengineering, and multilayers containing proteins have potential applications in for example catalytic processes, the con-struction of biosensors and coating of implants.52
The protein could be embed-ded in a sandwich structure composed of polyelectrolytes, or the net charge of the protein itself could be utilized to build structures in combination with op-positely charged polymers.
Figure 4. Schematic illustration of the build-up of polyelectrolyte multilayers for a non-diffusing system (a), a system in which one of the polyelectrolytes is able to diffuse into and out from the film and form stable complexes at the surface (b) and a system in which one of the polyelectrolytes diffuses into and out from the film, forming complexes that are subsequently dissolved (c).
0 2 4 6 8 10 12 0 1 2 3 4 5 6 7 8 c)
Number of adsorption cycles
A d s o rb ed a m ou nt 0 20 40 60 80 100 120 b) A d s o rb ed a m ou nt 0 2 4 6 8 10 12 a) A d s o rb ed a m ou nt
The stability of proteins in polyelectrolyte multilayers has been examined in several investigations concluding that proteins preserve their structure and that enzymes are active. For instance, it was shown that embedded fibrinogen re-tained its secondary structure and that incorporation protected the protein from aggregation and improved heat stability.53 In addition, heat stability with re-spect to enzyme activity has been investigated using glucose oxidase, and the enzyme was found to have a thermostability higher than that of free enzyme in solution.54
When constructing multilayers containing proteins, the surface is often pre-coated with a few polyelectrolyte layers. The motivation for using these precur-sor layers is to facilitate the subsequent build-up with proteins.55 Also, direct contact between the protein and the solid surface can be avoided, which could reduce structural changes and denaturation of the native protein upon adsorp-tion. The majority of the investigations of proteins in multilayered structures involve proteins in combination with oppositely charged synthetic polymers or polysaccharides, and the reported cases of layer-by-layer build-up using oppo-sitely charged proteins have so far been few, indicating that assembly of pure protein structures is a difficult task.56
Mucins in PEM
In the present investigations we have focused on the multilayer constructions with mucins in combination with cationic polymers or proteins. Bovine sub-maxillary mucin was used in combination with chitosan (paper I) and human MUCB5 mucin was used in combination with cationic proteins present in the native mucous gel (paper II). Although the interfacial properties of mucins have been investigated in numerous studies, only one investigation has so far re-ported on multilayer formation with mucin.57
MATERIALS AND METHODS
Proteins and polymers
Bovine submaxillary mucin from Sigma-Aldrich Co. (M3895, Type I-S) was the most used mucin in the present investigations. The preparation method is de-scribed elsewhere58 and the molecular weight is approximately 0.4 MDa. This preparation has been demonstrated to include other protein components, and purification to remove these impurities resulted in a (mucin) fraction with a molecular weight of 1.6 MDa.30 Bovine serum albumin (BSA) was later identi-fied in the preparation, and fractionation was shown to generate two main mucin fractions with different molecular weights.59
The mucin preparation also contain aggregates60 and a hydrodynamic radius of above 500 nm has been de-termined by dynamic light scattering.61 In paper IV the amount of these aggre-gates in the preparation was estimated to be less than 10 wt % in accordance with a previous report.59
A human mucin purified from saliva, identified as MUC5B, was also used in the investigations (papers I-III), and the preparation of this mucin was done ac-cording to Wickström and co-workers.7 Before use the mucin was dialyzed us-ing a membrane with a molecular weight cut-off of 6-8000 Da as described by Lindh and co-workers.35 Some physiochemical parameters of the mucins are listed in table 1. It is evident that the molecular weights of the mucin prepara-tions are very different and this difference is also reflected by the hydrodynamic radius. The difference could be explained by different molecular weights of the mucins in their native states, and this may also be a result of differences in preparation of the samples. Both mucins appear to have the same content of sialic acid, with values in the range of 9–17 wt %. The aliphatic index is a measure of the hydrophobic character of a protein and is defined as the relative
volume occupied by aliphatic side chains.62
This parameter, which could be of interest for predicting the interactions with other molecules or surfaces, was es-timated for both bovine submaxillary mucin and MUC5B mucin. The terminal non-glycosylated regions were identified in the protein sequence (The Swiss In-stitute of Bioinformatics, Swiss-Prot) and the aliphatic index of these regions was found to vary between 50 and 65, depending on the mucin and the non-glycosylated part considered.
Table 1. Molecular weight, hydrodynamic radius and sialic acid (N-Acetylneuraminic acid) content of Bovine Submaxillary Mucin from Sigma-Aldrich Co. and human MUC5B mucin. Molecular weight (MDa) Hydrodynamic radius (nm) Sialic acid content (wt %) BSM 1.6, 2.9a 44b 9–17 wt %c MUC5B 13.521 8621 14 wt %9 a) Purified fractions30, 59
b) Dissolved mucin aggregates by sodium dodecyl sulphate61
c) Specified content
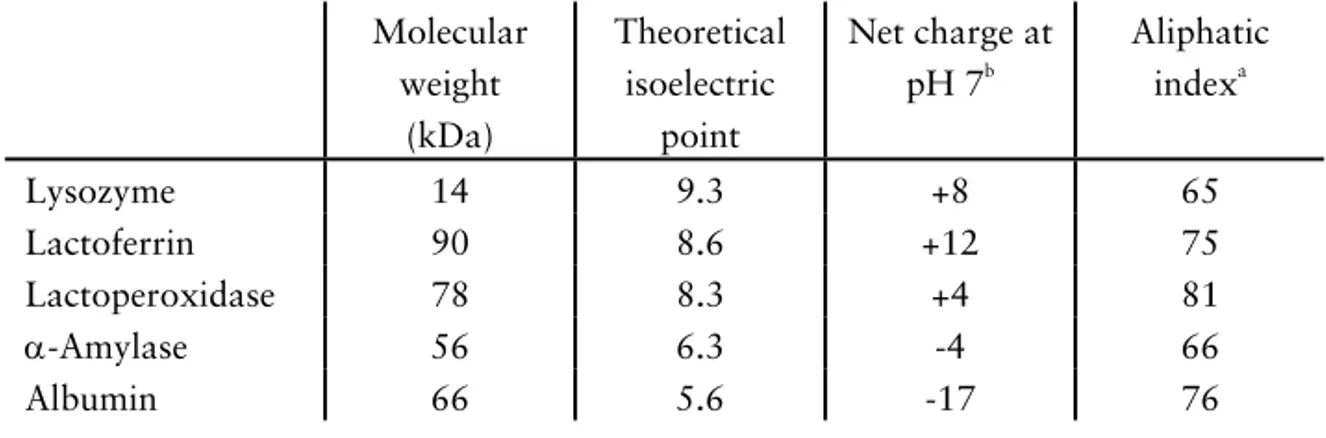
The other proteins used in the investigations were lysozyme (L6876, from chicken egg white, 95% pure), lactoferrin (L0520, from human milk, 98% pure), lactoperoxidase (L8257, from bovine milk, 86% pure), α-amylase (10092, from human saliva ≥95% pure) and albumin (A8531, from bovine se-rum). These proteins were obtained from Sigma-Aldrich Co. and some relevant physiochemical properties of these proteins are summarized in table 2. Note that isoelectric points, net charges and aliphatic indexes are theoretical values calculated on the basis of the protein backbone and thus they do not always agree with the properties of the native proteins.
Table 2. Selected physiochemical parameters of lysozyme, lactoferrin, lactoperoxidase, α-amylase and albumin. Molecular weights are approximate values obtained from Sigma-Aldrich Co. or taken from literature. Values of the isoelectric points, net charges and aliphatic indexes are theoretical values calculated from the amino acid sequence, obtained from the Swiss-Prot database provided by The Swiss institute of Bioinformat-ics. Molecular weight (kDa) Theoretical isoelectric point Net charge at pH 7b Aliphatic indexa Lysozyme 14 9.3 +8 65 Lactoferrin 90 8.6 +12 75 Lactoperoxidase 78 8.3 +4 81 α-Amylase 56 6.3 -4 66 Albumin 66 5.6 -17 76
a) Aliphatic index of a protein is defined as the relative volume occupied by aliphatic side chains.62
b) Calculated as the difference between the number of positively charged amino acid residues (ly-sine and arginine) and the number of negatively charged amino acid residues (aspartic acid and glutamic acid)
Chitosan used in paper I was obtained from Fluka Production (22741) with a specified molecular weight of 150 kDa and a degree of acetylation of 15.5%. In paper V chitosan from Fluka BioChemika (50494, low-viscous) was used. The degree of acetylation of this product was determined to 19% from titrimetric analysis of the amino groups as described elsewhere.63
Surfaces
Silica surfaces with an oxide layer thickness of approximately 30 nm were pre-pared by heating silicon slides (Okmetic OY, Espoo, Finland) in an oxygen at-mosphere as described in reference 64. These surfaces were cleaned at low pres-sure in a glow discharge plasma cleaner for 5 minutes (PDC -32 G, Harrick Sci-entific Corporation, New York, USA). Plasma cleaning was followed by gentle boiling in an alkaline solution for 5 minutes, rinsing three times in water, and gentle boiling in an acidic solution for 5 minutes. The components of the first solution were NH3 (25%), H2O2 (30%) and water (1:1:5 by volume), and the
second solution was composed of HCl (37%), H2O2 (30%) and water (1:1:5 by
volume). Finally, the surfaces were rinsed in water three times and then in etha-nol (96%) twice. The cleaned surfaces were stored in ethaetha-nol. Before ellip-sometric measurements the cleaned silica surface was rinsed in water, dried in nitrogen, and subjected to plasma cleaning for 5 minutes and immediately transferred to the cuvette for ellipsometric measurements. Hydrophobized silica surfaces were prepared from surfaces cleaned as described above by rinsing in trichloroethylene twice followed by immersion in a solution of trichloroethyl-ene containing 0.05 vol. % dichlorodimethylsilane for one hour. The surfaces were subsequently rinsed three times in trichloroethylene and three times in ethanol and stored in ethanol. The hydrophobized surfaces were rinsed in etha-nol, followed by rinsing in water and then dried in nitrogen directly before el-lipsometric measurements.
Silica surfaces and hydrophobized silica surfaces have been characterized by contact angle measurements and electroosmosis.65 The contact angle for silica was reported to be less than 10º and the advancing and receding angles for hy-drophobized silica surfaces was reported to be 95º and 88º respectively. The zeta potential was reported to -45 mV for both silica and hydrophobized silica determined by electroosmosis in 1 mM NaCl at pH 7.0.
Gold surfaces were manufactured at the Laboratory of Applied Physics, Linköping University, Sweden using a Balzers UMS 500 P system by electron-beam deposition of 200 nm of gold onto silicon wafers, precoated with a 2.5 nm-thick titanium adhesion layer. Prior to each experiment, the gold surface was cleaned electrochemically in 0.5 M H2SO4 by means of cyclic voltammetry.
By this procedure it was possible to determine the electrode surface area for subsequent electrochemical measurements.
Ellipsometry
Introduction
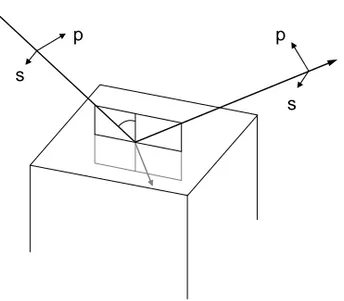
Ellipsometry is an optical technique based on the detection of changes in po-larization of light upon reflection at the interface between media with different refractive indices. Light with its electric vector parallel to the plane of incidence (p-direction) is reflected with a change in amplitude and phase that is different from light with its electric vector parallel to the surface (s-direction). The differ-ences in reflection will usually result in a change in the ellipticity of the light, which gives the technique its name. The measurements are non-destructive and suitable for characterization of optical properties of surfaces and thin films, with thicknesses ranging from a few ångströms up to about one micrometer. Figure 5 illustrates reflection and refraction for incident light at an interface, with the p and s-directions indicated.
Figure 5. Reflection and refraction at an interface. Electric waves polarized in the plane of incidence (p) and waves polarized in the plane of the surface (s) are indicated with arrows in the figure.
p s
p
In biology and surface chemistry, ellipsometry is commonly used to characterize films formed by adsorbing proteins, polymers or surfactants from aqueous solu-tions. A film is usually then formed containing both the adsorbed molecules and the solvent. Such a film can be characterized in terms of thickness and re-fractive index, where the rere-fractive index depends on the concentration of the adsorbed molecules. If the solid substrate and the wavelength are chosen with care, both the thickness and the refractive index can be determined from ellip-sometric measurements, and from these two parameters the mass of the film can be calculated with high accuracy and precision.
Theory
To understand how the polarization of light changes upon reflection, it is essen-tial to decompose the incident light into light oscillating parallel to the plane of incidence (p-direction) and light oscillating parallel to the surface (s-direction, perpendicular to the plane of incidence). From an optical model of the surface, complex reflection coefficients are calculated in both directions (rp and rs), and
the complex ratio of these coefficients contains information about changes in amplitude and phase shift upon reflection (Equation 1). The absolute value (tan Ψ) gives the changes in amplitude ratio and the argument (∆) gives the phase shift between the p and s components upon reflection.
The calculation of the complex reflection coefficients (Fresnel coefficients) of light oscillating in the plane of incidence, and in the plane of the surface as well as combined reflection coefficients for an optical model that contains more than one interface, is given in appendix.66 A useful way to present how the phase shift and the amplitude ratio vary with changes in an optical model, is to con-struct Ψ-∆ plots. These plots are usually concon-structed by calculating Ψ and ∆ values for films with different thicknesses and refractive indices.
) . ( ) tan( e Eq1 r r i s p =
ρ
= Ψ ∆(a)
(b)
Figure 6. Ψ-∆ plot for films on silicon with an oxide layer. The wavelength is 442.9 nm, the refractive index of the ambient is 1.341 (water) and the angle of incidence is 67.83º. The refractive index of silicon is 4.753 – 0.16i and the thickness and refractive index of the silicon oxide layer are 31 nm and 1.466 respectively. O indicates the starting point (zero thickness). Figure a shows Ψ and ∆ values for films with thicknesses below 250 nm and plot b gives a more detailed view of Ψ and ∆ values for thin films. Values of refractive indices are taken from the literature.67
135 135.5 136 136.5 137 137.5 138 138.5 139 15 15.1 15.2 15.3 15.4 15.5 15.6 15.7 15.8 15.9 16 Delta Ps i o x x x x n = 1.40 o x x x x n = 1.45 o x x x n = 1.50
Distance between marks (x) = 1 nm
120 140 160 180 200 220 240 10 15 20 25 30 35 40 45 Delta Ps i o x x x xx xx x x x x x x x x x x x x x x x x x x n = 1.40 x x x x x x x x x x x x x x x x x x x x x x x x x n = 1.45 x x x x x x x x x x x x x x x x x x x x x x x x x n = 1.50
Figure 6 presents Ψ-∆ plots for films on an oxidized silicon surface, which is the most used type of surface in the present investigations. Parameters in the optical model are chosen to match the experimental conditions used in our investiga-tions, and Ψ and ∆ values are given for films with different refractive indices (1.40, 1.45 and 1.50) with increasing thicknesses. It can be concluded from the figure that thickness and refractive index can be resolved independently since Ψ and ∆ values for films with different refractive indices do not overlap. The pe-riodicity of the system is the film thickness which gives Ψ and ∆ values equal to that of a film with zero thickness (bare surface). These values were calculated to vary between 260 nm (n=1.50) and 340 nm (n=1.40).
Experimental set-up
Figure 7 illustrates a typical experimental set-up for null ellipsometry. The light beam passes from the light source through a polarizer and a compensator be-fore it is reflected on a sample surface. If the measurement is performed in a liquid environment the light beam also has to pass the walls of the cuvette and the liquid surrounding the sample surface. After reflection, the light passes through a second polarizer (analyzer) and the light intensity is finally detected by a photo detector. This order of optical components is referred to as a PCSA arrangement.
The polarizer is transmitting light in one direction and the compensator induces a relative phase shift of a quarter of a wavelength between light travelling par-allel and perpendicular to its fast axis. In null ellipsometry the orientation of the fast axis is set to +/- 45 degrees relative to the plane of incidence. This will generally result in elliptically polarized light. The plane of transmission of the polarizer is set so that the elliptically polarized light becomes plane polarized after reflection at the sample surface. The plane polarized light can now be ex-tinguished by setting the plane of transmission of the analyzer perpendicular to the plane polarized light. This results in a minimum light intensity and the method is thus referred to as null ellipsometry. The output parameters from null ellipsometry are the angular settings of the polarizer and analyzer resulting in extinction, which are used to determine the change in phase (∆) and ampli-tude ratio (tan Ψ) upon reflection.
Figure 7. Null ellipsometry set-up (PCSA arrangement)
Determination of Ψ and ∆ values from the settings of the polarizer and
analyzer
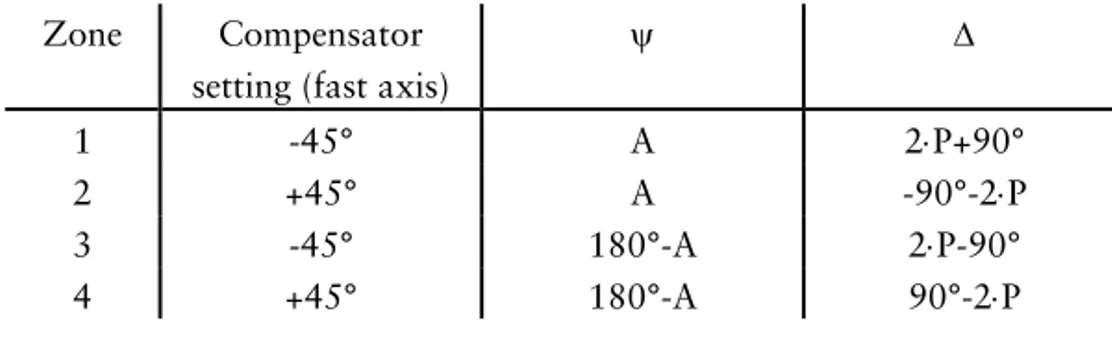
In null ellipsometry the optical properties (Ψ and ∆ values) of a substrate can be obtained from the nulling settings of the polarizer and analyzer. The phase shift (∆) is determined from the setting of the polarizer while changes in amplitude ratio (Ψ) can be determined from the setting of the analyzer. If the fast axis of the compensator is located at -45°, two sets of polarizer and analyzer settings can be found that gives a minimum in light intensity, and similarly two differ-ent pairs of polarizer and analyzer values can be found with the fast axis lo-cated at +45°. These settings represent different “zones” and the calculation of Ψ and ∆ values in the different zones are presented in table 3. Even though measurements and characterization of the substrate can be done in only one zone in theory, measurements are often performed in two or four zones to re-duce errors that originate from instrumental imperfections.
α0 Light source Polarizer Compensator Analyzer (second polarizer) Light detector
Sample cell and surface
Table 3. Calculation of Ψ and ∆ values from the analyzer (A) and polarizer (P) settings in different zones.68
Calculating surface properties from Ψ and ∆ values
In a two phase model the substrate and the ambient constitutes the two phases, and from the ellipsometric parameters (Ψ and ∆ ) the complex refractive index can be calculated analytically. The Fresnel coefficients are inserted in equation 1, and equation 2 gives the resulting analytical solution for the complex refrac-tive index of the substrate (n1).
69
The input parameters are the refractive index of the ambient medium (n0), angle of incidence (α0) and the experimentally
ob-tained Ψ and ∆ values (ρ = tan(Ψ)ei∆).
In a three phase model a plane parallel and homogenous film with a certain thickness and refractive index is present between the ambient and the substrate. In this case, no analytical expression can be derived, and an iterative procedure has to be performed to obtain the thickness and refractive index of the film from the Ψ and ∆ values.69 In this procedure refractive indices of the transpar-ent film are assumed and the correct values are obtained when a real value of the thickness is found.
Zone Compensator setting (fast axis)
ψ ∆ 1 -45° A 2⋅P+90° 2 +45° A -90°-2⋅P 3 -45° 180°-A 2⋅P-90° 4 +45° 180°-A 90°-2⋅P ) . ( sin ) ( ) tan( Eq 2 1 4 1 n n 2 0 2 0 0 1 ⎟⎟ ⎠ ⎞ ⎜⎜ ⎝ ⎛ + − =
α
ρ
ρ
α
Mass calculations and water content
The refractive index is frequently related to the concentration by the Lorentz-Lorenz equation, where the refractive index depends on the molar refraction and concentration of all components.70 A more simple method, based on the empirical observation of how the refractive index varies with concentration, is to assume that the refractive index increases linearly with the concentration.71
For a system containing two components (solvent and dissolved molecules) the refractive index can be calculated from the refractive index of the solvent (ns),
the refractive index increment (dn/dc) and the concentration of the dissolved molecules (c) according to equation 3. The amount of molecules in an adsorbed layer (Γ) can subsequently be calculated by multiplying the expression for the concentration with the ellipsometric thickness as shown in equation 4. To fa-cilitate the calculations of the adsorbed amount, the refractive index of the sol-vent (ns) can normally be approximated by the refractive index of the ambient
solution (n0).
In ellipsometric measurements the adsorbed amount can be determined more accurately than the thickness and refractive index since an overestimation of the thickness will result in an underestimation of the refractive index and vice versa. It can be seen in equation 4 that reverse co-variations in thickness and refractive index will in part be cancelled out in the calculation of the adsorbed amount. The limited accuracy and precision in thickness is more pronounced at a low surface coverage, and below a surface coverage of 0.5 mg/m2 the thick-ness data is generally unreliable at the experimental conditions used in the pre-sent investigations.72 ) . (Eq 3 c dc dn n n s ⎟⋅ ⎠ ⎞ ⎜ ⎝ ⎛ + = ) . (Eq 4 d dc dn n n s⋅ ⎟ ⎠ ⎞ ⎜ ⎝ ⎛ − = Γ
The mean water content of the film is a useful parameter, which can be calcu-lated directly from the ellipsometric thickness and the adsorbed amount accord-ing to equation 5.
Instrument set-up
The instrument used throughout the investigations was a Rudolph thin-film el-lipsometer (type 43603-200E, Rudolph Research, Fairfield NJ, USA) and the experimental set-up was based on null ellipsometry as illustrated in figure 7. The automatization was done according to the concept of Cuypers66, improved by Landgren and Jönsson, which enables a time resolution of a few seconds.73 A xenon arc lamp was used as a light source, and light was detected at 442.9 nm using an interference filter with UV and infrared blocking (Melles Griot, Neth-erlands). The 5 mL trapezoid cuvettes made of optical glass (Hellma, Germany) was thermostated and equipped with a magnetic stirrer.
Evaluation
When oxidized silicon surfaces were used as substrate, an optical model com-posed of two layers had to be assumed in the evaluation of its properties. The unknown parameters in this optical model were the complex refractive index of the silicon and the refractive index and thickness of the oxide layer (the silicon oxide layer is assumed to be transparent). In order to determine these optical constants, both air and aqueous phase were used as ambient media in the char-acterization.73 For the gold surfaces a one layer model was assumed and the bare surface was characterized in the relevant liquid media.
(
)
(
)
water of density molecules adsorbed the of volume specific V 5 Eq V d V d wt content Water w sp w sp w sp = = ⋅ Γ − + Γ ⋅ Γ − =ρ
ρ
ρ
) . ( %) (After determination of the optical properties of the bare surface, the properties of the adsorbed film were monitored in situ with the assumption that the mole-cules formed a homogenous layer. The Ψ and ∆ values were determined from the readings of the polarizer and analyzer, and the thickness and refractive in-dex of the film were calculated as well as the adsorbed amount. To reduce sys-tematic errors, two zone measurements were conducted in the characterization of the substrates, and the derived correction factors for Ψ and ∆ were used in the determination of the properties of the adsorbed layers.
Particle electrophoresis
Charged particles in a solution will migrate if an electric field is applied across the dispersion, and from their electrophoretic mobility, the zeta potential (ζ) can be calculated. By definition the zeta potential is the potential in the slip plane between the stationary solution and the moving particle with adherent liquid. In the general case, the exact position of the slip plane is not known, but it is expected to be in the order of a few molecular diameters for particles with a sharp boundary towards the liquid.74
In particle electrophoretic measurements, the electrophoretic mobility (u) is de-termined by dividing the velocity of the particles by the electric field and the zeta potential can then be calculated from the Hückel or Smoluchowski equa-tion (equaequa-tions 6 and 7).74 Apart from the electrophoretic mobility (u) the vis-cosity of the solution (η), the permittivity of vacuum (ε0) and the relative
dielec-tric permittivity (εr) are used in the calculations. The choice of equation depends
on the radius of the particles (R) and the screening length of the ambient solu-tion (κ-1).
As it has been shown that the zeta potential depends on the electrolyte concen-tration, type of counter ion, pH and temperature, it is important to work with well defined systems for comparative studies.75 Complications also arise when non-spherical particles are studied and thus comparisons of absolute values of zeta potentials in the literature are often problematic.27 However, zeta potential measurements are well suited to follow relative changes in electrophoretic mo-bility when, for example, polymers or proteins adsorb at the surface of parti-cles. ) . (Eq 6 equation ckel ü H 1 R u 2 3 r o << ⋅ =
κ
ε
ε
η
ζ
) . (Eq7 equation ki Smoluchows 1 R u r o >> =κ
ε
ε
η
ζ
Atomic force microscopy
Atomic force microscopy (AFM) is a useful technique that is used for charac-terization of surface morphology and colloidal forces between particles and sur-faces.76 In imaging mode AFM, topographic images are usually obtained and useful parameters such as surface roughness and size distributions of, for ex-ample, adsorbed particles can be determined. The resolution is dependent on the nature of the sample, and as a general rule softer material gives a lower resolution. For adsorbed proteins and polymers the resolution is a few nanome-ters at ideal conditions, and this enables individual proteins to be visualized. In addition, information can sometimes be obtained about the tertiary structure of globular proteins and contour lengths of random coil proteins.
Topography images are obtained by using a cantilever with a very sharp tip to scan the surface. The force between the tip and the sample causes the cantilever to bend, and the bending is monitored by a laser beam reflected on the surface of the cantilever. In contact mode the force/bending of the cantilever is usually kept constant while scanning the surface. The constant force between the sam-ple and the tip of the cantilever is achieved by shifting the vertical position of the sample, and the resulting topographic image is obtained from the height signal. The main advantages using AFM is that high resolution images can be obtained and that pre-treatment of the sample surface is not required. Also measurement can be conducted in situ in air or liquid at ambient temperatures. Disadvantages using this technique are that soft structures are not easily visual-ized and that scanning may distort the structures on the surface so that the to-pographic images do not reflect true conformations. However, direct contact between the sample and the tip can in some cases be avoided by taking advan-tage of electrostatic repulsions.77
In the present investigations we determined the topography by contact mode AFM in liquid, and we strived to use a minimum force between the tip and the sample surface in order to minimize distortion of the loosely bound soft protein structures during scanning. Cantilevers with spring constants of less than 0.3 N/m and cantilever tips made of silicon nitride were used. The instrument em-ployed was a scanning probe microscope from Veeco (Picoforce multimode SPM with a Nanoscope IV control unit).
Electrochemistry
The enzymatic activity of surface bound lactoperoxidase (LPO) was evaluated by measuring the current obtained by electrochemical reduction of catechol, which was used as a mediator in the enzymatic process. Activity measurements were generally carried out through the following sequence of experimental pro-cedures: Lactoperoxidase was adsorbed on a gold surface or on a gold surface with preadsorbed mucin or albumin while monitoring the adsorption process by ellipsometry. After adsorption and rinsing, the surface was transferred to an electrochemical cell and connected as a working electrode to a potentiostat (ZPta Elektronik, Höör, Sweden). A silver wire served as a combined reference and counter electrode. The cell was filled with a buffered solution and after that a -50 mV potential was applied to the working electrode. 100 µM of catechol and up to 50 µM of hydrogen peroxide were added to the cell to start the en-zymatic reaction, and the process was followed by measuring the resulting elec-trode current. In both ellipsometric and electrochemical measurements a 10 mM phosphate buffer was used (pH 7.0), containing 100 mM NaCl and 1 mM CaCl2.
A simplified reaction sequence of the enzymatic and electrochemical process is summarized below.
LPO(Fe3+) + H2O2 → LPO(Fe 5+
) + H2O
LPO(Fe5+) + catechol → LPO(Fe3+) + o-quinone + H2O
o-quinone + 2e -(Au) + 2H+ → catechol H2O2 + 2e -(Au) + 2H+ → 2H2O LPO(Fe3+ ) and LPO(Fe5+
) represent native and 2-electron oxidized lactoperoxi-dase respectively. 2e
-(Au) represents two electrons at the gold electrode. From the reaction scheme above, it is clear that the rate of the catalytic process can be determined from the electrochemical reduction rate of o-quinone at the gold surface, measured as a current.
Enzyme activity is by definition equal to the amount of substrate converted per unit time. One international unit (U) equals 1 µmol of substrate converted per minute. If the activity unit (U) is related to the amount of the enzyme, the spe-cific activity is obtained expressed as U/mg. According to the reaction scheme it
can be concluded that the conversion of one mole of hydrogen peroxide re-quires 2 moles of electrons. Thus, the rate of enzymatic reduction of hydrogen peroxide can easily be related to the current of the lactoperoxidase modified electrode expressed in the equation 8.
(imax) is the electric current and F is the Faraday constant (C/mol). The amount
of enzyme per unit area (Γ in mg/m2
) from ellipsometric measurements can be multiplied by the real surface area (A in m2
) of the electrode to obtain the total amount of enzyme, which is needed to calculate the specific activity (U/mg) as exemplified in equation 9.
It should be pointed out that we must assume that the maximum current (imax)
at these electrodes is not limited by the diffusion of reaction substrates (H2O2,
catechol, and o-quinone). This assumption is valid since the experimentally measured current was at least 10 times lower than what could be expected from diffusion limited processes involving H2O2, catechol, or o-quinone.
) . ( ) ( ) / ( max Eq 8 F 2 A i s mol O H of rate tion Reduc 2 2 ⋅ =
µ
µ
) . ( ) ( ) / ( max 9 Eq A F 2 60 A i mg U activity LPO Specific ⋅ Γ ⋅ ⋅ ⋅ =µ
RESULTS AND DISCUSSION
Layer-by-layer film formation with mucin
Papers I and II describe the build-up of multilayers containing mucin and oppo-sitely charged polymers or proteins. The first paper includes layer-by-layer as-sembly of bovine submaxillary mucin (BSM) and chitosan, and the second pa-per includes a human mucin purified from saliva (MUC5B) in combination with cationic proteins naturally present in the mucous gel. In addition to this α-amylase was used as a control protein. Also included is a part that describes ac-tivity of lactoperoxidase adsorbed on gold surfaces precoated with mucin and albumin (paper III).
Mucin (BSM) and chitosan (paper I)
In paper I, bovine submaxillary mucin (BSM) was used in combination with chitosan. Assembly was done in an aqueous 0.1 vol % acetic acid solution to ensure that chitosan was in its protonated and soluble form. The build-up was investigated on silica and hydrophobized silica as model surfaces and figure 8 illustrates the results. On silica, the amount of mucin after rinsing was low in comparison with the values found in other studies.35, 57 However, this difference can be explained by the absence of added salt resulting in essentially unscreened electrostatic repulsions between the silica surface and mucin, as discussed in the introduction. Upon the first addition of chitosan the adsorbed amount in-creased, but the build-up with the number of adsorption cycles was limited and after 8 adsorption cycles the amount was found to be less than 0.4 mg/m2
. On hydrophobized silica, the amount of mucin after rinsing was found to be much higher than on silica and in agreement with other investigations.28, 35 The
subse-quent addition of chitosan and rinsing did not significantly change the total sorbed amount and in fact a small decrease was detected. The following ad-sorption was characterized by an alternating increase upon mucin addition and a decrease upon chitosan addition. However, the net result showed that the ad-sorbed amount increased approximately linearly with the number of adsorption cycles, and after 8 adsorption cycles the amount was found to be about 6 mg/m2
. The increase in thickness with the number of adsorption cycles is illus-trated in figure 9, and as for the adsorbed amount the increase in thickness was found to be approximately linear.
Figure 8. Adsorbed amount on silica (a) and hydrophobized silica (b) versus the number of adsorption cycles, (mucin (BSM) - chitosan) x 8. The build-up was monitored in 0.1 vol % acetic acid and the mucin and chitosan concentration was 0.1 mg/mL. Values af-ter mucin addition and rinsing ({) and chitosan addition and rinsing () are presented. Note the different scales on the y-axes.
The results clearly show that while the build-up was limited on silica a linear build-up with the number of adsorption cycles was possible on hydrophobized silica. From this result it may be concluded that the amount of mucin in the first step is crucial for the subsequent build-up. Hydrophobization is thus an attractive approach to facilitate the subsequent build-up when working with mucins or other amphiphilic molecules that show limited adsorption to hydro-philic substrates. 0 0.1 0.2 0.3 0.4 0.5 0 1 2 3 4 5 6 7 8 Ad s o rb ed am ou nt ( m g /m 2)
Number of adsorption cycles Silica a) 0 2 4 6 8 10 0 1 2 3 4 5 6 7 8 A d s o rb ed am o u n t (m g /m 2)
Number of adsorption cycles Hydrophobized silica
To illustrate the build-up kinetics, figure 9 shows adsorbed amount, thickness and refractive index versus time. From this figure it can be seen that the first addition of mucin led to a relatively slow increase in the adsorbed amount. The subsequent addition of chitosan caused a small decrease in the adsorbed amount whereas the thickness increased. After the second addition of mucin, a rapid increase was detected in adsorbed amount, accompanied by an increase in thickness. The second addition of chitosan led to gradual decrease in the ad-sorbed amount, while the thickness remained essentially constant.
The subsequent adsorption cycles were similar to the second adsorption cycle in the way that we detect a rapid increase in adsorbed amount upon the addition of mucin, and a gradual decrease upon the addition of chitosan. The thickness increases rapidly upon all additions of mucin, whereas from the third addition of chitosan and on a gradual and pronounced decrease in thickness was de-tected. It can also be noted the refractive index of the film decreases after all additions of chitosan.
A more detailed investigation of the kinetic curves reveals that, from the fourth addition of mucin and on, the initial rapid increase was followed by a slow de-crease in adsorbed amount. Also, from the fifth addition of chitosan and on, a small increase could be detected before the decrease in adsorbed amount and thickness. An observed initial increase followed by a decrease in adsorbed amount has been reported previously.49, 78 This phenomena, often referred to as overshoot, can be explained by the fact that the polymer fist adsorbs to the sur-face of the film, but complexes formed between the two polymers in the film are in a later stage dissolved and diffuse out from the film.
The complex build-up pattern of adsorption followed by redissolution can be explained by the build-up mechanism proposed by Richert and co-workers de-scribed in indtroduction.49 Accordingly, chitosan is assumed to be able to dif-fuse into and out from the film and form loosely bound complexes that are sub-sequently dissolved. The proposed mechanism will result in a linear growth with the number of adsorption cycles indicating that this mechanism may be valid for the build-up in the present investigation. By comparing our results (figure 8b) with the theoretical behaviour of such a system (figure 4c) it is evi-dent that they indeed have similar features.
Figure 9. Adsorbed amount, thickness and refractive index versus time for layer-by-layer build-up on hydrophobized silica, (mucin (BSM) - chitosan) x 8. The mucin and chito-san concentration was 0.1 mg/mL. M indicates mucin addition and C indicates chitochito-san addition. 1.34 1.35 1.36 1.37 1.38 1.39 0 80 160 240 320 400 480 560 640 R e fr a c ti ve i n d e x Time (min) M M M M M M M M C C C C C C C C 0 20 40 60 80 100 Th ic kn e s s ( n m ) C C C C C C C C M M M M M M M M 0 5 10 15 20 0 1 2 3 4 5 6 7 8 A d s o rb e d a m ou nt ( m g /m 2)
Number of adsorption cycles
M M M M M M M M C C C C C C C C
However, for a deeper understanding of the redissolution process, it is of inter-est to consider the stability of polyelectrolyte coacervates (polyelectrolyte com-plexes) formed in aqueous solution, from a thermodynamic point of view. Fig-ure 10 presents a stability diagram proposed for polyelectrolytes in solution, where the ratio between the polyelectrolytes and the ionic strength is taken into account.78 From the figure it is evident that the most stable coacervates (shaded area) are formed at equal amounts of polyelectrolytes at low ionic strength, and that the coacervates dissolve in excess of one of the polyelectrolytes. During the construction of polyelectrolyte multilayers, the overall composition is normally alternating between a high mole fraction of the cationic polymer and a high mole fraction of the anionic polymer. This is also the case for our system and thus the desorption seen in figure 9 can be explained by the stability diagram. It should be kept in mind, however, that the stability diagram is used to explain the adsorption behaviour of polyelectrolytes in solution, and thus it may not be valid for the part of the film that is directly associated with the surface. In addi-tion, the presented stability diagram, with its symmetric shape of the stability region, is an idealized description that is most appropriate to describe systems that includes similar polyelectrolytes with equal (and opposite) charge densities.
Figure 10. Schematic representation of the stability of coacervates redrawn from refer-ence 78. The horizontal axis represents the mole fraction of the cationic (or anionic) polyelectrolyte and the vertical axis represents the ionic strength. The shaded grey re-gion symbolises the existence of stable coacervates. Arrows represent changes in the sys-tem during layer-by-layer build-up with oppositely charged polyelectrolytes.
0 1 Io n ic st rength → Stable coacervates Polyelectrolyte ratio→
Nevertheless, some questions that cannot be easily explained from the stability diagram remain. First, it is evident that only part of the film is dissolved when chitosan is added, in spite of the fact that the stability diagram suggests that the film would be completely dissolved except for the part of the film that is di-rectly associated with the solid surface. By looking at the adsorption kinetics it is evident that equilibrium was not reached when the cuvette was rinsed after chitosan addition. Therefore the absence of a total redissolution of the film when chitosan is added can be explained by the slow kinetics of polymer sys-tems, especially involving high molecular weight molecules.
It is also evident that redissolution when mucin is added is very limited com-pared to chitosan additions. This difference may not be a surprise considering that these molecules are very different and in relation to the layer-by-layer build-up of polyelectrolytes it is of interest to consider the charge balance. Ac-cordingly, the charge density of chitosan was calculated from the number of amino groups in the molecule and the charge density of mucin was calculated on the basis of the amount of bound sialic acid. The charge density in 0.1 vol. % acetic acid (pH 3.4) was calculated to be 5 mmol/g for chitosan and 0.3 mmol/g for mucin. As the coacervates are dissolved when the charge balance is moving towards the extremes (in figure 10), it is understandable that the highly charged chitosan will cause a rapid redissolution upon addition. In comparison with chitosan the charge density of mucin is much lower and this could be the reason to why redissolution is limited or absent after mucin addition.
To minimize redissolution, we decided to decrease the concentration of chito-san from 0.1 mg/mL to 0.01 mg/mL while keeping the mucin concentration constant. The effect of a lower chitosan concentration on the layer-by-layer build-up with mucin is presented in figure 11, and it was found that redissolu-tion was reduced significantly, increasing the mass of the final film threefold.
Figure 11. Adsorbed amount versus time for layer-by-layer build-up on hydrophobized silica, (mucin (BSM) – chitosan) x 8. The mucin and chitosan concentration were 0.1 mg/mL and 0.01 mg/mL respectively. M indicates mucin addition and C indicates chito-san addition. 0 5 10 15 20 0 80 160 240 320 400 480 560 640 0 1 2 3 4 5 6 7 8 A d s o rb e d a m oun t (m g/m 2) Time (min) C C C C C C C C M M M M M M M M
Mucin (MUC5B) and cationic proteins (paper II)
A human mucin purified from saliva (MUC5B) was used in combination with cationic proteins that are known to be present in the mucous gel and the work is described in paper II. Conditions such as temperature, pH and ionic strength were chosen to resemble in vivo conditions, and as the surface properties was found to have a profound influence on the build-up with mucin (BSM) and chi-tosan (paper I), we investigated the build-up on both silica and hydrophobized silica. Lactoferrin, lactoperoxidase and lysozyme, which are all present in the native mucous gel,4, 6
as well as α-amylase as control, were used in combination with mucin. Two adsorption cycles were performed with these systems in order to study the possibilities to build layer-by-layer structures and the results are presented in figure 12.
Figure 12. Adsorbed amount on silica (a) and hydrophobized silica (b) versus the num-ber of adsorption cycles, (mucin (MUC5B) - cationic proteins) x 2. The mucin and cati-onic protein concentration were 0.05 mg/mL and 0.01mg/mL respectively. Values after protein addition and rinsing are presented.
For comparison it is of interest to determine the net increase of the second ad-sorption cycle for the different protein systems. On silica this increase was simi-lar for the systems that included lactoperoxidase and lysozyme, while a very modest increase was detected for the system that included lactoferrin. On hy-drophobized silica a substantial increase was found for the system that included lactoperoxidase while almost no increase could be detected for the systems that included lactoferrin or lysozyme. For the system that included α-amylase, a
lim-0 2 4 6 8 10 0 0.5 1 1.5 2 Mucin - Lactoferrin Mucin - Lactoperoxidase Mucin - Lysozyme Ad s o rb ed amo u nt ( m g /m 2)
Number of adsorption cycles
b) 0 2 4 6 8 10 0 0.5 1 1.5 2 Mucin - Lactoferrin Mucin - Lactoperoxidase Mucin - Lysozyme Ad s o rb ed amo u nt ( m g /m 2)
Number of adsorption cycles