Physical activity for persons with obesity—a health project reported
Eva A. Andersson, Gi Defaire, Staffan Hultgren, Johnny Nilsson, Kristjan Oddsson, Hedvig Olin, Leif Strand, Lina Wahlgren, Ingemar Wedman and Orjan Ekblom
Eva A. Andersson,lecturer, Department of Neuroscience, Karolinska Institutet Gi Defaire, lecturer, Swedish School of Sport and Health Sciences;
Staffan Hultgren, lecturer; Swedish School of Sport and Health Sciences Johnny Nilsson, lecturer, Swedish School of Sport and Health Sciences; Kristjan Oddsson, lecturer; Swedish School of Sport and Health Sciences Hedvig Olin, assistant; Swedish School of Sport and Health Sciences Leif Strand, lecturer, Swedish School of Sport and Health Sciences; Lina Wahlgren, student; Swedish School of Sport and Health Sciences Ingemar Wedman, Professor; Swedish School of Sport and Health Sciences
Orjan Ekblom, lecturer, Swedish School of Sport and Health Sciences, Unit of Pediatrics, Institution for Clinical Sciences, Intervention and Technology (CLINTEC), Karolinska Institutet.
Abstract
In public health contexts, increased physical activity habits and fitness (aerobic and strength capacities) are positively related for promoting health and preventing and treating common diseases/problems, including obesity and overweight. A strongly graded inverse association between physical activity and obesity has been shown both for adults and children. However, a lower mortality risk has been shown for those with greater weight but good aerobic capacity than for those of recommended weight but less fit. On the basis of a health project with physical activity for persons with or without obesity, the paper discusses evidence-based methods for promoting physical activity. General guidelines for the amount of physical activity for persons are described, as are the numerous physiological and medical advantages of physical activity. The economic benefits are also illustrated. The paper exemplifies methods of measuring physical activity habits and physical fitness. These two factors must be observed when showing improvements in public-health contexts, including groups with obesity.
Introduction
Increased physical activity habits and fitness (aerobic and strength capacities) are positively- related factors for promoting health and preventing and treating diseases / problems, including metabolic and cardiovascular diseases, several cancers, psychological and musculoskeletal problems/diseases, and obesity and overweight (Astrand 1997, Bouchard 2000, Pedersen and Saltin 2006, Abadie 2007, Wilmore, et al. 2008). Recently updated physical activity guidelines (ACSM 2007, Nelson, et al. 2007) state: “The preventive recommendation specifies how adults, by engaging in regular physical activity, can promote and maintain health, and reduce risk of chronic disease and premature death.” Hence, the task at hand is to identify attractive and effective forms of physical activity intervention.
A strongly graded inverse association between physical activity and obesity has been shown both for adults (Bouchard 2000, Hemmingsson and Ekelund 2007) and for children (Ness, et al. 2007). If advice and counseling concerning physical activity are given in everyday clinical practice, especially if repeated, the habits will increase, according to a Swedish report in which results from several international investigations are systematically reviewed regarding “Methods of Promoting Physical Activity“ (Board of Directors and the Scientific Advisory Committee, SBU 2006). That scientific report also presents several other evidence-based methods which have shown improved physical activity habits. These include written prescriptions of physical activity, diaries, step-counters, information folders, supervised exercise in groups and individualized programs (the two latter discussed for persons with coronary and peripheral arterial diseases), organized training programs; theory-based behavioral interventions, and studies including the whole life-style: physical activity, diet and stress management. School-based interventions with methods for children and adolescents are also described in the report. These have several components (teacher training, curriculum modifications, additional physical activity sessions within and outside the ordinary school timetable, support for behavioral changes, improved health education and parental involvement) which increase physical activity during school hours and sometimes in leisure time. School-based interventions also reportedly increase the physical activity level to some extent for groups with increased risk of cardiovascular disease. Physical activity can be improved with greater school resources, health education, textbooks, study materials and teacher training (Board of Directors and the Scientific Advisory Committee - SBU 2006).
Health effects of regular physical activity
Examples of health effects of regular physical activity are: decreased systolic and diastolic blood pressure, lowered “bad” blood lipids (TG, LDL) and increased “good” (HDL), increased blood vessels in skeletal muscle, increased maximal oxygen uptake, lowered heart rate while resting and during submaximal exertion, lowered activity in the sympathetic nervous system, increased muscle strength, higher bone density, improved balance, increased flexibility, less stress- hormone cortisol, improved sleep, increased well-being, increased endorphins, noradrenalin and serotonins, increased brain-cell production, increased insulin sensibility; also increased non-insulin-dependent glucose uptake, increased enzymes for musculoskeletal metabolism, decreased
blood lactate during exertion, increased ability to use fat in skeletal muscle metabolism, increased endurance, counteraction of overweight, increased firmness and function in joints, lowered perceived effort during work at certain loads, higher tolerance of increased temperature, lowered thrombosis (thrombocyte adhesion), and decreased morbidity/mortality from cardiovascular diseases, type II-diabetes, overweight/obesity, depression, musculoskeletal problems, cancer and osteoporosis (Astrand 1997, 2003, Lee, et al. 1999, Bouchard 2000, Pedersen and Saltin 2006, Abadie 2007, Swedish National Institute of Public Health 2008, Wilmore, et al. 2008).
Cost-effectiveness of promoting physical activity in health care
In a doctoral thesis, 20 of 26 reviewed papers showed a cost-effectiveness effect of promoting physical activity in health care as a complement to regular medical treatment, not as an alternative (Hagberg and Lindblom 2006, Hagberg 2007). Different methods of physical activity were not compared, so no special intervention method can be given priority. Promoting physical activity was so cost-effective that it should become standard treatment for those running a manifestly increased risk of ill health (e.g. high blood pressure, diabetes) due to a physically inactive lifestyle, for those requiring rehabilitation after heart failure and for frail older people, especially those with increased risk of fall injuries. The authors show that “In general, the promotion of physical activity among patients with increased risk or manifest poor health associated with physical inactivity seems to be cost-effective compared to standard care...“The cost of the time spent on exercise appears to be higher among inexperienced exercisers than among their more experienced counterparts....”An important aspect of sustainable increase of physical activity and cost-effectiveness is the ability of the intervention to create enjoyable physical activity. This emphasizes the need for health care to be involved in the design of the performance of physical activity.” (Hagberg and Lindblom 2006, Hagberg 2007)
The present paper reports on the results from a health project with supervised physical activity twice per week for adults with or without obesity. Changes in some physical fitness values and in self-rated health and lifestyle habits such as physical activity were studied.
Methods and Material
The subjects were volunteers, recruited by advertisement or recommended by medical care staff or private companies (cf. below). Sixty-three adults with obesity (BMI>30kg/m2, 48 women and 15 men) and sixty-four adults with the recommended body mass index (<25 kg/m2, 57 women and 7 men) participated. Mean ages for the groups were 54 (22-82) and 57 (22-88) years, respectively.
Mean values for age, weight and BMI among the women with obesity (n: 48) were 54 (range 22-77) years, 94 (67-128) kg and 34 (31-44) kg/m2 and among the men (n: 15) 54 (34-82) years, 112 (77-142) kg and 34 (30-43) kg/m2, at the beginning of the project. Among the persons with the recommended weight (BMI<25 kg/m2) the corresponding values for the women (n: 57) were
57 (22-88) years, 62 (44-78) kg and 23 (18-24,9) kg/m2, and for the men (n: 7) 55 (36-75) years, 72 (63-88) kg and 22 (21-24) kg/m2. All subjects gave informed consent for participation in the health project. For further information regarding the participants, see below.
Health project
The participants performed supervised physical activity twice weekly for 8 to 12 weeks. The activities (each 45-60 minutes) were primarily Nordic walking, strength training and aerobics in a gymnasium or as water exercise at moderate-to-vigorous intensity. The project was part of the regular training of students following the “Public health science, directed towards physical activity” course at the Swedish School of Sport and Health Sciences. The participants were placed in subgroups (generally 10-15 persons), sometimes consisting only of individuals with obesity or only those of recommended weight (BMI < 25 kg/m2), and sometimes of a mixture with varying BMI. The students served as project leaders supervised by teachers/physicians at the school and occasionally also by external tutors. Some of the groups had their supervised physical activity at the Swedish School of Sports and Health Sciences, in central Stockholm, and others in suburbs.
The participants in the project (which was free of charge) registered themselves, or this was done by medical or psychiatric care staff or through private health companies. Information brochures were sent to medical care units in Stockholm before the project periods. Some local
social insurance services also registered long-term sick-listed clients wanting to take part. Several participants had received written prescriptions for physical activity in association with project start. All those in the health project for the first time participated for one semester, either during autumn 2005 or spring 2006. This report covers all those who had BMIs >30 and <25 kg/m2. Some continued for a second semester but the results for this are not included here. Some were healthy but most had disorders such as cardiovascular problems (high blood pressure most frequent), psychological problems, including a few diagnosed depressions; musculoskeletal problems (e.g. back, neck, shoulder and other joint), obesity or diabetes type II. The distribution of listed self-reported diseases/problems was rather similar for these two groups (Table.1). The most frequent disease/problem reported was ”often problems in the back, shoulders and/or
neck”: 53% and 66% of the respondents in the BMI >30 group and BMI <25kg/m2
, group, respectively. The corresponding values for ”joint and/or muscle disease” were 31% and 25%, for ”high blood pressure” 30% and 25%, ”asthma/allergy” 29% and 27%, respectively. Sixty-six percent of those with obesity and 70% of those with BMI<25 kg/m2 reported ”medicines
prescribed for long-term use”. Twenty-three percent of the respondents with obesity and 34% of
those with BMI<25 kg/m2 reported taking soporifics or tranquillizers” (Table 1). Initially the project leaders held an information meeting for the participants. Before and after the training period, a health questionnaire and the physical fitness tests were completed. The health questionnaire, which was generally completed by all subjects, included self-rate questions on physical and psychological health and lifestyle habits such as physical activity, diet, smoking, alcohol, sleep and relaxation. Questions also elicited the informants’ views on hope, meaningfulness, control, happiness and calmness (Table 5). The physical fitness tests varied between individuals depending which tests, if any, were selected by the subgroup project leaders. The physical tests in the present report were a 6-minute walking test, Astrand’s submaximal cycle ergometer test and a strength test for the back muscles (see below).
The participants were interviewed personally regarding their health initially in the project when leader and participant were checking the health questionnaire and during the physical fitness tests. Further discussion of health and physical activity occurred spontaneously during the project between the participants and the project leaders as occasion arose. Some participants kept diaries about their activities and some had step-counters briefly during the project. Several of the
subgroups attended a theoretical lesson about physical activity and/or health with different perspectives.
All 127 individuals (63 in the obesity group and 64 in the recommended-weight group) completed the whole project and performed the tests both initially and at the end of the period. In addition, more people underwent the first test and started the supervised physical activities. However, some dropped out for different reasons, e.g. sickness, the opinion that the project was not right for them or that the training and test occasions did not suit them. Among those listed before the start of the project a good half dropped out, though the exact number is unknown, several not even taking the initial tests. Thus, the present results cover only those in each weight group who completed the whole semester with supervised physical activity and both test occasions with the health questionnaire and some physical fitness tests. Since none or very few of the participants initially presented the recommended physical activity behavior (30 min/day at least at a moderately intense level, see below), the participants had potential to improve towards a healthy lifestyle regarding physical activity during the project.
Health questionnaire
Table 5 below shows the health questionnaire questions and examples of answers as well as the results, with mean values together with possible significant differences for the two groups (BMI>30 and < 25 kg/m2). The majority of the questions are based on previous national and international health questionnaires, such as the IPAQ (IPAQ, 2002) and those used for public health projects (e.g. Ekblom, et al. 2004, Ekblom, et al. 2007). The present results concern perceived health and lifestyle habits such as physical activity, sleep, diet, alcohol and tobacco.
Physical fitness tests
The physical fitness tests performed, if any, varied between individuals depending on which tests were selected by the subgroup project leaders. For this reason, the numbers in each main group (BMI>30 and <25 kg/m2) are lower for the physiological tests than for the questionnaire, which almost all completed.
Walking test. A six-minute walking test was performed on a flat indoor walkway. The
marked every 3 m with tape. Directly after the test the total distance (meters) was registered (Gyatt, et al. 1985, Wilmore, et al. 2008).
Astrand’s cycle ergometer test. A submaximal cycle ergometer test was done according to usage,
and estimated aerobic capacity was expressed in liters/minute. (Astrand and Ryhming 1954, EUROFIT 1993, Eurofit for adults 1995, Astrand, et al. 2003, Ekblom, et al. 2007).
Back strength test. Sorensen´s strength endurance test (unit seconds) for the back muscles was
performed. With the legs on a bench and the ankles externally supported, the upper body was held in a static horizontal position outside the bench, with the upper pelvis (crista iliaca) at the bench edge (Biering-Sorensen 1984, Hultman, et al. 1992). The arms were held crossed over the chest.
Statistics
The health questionnaire answers were analyzed with Wilcoxon’s test since the answer values were based on a ranking scale. For statistical calculations concerning the physiological fitness tests and anthropometric data within each group (BMI>30 and <25 kg/m2) a paired t test was used. For all analyses the value p<0.05 was used.
Results - physical fitness tests
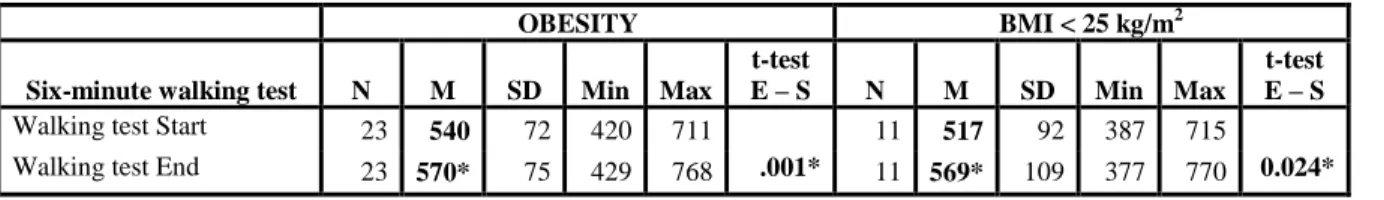
Six-minute walking test. Both weight groups presented here a significant increase (Table
2). The persons with obesity showed initial mean values of 540m and final values at the end of the project period of 570m (n:23). The corresponding distances for the other group (BMI<25 kg/m2) were 517-569m (n: 11). Cycle ergometer test. The submaximal test (aerobic capacity) (Tab. 3) presented a significant increase only for the group of persons with obesity. The mean values increased from 2.30 to 2.53 L/min (n:19). The persons with the recommended weight (BMI<25kg/m2) showed no significant difference (changing from 2.11 to 2.23 l/min, n:17).
Back strength test. This strength endurance test for the back muscles (Tab. 4) showed a
significant increase from the start of the project period to the end for the obesity group (55.5-78.1s, n:19) but not for those with BMI <25 kg/m2 (38.4-53.5s, n:6). Thus, a significant increase was seen in the walking test for both groups. In addition the values from the aerobic test increased significantly and the back muscle test for the tested persons with obesity. The later test
relates to unspecific low-back pain (Biering Sorensen 1984, Hultman, et al. 1992). Interestingly, a smaller risk of cardiovascular death and all changes in mortality has been shown in those with higher weight but good aerobic capacity as compared to those of recommended weight but who are less fit (Lee, et al. 1999). Millions of overweight people suffer from illnesses that could have been prevented if they had engaged in regular physical activity (Bouchard 2000). The present tests are examples of reasonable physical fitness examinations which have been and can further be used in public health contexts.
Health questionnaire
All participants completed the health questionnaire (Tab.5). Both groups (BMI>30 and <25 kg/m2) showed lower mean values for the physical test than for mental (psychological) health, although this fact was most prominent initially for the obesity group.
A significant increase was observed for both groups (BMI>30 and <25 kg/m2) at the end for the following self-rated factors: physical health; joy/happiness and meaningfulness in their
occupational life; two questions about sleep; taking time for relaxing; and social network. A
significant increase was also seen for both groups concerning the three questions about physical
activity habits and the weekly 30 and 60 minutes of physical activity on at least a moderately
intense level (brisk walking).
In addition the group of persons with obesity showed significant improvement in the answers about mental (psychological) health; hope/optimism, joy/happiness, calmness/harmony/self-control, control and meaningfulness – all factors in their private lives. The group of persons with obesity also showed a significant increase for the questions concerning time for reflection and time for daily walking from place to place. Strikingly, only the group with obesity significantly increased most factors connected to their private lives. No significant differences were observed regarding the food, alcohol and tobacco questions for either group. However, the group with obesity showed a significant improvement regarding low-fat diets and fruit/ berries. Thus, no changes were seen concerning regular meals: (root) vegetables, fiber-rich porridge/flakes/coarse bread; French fries, peanuts, chocolate and/or candy, buns; ice-cream, lemonade and/or soft drinks, coffee and tea.
The proportions at the beginning of the project who were physically active for 30 min/day (at least brisk walking) none of the days or at most 1 day/week were 41% for the group with obesity and 25% for those with BMI<25kg/m2. These values decreased by the end of the project to 7% and 10%, respectively.
On the other hand, being physically active 4-5 days or more each week, the group with obesity initially reported mean values of 17% and those with BMI<25kg/m2, 35%. The corresponding values increased by the end of the project to 42% and 48% for each group.
Thus, significant increases were seen in both groups in their self-rated physical health,
joy/happiness in their occupational life, sleep and weekly physical activity behavior. For further
comparisons of factors and groups see Table 5.
That the physical activity habits increased could be expected due to the supervised regular physical activity during the project period. It is important in the future to follow-up whether these changes persist, for example for 6-12 months. Further investigations are therefore needed. We have earlier seen good reliability between the three initial physical activity questions. Some of the questions can also be selected for shorter questionnaires used in health
and physical activity contexts (see also below).
At the start of the project lower self-rated physical health, as compared to mental (psychological) health, was observed for both groups. This was most prominent for the persons with obesity. However, both groups showed a significant increase in self-rated physical health at the end of the semester. Interestingly, the mean values also significantly increased concerning mental (psychological) health, although only in the obesity group. The final mean values were quite similar for both groups concerning both physical and mental (psychological) health.
Promoting physical activity
Greater social support for the severely obese promotes higher walking levels and increased compliance (Hemmingsson 2007).
More than 80% of diabetes type II can be attributed to overweight (Bouchard 2000). Recent studies of sedentary individuals with a familial risk of type 2 diabetes show that intensive
support in primary care, even at a lower level, might be as effective as more costly theory-based interventions for increasing physical activity (Kinmonth, et al. 2008). These authors claim that this should be considered when promoting physical activity. They also emphasize that “declining physical activity is associated with a rising burden of global disease”.
When physical activity is advised/prescribed to prevent and treat disease, the four factors type of activity, duration, intensity and frequency should be considered in the recommendations (Wilmore, et al. 2008). These factors can be altered individually to enhance compliance without compromising efficiency.
Health projects with supervised exercise in groups could be one of several valuable methods for persons with obesity to increase physical activity. Supervised exercise is important for increasing physical activity in coronary and peripheral arterial diseases (cf. above Board of Directors and the Scientific Advisory Committee – SBU 2006).
Physical activity habits
To study physical activity habits, which can be measured in different ways, a health questionnaire was used. Questionnaires on physical activity habits have advantages and disadvantages (Hagstromer 2007). Results from other ongoing studies with the present questionnaire show good reliability for the first three questions regarding physical activity habits. For physical activity projects in health and/or medical contexts with evaluation of self-rated physical activity, a short questionnaire could be preferable. The last two questions on physical activity in the present study are based on the International Physical Activity Questionnaire (IPAQ), the result of European collaboration to create an international physical-activity questionnaire (IPAQ 2002, Hagstromer 2007). Here a short and a long version are present.
Other methods than questionnaires can be used for quantifying physical activity, for example accelerometer, physical activity dairy, recall, pedometer, doubly-labeled water (DLW), heart-rate recordings and oxygen consumption measurements (Bouchard 2000, Andersen 2003, Trolle Lagerros 2006, Hemmingsson and Eklund 2007, Hagstromer 2007, Hemmingsson 2007). Advantages of questionnaires include low cost, simplicity of administration and that large groups can be studied fairly easily. However, for showing actual physical activity behavior accelerometers and especially DLW are better, although these methods require special equipment
and are more expensive. Interestingly, for adults with obesity the pedometer correlated strongly with accelerometer measurements during walking and while sedentary (Hemmingsson 2007). Further studies are needed to evaluate other proper relationships between methods/techniques for measuring physical activity habits. The methods have different advantages and disadvantages concerning costs, valid and reliable recordings, reasonable practice use, advanced techniques as well as concerning measuring type, intensity, duration and frequency of the physical activity (Bouchard 2000). The measurements/questions should try to include all types of physical activities during regular days and weeks.
The present project has several limitations. No control groups without physical activity were included. Further, the project was of short duration. Longer periods are preferable both for performance and for following-up results. Whether the participants are still physically active after 6 to 12 months and/or whether they are more active than a group of non-participants are interesting issues to study. Also, larger groups doing both health questionnaires and physical tests are valuable for further evaluating the effects of physical activity for persons with obesity.
One may query the value of combining results in such a project where a certain amount of individuals did not continue after being initially listed and/or starting the tests and activities. However, the results show that the final material of 127 participants showed a potential to develop physical activity habits (cf. results above). Anyone with low physical activity and wishing to participate and continue in health-promoting projects/steps is important both to himself/herself and economically to the community (Hambrect, et al. 2004, Bouchard 2000, Hagberg and Lindholm 2006, Hagberg 2007). Just because some participants unused to physical activity withdraw, this does not reduce the importance of all those who really start and continue their physical activity in their own ways. Further methods have to be developed to attract people
who do not wish to participate in similar projects. Motivational Interviewing (MI) as outlined below could be one method for enhancing physical activity in various ways.
Yet the present project did show increased physical activity habits for the participants as well as increased self-rated physical health and, for some, also increased physical fitness. Proper physical activity habits and fitness relate positively to the prevention and treatment of several
diseases, including obesity (Astrand 1997, Bouchard 2000, Pedersen and Saltin 2006, Abadie 2007, Wilmore, et al. 2008).
Motivational interviewing as a means of increasing physical activity in children and adolescents.
A study at the Karolinska Institutet and the Swedish School of Sports and Health Sciences (Ekblom 2005) reported increased prevalence of overweight and obesity, and lowered physical performance, between two nationwide samples of 10-16-year-old children and adolescents, collected in 1987 and 2001. Changes in type, intensity and/or frequency of physical activities generally performed by children and adolescents were proposed as factors explaining the difference. Another proposed explanation was increased inactivity. Due to lack of consistent methods and scarcity of studies, there is uncertainty concerning temporal trends, but inactivity has most probably increased, at least in Sweden (Engstrom 2004). Concerning prevalence of inactivity, there are conflicting results. One study found the proportion not meeting current recommendations ranges between 5% and 45% (Riddoch, et al. 2004). For Swedish children aged 8-11 years, all participants reached the recommended level of physical activity (Dencker, et al. 2006). A study (Riddoch, et al. 2007) reported that a large majority of children are insufficiently active, according to current recommended levels for health. Those authors studied 5595 children aged 11 yrs, who wore motions sensors for seven consecutive days. Only 0.5-2.5% met with recommendations. It may be that the true variability is lower since both one’s definition of inactivity and one’s methods greatly affect the prevalence of inactivity.
Physical inactivity in adults coincides with increased prevalence of risk factors also for several metabolic diseases (Gill 2007, Shaw, et al. 2006, Thomas, et al. 2006). In childhood physical inactivity also coincides with increased prevalence of overweight or obesity and early signs of metabolic diseases (Andersen, et al. 2006, Hills, et al 2007, Ondrak, et al. 2007, Patrick, et al. 2004). A decline in physical activity during puberty is generally seen. It has also been shown that physical activity levels are fairly stable in 6-10-year-old children (Nyberg, et al. 2008). Therefore, targeting sedentary children is important to prevent future physical inactivity.
There may be a causal relationship between inactivity and increased risk of illness. However, at least in childhood, this causality is not fully described. Moreover, even if it is so, interventions are meaningful only if this behavior is modifiable. The research problem is therefore primarily to investigate whether sedentary behavior is modifiable without large and expensive organizations or structural changes and secondly how to design efficient, attractive interventions to promote activity and prevent or treat inactivity.
The motivational interviewing (MI) (DiClemente and Prochaska 1982) has been a frequently used method in other behaviour modification interventions. A small pilot study on a high risk group extremely sedentary children and adolescents (cf. Nyberg et al. 2008) has been performed by the unit of paediatrics, CLINTEC, Karolinska Institutet in cooperation with us with the aim to assess any change in physical activity using accelerometers, after a six-month intervention including MI. The present, short-term study shows a clear increase in total activity level as well as a decrease in time spent in inactivity following a brief MI intervention and two group sessions, in subjects with a history of sedentary behaviour. It is interesting that the most sedentary children increased their activity the most. No correlation was found between rated stages-of change and increased physical activity (cf. Ramos and Perkins 2006).
The use of MI as an intervention tool in sedentary children is a rather new, and its general usefulness is still not fully assessed. However, results from a few studies on the effect in adults, in diabetic and/or obese patients (cf. below) are encouraging and further studies are warranted. The model is most suitable for high-risk groups (such as highly sedentary children, children with overweight and obese or sedentary parents/adults), since it demands face-to-face interviewing. An earlier study on the use of MI in adults with type II diabetes (Jackson, et al. 2007) showed an increase in self-reported physical activity following a six-week intervention. In another study on obese subjects (Carels, et al. 2007) adding MI to conventional behavioural weight loss program led to increases in self-reported physical activity and weight reduction.
Physical activity recommendations
Recently, there has been a change in the recommendations for healthy adults (18-65 years) from the American College of Sports Medicine (ACSM) and the American Heart Association (AHA) (ACSM 2007, Nelson, et al. 2007). Adults need “moderate-intensity aerobic physical activity for
at least 30 minutes on five days each week or vigorous-intensity aerobic physical activity for at least 20 minutes on three days each week.” Further, adults will benefit from strength training (8-10 exercises each 8-12 repetitions) for at least two days each week. Thus, the fact “more is better” is clearer in the updated guidelines compared to the previous ones.
At least 60-90 minutes daily moderate-intensity physical activity is needed to prevent unhealthy weight gain in formerly obese individuals (Saris, et al. 2003). Further it is reported that 45-60 minutes each day of moderate-intensity physical activity is needed to prevent the change from overweight to obesity. For children, even more physical activity is recommended. With exercise over a one-year period a weight loss of 8.8 lb (4.0 kg) has been shown and it will only be effective if the activity is maintained over time (Andersen 2003). Individuals who preserve a wanted weight loss have higher levels of energy expenditure than those who regain weight. One way to contribute to the recommended physical activity levels is to decrease the total duration of sedentariness by incorporating more incidental and leisure-time activity into the daily routine (Saris, et al. 2003, Andersen 2003). Reviews show confirmation that persons with overweight and obesity should take exercise as a weight-loss intervention, particularly when combined with dietary change (Shaw, et al. 2006, Andersen 2003, cf. above). Further, exercise is associated with lowered risks of cardiovascular disease even if no weight is lost. Note that many clear health effects are achieved even with less physical activity (Astrand 1997, Bouchard 2000, Pedersen and Saltin 2006, Abadie 2007, Wilmore, et al. 2008). “When an individual enjoys an activity, the costs of lost leisure time are lower. On the other hand, it is not important for health gain that the activity be very intense.” (Hagberg 2007).
Returning to the present health project questionnaire, this showed that both adult groups (BMI>30 and <25 kg/m2) significantly increased their self-rated physical health, sleep and weekly physical activity behavior by the end of the 8-12-week period of twice-weekly supervised physical activity. Among those who were examined with various physical tests, a significant increase was seen for the persons with obesity in Astrand’s aerobic submaximal ergometer test, the 6-minute walking test and the strength endurance test for the back muscles. The same was true in the latter examination for tested persons with the recommended weight. For managers, employees and participants in public-health, sports, work, educational, health care
and rehabilitation contexts, knowledge about methods measuring physical activity habits and physical fitness may be valuable.
Conclusion
The present report, and the many health advantages of physical activity and fitness shown, may, it is hoped, contribute to increased public-health interest in physical activity projects. These may include physiological tests and e.g. health questionnaires regarding perceived health and life style habits. Using these, possible changes in physical activity fitness and physical habits, may be studied, two factors positively correlated in the promotion of health as well as in the prevention and treatment of many diseases, including obesity (Astrand 1997, Bouchard 2000, Pedersen and Saltin 2006, Shaw, et al. 2006, Abadie 2007, Wilmore, et al. 2008).
Table 1. Self-rated medical status at project start. Number of participants (n) answering
“Yes” to each disease/problem for the group of persons with obesity (Ob, n=63) and those with the recommended weight (BMI<25, n=64). Results for answers “no” and “don’t know” not shown. Percentage values (%) for each problem/disease in each group also specified. Problem/disease/medical care/medicine Ob n Ob % BMI <25 n BMI <25 %
Often respiratory infections 8 14 14 22
Asthma/allergy 17 29 17 27
Diabetes 8 13 2 3
Lung disease 2 3 3 5
Cardiovascular diseases 7 12 4 7
High blood pressure 17 30 16 25
Gastric ulcer, gastric and/or intestinal catarrh 11 18 18 30
Joint and/or muscle disease 18 31 15 25
Often problems in back, shoulders and/or neck 31 53 40 66
Often long-standing headache 8 14 17 27
Other disease 14 26 23 39
Medicines prescribed for long-standing use 40 66 45 70
Sleep and tranquillizer medicine 14 23 42 34
Hospitalized during the three most recent years 20 32 25 39
Surgery during the three most recent years 20 33 16 26
Visit a physician during past year 57 95 55 97
Table 2. Mean values (M±SD, standard deviation) on 6-minute walking test (meters) at start and end of period of
supervised physical activity for persons with obesity and for those with recommended weight BMI<25kg/m2. N = number of tested persons. t test value given for comparison of results between end (E) and start (S) of project period for each group. Significant changes (p<0.05) are marked with *.
OBESITY BMI < 25 kg/m2
Six-minute walking test N M SD Min Max t-test
E – S N M SD Min Max
t-test E – S
Walking test Start 23 540 72 420 711 11 517 92 387 715
Table 3. Mean values (M±SD) for submaximal cycle ergometer test (L/min) at start and at end of the period of supervised
physical activity for persons with obesity and those with recommended weight BMI<25kg/m2. N = number of tested persons. t-test value given for comparison of results between end (E) and start (S) of project period for each group. Significant changes (p<0.05) are marked with *.
OBESITY BMI < 25 kg/m2 Submax cycle
erg test (L/min) N M SD Min Max
t-test
E – S N M SD Min Max
t-test E – S
Submax cycle Start 19 2.30 0.57 1.60 3.60 17 2.11 .63 1.40 4.10
Submax cycle End 19 2.53* 0.61 1.60 3.90 .001* 17 2.13 .41 1.60 2.80 .875
Table 4. Mean values (M±SD) from back strength test (seconds) at start and end of period of supervised physical activity
for persons with obesity and those with the recommended weight BMI<25kg/m2. N = number of tested persons. t test value given for comparison of results between end (E) and start (S) of project period for each group. Significant changes (p<0.05) are marked with *.
OBESITY BMI < 25 kg/m2
Back strength tests (s) N M SD Min Max
t-test
E – S N M SD Min Max
t-test E – S
Back strength Start 19 55.5 69.3 3.9 300 6 44.6 36.6 14.2 114
Back strength End 19 78.1* 76.9 4.5 311 .000* 6 57.8 38.2 22.0 127 .069
Table 5. Self-rated health questionnaire results for A: Perceived health, B: Physical activity habits, C: Food, D: Alcohol and
tobacco, for the two investigated groups. At the start and at the end of the semester of supervised physical activity, the mean values (MEAN) and standard deviation (SD) of the ranked answering scale are given for each question for both groups. Obesity group: n= 64, recommended-weight group n= 64. In the comparisons of results between start and end of the project period for each group, significant changes (p<0,05) are marked with *.
A: PERCEIVED HEALTH OBESITY
MEAN START-END N:63 OBESITY SD START-END n:63 BMI < 25 MEAN START-END N:64 BMI < 25 SD START-END n:64 1. How do you find your…
6) Very satisfying 5) Satisfying 4) Quite satisfying 3) Quite unsatisfying 2) Unsatisfying 1) Very unsatisfying
...physical health? 3.33 – 4.15* 1.25-1.08 3.72- 4.22* 1.49-1.13
...mental (psychological) health? 4.26 – 4.66* 1.35-1.26 4.38 – 4.58 1.30-1.02
2. How often do you perceive in your occupational life...
7) Always 6) Often 5) Quite often 4) Sometimes 3) Quite seldom 2) Seldom 1) Never
...hope and/or optimism? 5.05-5.26 1.23-1.31 4.80-5.23 1.48-1.20
…joy and/or happiness? 5.07-5.37* 1.20-1.09 4.68-5.06* 1.42-1.05
...calmness, harmony and/or self-control? 4.77-5.00 1.18-1.37 4.59-4.93* 1.50-1.21
...control regarding your work situation? 5.05-5.22 1.33-1.26 4.55-4.76 1.69-1.50
3. How often do you perceive in your private life …
7) Always 6) Often 5) Quite often 4) Sometimes 3) Quite seldom 2) Seldom 1) Never
...hope and/or optimism? 5.25-5.46* 1.42-1,18 5.12-5,35 1.37-1,09
…joy and/or happiness? 5.17-5.53* 1.30-1.07 5.12-5.28 1.26-1.07
...calmness, harmony and/or self-control? 5.10-5.39* 1.25-1.10 4.96-5.17 1.32-1.08
...control regarding your weekday? 5.18-5.35 1.27-1.21 5.02-5.21 1.41-1.27
...meaningfulness? 5.27-5.64* 1.34-1.26 5.14-5.28 1.64-1.23
4. How often do you perceive…
7) Always 6) Often 5) Quite often 4) Sometimes 3) Quite seldom 2) Seldom 1) Never
...that you wake up thoroughly rested? 4.29-4.71* 1.54-1.45 4.37-4.76* 1.54-1.31
...a good night’s sleep? 4.57-4.84* 1.52-1.48 4.56-4.84* 1.31-1.50
...that you take time for relaxing? 4.74-5.08* 1.35-1.08 4.67-5.11* 1.47-1.17
…that you take time for reflection? 4.48-4.79* 1.26-1.28 5.02-4.95 1.18-1.29
5. I think that I have a good social network…
3) Yes 2) Yes, fairly1) No 2.53-2.66* 0.59-0.54 2.39-2.50* 0.73-0.67
6. Do you take time to read books, listen to music and/or go to cinemas, concerts, exhibitions or similar events? 3) Yes 2) Yes, sometimes 1) No
2.40-2.37 0.61-0.55 2.48-2.58 0.62-0.62
B: PHYSICAL ACTIVITY HABITS OBESITY
MEAN START-END n:63 OBESITY SD START-END N:63 BMI < 25 MEAN START-END n:64 BMI < 25 SD START-END n:64 1. Which alternative corresponds best with you as a person?
5) I move so I get sweaty and breathless every day or nearly every day 4) I move so I get sweaty and breathless several times a week 3) I move quite a bit and get sweaty and breathless sometimes 2) I move quite a bit but never so I get sweaty and breathless 1) I move quite little
2.60-3.37* 1.02-0.91 2.90-3.25* 0.99-0.90
2. How many days per week are you generally physical active for a total of 30 minutes? (at least brisk walking) 5) 6-7 days / week 4) 4-5 days / week 3) 2-3 days / week 2) 1 day / week 1) 0 day / week
2.65-3.43* 0.99-0.75 3.10-3.53* 1.00-0.94 3. How many days per week are you generally physical active for a total of 60 minutes? (at least brisk walking)
5) 6-7 days / week 4) 4-5 days / week 3) 2-3 days / week 2) 1 day / week 1) 0 day / week
1.98-2.73* 1.06-1.00 2.31-2.76* 0.94-0.96 4. How physically demanding is your daily occupation or corresponding routine?
4) Very demanding (heavy manual labor) 3) Demanding (quite a lot of walking and lifting) 2) Somewhat demanding (quite a lot of walking) 1) Not demanding (mainly sedentary work)
1.43-1.60 0.73-0.78 1.47-1.53 0.66-0.66 5. How much time do you spend walking daily?
4) over 60 min 3) 31-60 min 2) 10-30 min 1) less than 10 min
2.19-2.60* 0.85-0.91 2.48-2,70 0.88-0.80 6. How much time do you spend being sedentary during waking time (both working time and spare time. Include the time you travel sitting down between places)? 4) 0-2 hours 3) 3-4 hours 2) 5-7 hours 1) 8 hours or more
2.10-1.94 0.85-0.86 2.41-2.47 0.80-0.68 C: FOOD OBESITY MEAN START-END n:63 OBESITY SD START-END n:63 BMI < 25 MEAN START-END N:64 BMI < 25 SD START-END n:64 1. Do you eat the following meals during a regular week, Monday-Friday… 2) Yes 1) No
Breakfast? 1.94-1.95 0.86-0.25 1.94-1.95 0.24-0.22
Lunch? 1.95-1.95 0.22-0.23 1.93-1.92 0.25-0.28
Dinner/Evening meal? 1.95-1.95 0.22-0.22 1.95-1.97 0.21-0.18
2. Do you regularly eat low fat diet? 4) Yes 3) Yes, often 2) Yes, sometimes 1) No
2.97-3.22* 0.72-0.62 2.91-3.02 0.94-0.78 3. How often do you eat…
5) 3 times / day or more 4) 1-2 times / day 3) 4-6 times / week 2) 1-3 times / week 1) less than 1 times / week
...fruit and/or berries? 3.42-3.59* 1.08-1.05 3.66-3.78 1.13-0.98
…vegetables and/or roots? 3.60-3.71 0.78-0.70 3.68-3.84 0.77-0.65
...fiber-rich porridge, flakes, coarse bread or similar? 3.55-3.61 0.91-0.74 3.57-3.68 1.01-0.92 4. How often do you eat and/or drink…
5) Never 4) 1-3 times / month or less 3) 1-2 times / week 2) 3-6 times / week 1) 1-2 times / day or more
...chips, peanuts or similar? 4.08-4.19 0.82-0.71 4.04-4.00 0.67-0.90
...chocolate and/or candy? 3.32-3.52 0.81-0.83 3.22-3.31 0.83-0.88
...buns? 3.45-3.62 0.94-0.91 3.42-3.48 1.10-1.08
…ice-cream? 3.78-3.80 0.83-0.77 3.77-3.84 0.80-0.53
...lemonade and/or sweet soft drinks? 4.19-4.20 1.10-0.82 3.98-4.14 1.20-1.02
5. How often do you drink…
5) Never 4) 1-2 times / week or more seldom 3) 3-6 times / week 2) 1-3 times / day 1) 4 times / day or more
...coffee? 2.41-2.41 1.15-1.16 2.46-2.43 1.08-1.03
...tea? 3.29-3.41 1.22-1.23 3.08-2.90 1.11-1.11
D: ALCOHOL AND TOBACCO OBESITY
MEAN START-END n:63 OBESITY SD START-END n:63 BMI < 25 MEAN START-END n:64 BMI < 25 SD START-END n:64 1. How often do you drink…
5) Never 4) 1-3 times / month or more seldom 3) 1-2 times / week 2) 3-6 times / week 1) 7 times / week or more
...beer with low percentage of alcohol (up to 2,8%)? 4.20-4.23 1.04-1.02 4.08-4.11 1.11-1.03 ...beer with high percentage of alcohol (4,5% or more) and/or
wine (12%)? 3.54-3.63 0.91-0.82 3.37-3.38 0.93-0.94
...stronger wine (>20%) and/or liquor? 4.18-4.20 0.60-0.68 4.33-4.28 0.67-0.53
2. When you drink alcoholic beverages, how many glasses do you usually drink?
One glass refers to: 45cl beer (2,8%) / 33cl strong beer (4,5%) / 1 small glass strong wine (20%) / 4cl liquor 6) I don´t drink alcohol 5) 1-2 glasses 4) 3-4 glasses 3) 5-6 glasses 2) 7-9 glasses 1) 10 or more glasses
4.56-4.61 0.94-0.76 4.83-4.93 0.58-0.44 3. Do you smoke? 3) No 2) Yes, but seldom 1) Yes 2.75-2.77 0.65-0.62 2.78-2.78 0.57-0.55 4. Do you take snuff?
3) No 2) Yes, but seldom 1) Yes 2.87-2.80 0.49-0.60 2.92-2.97 0.37-0.25
References
Abadie B.R. 2007. Physical Fitness: The Gateway to Preventive Health. Forum on public policy. E-publ. http://forumonpublicpolicy.com/archivesum07/abadie.pdf
ACSM - American College of Sports Medicine and AHA - American Heart Association. Updated physical activity guidelines released today. 2007. E-publ.
http://www.acsm.org/AM/Template.cfm?Section=Media&CONTENTID=7769&TEMPLATE=/C.M/Conte ntDisplay.cfm
Andersen Ross E., editor. 2003. Obesity – Etiology, Assessment, Treatment and Prevention. Campaign, IL: Human Kinetics.
Andersen L.B., Harro M., Sardinha L.B., Froberg K., Ekelund U., Brage S. and S.A. Anderssen. 2006. Physical activity and clustered cardiovascular risk in children: a cross-sectional study (The European Youth Heart Study). Lancet 368:299-304.
Astrand P-O. 1997. Why Exercise? Sports Physiol 3:2:45-54.
Astrand, Per-Olof, Kaare Rodahl, Hans A. Dahl and Sigmund B. Stromme. 2003. Textbook of work physiology. Physiological bases of exercise. 4th ed. Champaign, IL: Human Kinetics.
Astrand P-O. and I. Ryhming. 1954. A nomogram for calculation of aerobic capacity (physical fitness) from pulse rate during submaximal work. J Appl Physiol 7:218-21.
Biering-Sorensen F. 1984. Physical measurements as risk indicators for low-back trouble over a one-year period.
Spine 9: 106-19.
Board of Directors and the Scientific Advisory Committee – SBU 2006. Methods of Promoting Physical Activity English summary 27p. The whole report in Swedish 293p.
http://www.sbu.se/upload/Publikationer/Content1/1/Fysisk_sam_ENG.pdf
Bouchard Claude. 2000. Physical activity and obesity. Ed. Bouchard C. Champaign, IL: Human kinetics.
Carels R.A., Darby L., Cacciapaglia H.M., Konrad K., Coit C., Harper J., Kaplar M.E., Young K., Baylen C.A. and A. Versland. 2007. Using motivational interviewing as a supplement to obesity treatment: a stepped-care approach. Health Psychol 26:369-74.
Dencker M., Thorsson O., Karlsson M.K., Lindén C., Svensson J., Wollmer P. and L.B. Andersen. 2006. Daily physical activity in Swedish children aged 8-11 years. Scand J Med Sci Sports 16:252-7.
DiClemente C.C. and J.O. Prochaska. 1982. Self-change and therapy change of smoking behavior: a comparison of processes of change in cessation and maintenance. Addict Behav 7:133-42.
Ekblom O., Oddsson K. and B. Ekblom. 2004. Health-related fitness in Swedish adolescents between 1987 and 2001. Acta Paediatr. 93(5):681-6.
Ekblom, O. 2005. Physical fitness and overweight in Swedish youths. Thesis for doctoral degree. Dept of physiology and pharmacology, Karolinska Institutet, Stockholm, Sweden.
Ekblom B., Engström L.-M. and O. Ekblom. 2007. Secular trends of physical fitness in Swedish adults. Scand J
Med Sci Sports. 17(3):267-73.
Engstrom L.-M. 2004. [Behavior in physical activity in children and adolescents are in change]. Svensk
idrottsforskning 4:10-15. In Swedish
EUROFIT. 1993. European tests of physical fitness. Council of Europe committee for the development of sport. 75p.
Eurofit for adults. 1995. Assessment of health-related fitness. Council of Europe committee for the development of sport and UKK Institute for Health Promotion Research (Tampere, Finland). 118 p.
Gill J.M: 2007. Physical activity, cardiorespiratory fitness and insulin resistance: a short update. Curr Opin Lipidol 18:47-52.
Guyatt G.H., Sullivan M.J., Thompson P.J., Fallen E.L., Pugsley S.O., Taylor D.W. and L.B. Berman. 1985. The 6-minute walk: a new measure of exercise capacity in patients with chronic heart failure. Can Med Assoc J. 132;919-23.
Hagberg L. 2007. Cost-effectiveness of the Promotion of Physical activity in Health Care. Thesis for doctoral
degree. University of Umea, Sweden.
Hagberg L.A. and L. Lindholm 2006. Cost-effectiveness of healthcare-based interventions aimed at improving physical activity. Scand J Public Health. 34 (6):641-53.
Hagstromer M. 2007. Assessment of health-enhancing physical activity at population level. Thesis for doctoral
degree. Karolinska Institutet, Stockholm, Sweden.
Hambrecht R., Walther C., Mobius-Winkler S., Gielen S., Linke A., Conradi K., Erbs S., Kluge R., Kendziorra K., Sabri O., Sick P. and G. Schuler. 2004. Percutaneous coronary angioplasty compared with exercise training in patients with stable coronary artery disease: a randomized trial. Circulation. 109:1371-8. Epub.
Hemmingsson E. 2007. Physical activity in the several obese. Studies on measurement and promotion. Thesis for
doctoral degree, Karolinska Institutet, Stockholm, Sweden.
Hemmingsson E. and U. Ekelund. 2007. Is the association between physical activity and body mass index obesity dependent? Int J Obesity 31(4):663-8. Epub 2006 Sep 5.
Hills A.P., King N.A. and T. P. Armstrong. 2007. The contribution of physical activity and sedentary behaviors to the growth and the development of children and adolescents: implications for overweight and obesity.
Sports Med 37:533-45.
Hultman G., Nordin M., Saraste H. and H. Ohlsén. 1992. Body composition, endurance, strength, cross-sectional area and density of mm erector spinae in men with and without low back pain. J Spin Dis 6:114-23.
IPAQ. INTERNATIONAL PHYSICAL ACTIVITY QUESTIONNAIRE. 2002. http://www.ipaq.ki.se/ipaq.htm
Jackson R., Asimakopoulou K. and A. Scammell. 2007. Assessment of the transtheoretical model as used by dietitians in promoting physical activity in people with type 2 diabetes. J Hum Nutr Diet 20:27-36
Kinmonth A-L., Wareham N.J., Hardeman W., Sutton S., Prevost A.T., Fanshawe T., Williams K.M., Ekelund U., Spiegelhalter D. and S.J. Griffin. 2008. Efficacy of a theory-based behavioural intervention to increase physical activity in an at-risk group in primary care (ProActive UK): a randomized trial. Lancet 371:41-48.
Lee C.D., Blair S.N. and S. Jackson. 1999. “Cardiorespiratory fitness, body composition, and all-cause and cardiovascular disease mortality in men”, Am J Clin Nutr 69: 373-80.
Nelson M.E., Rejeski W.J., Blair S.N., Duncan P.W., Judge J.O., King A.C., Macera C.A. and C. Castaneda-Sceppa. 2007. Physical activity and public health in older adults: recommendation from the American College of Sports Medicine and the American Heart Association. Med Sci Sports Exerc 39:1435-45.
Ness A.R., Leary S.D., Mattocks C., Blair S.N., Reilly J.J., Wells J., Ingle S., Tilling K., Smith G.D. and C. Riddoch. 2007. Objectively measured physical activity and fat mass in a large cohort of children. PLoS
Nyberg G., Ekelund U. and C. Marcus. 2008. Physical activity in children measured by accelerometry: stability over time. Scand J Med Sci Sports In press.
Ondrak K.S., McMurray R.G., Bangdiwala S.I. and J.S: Harrell. 2007. Influence of aerobic power and percent body fat on cardiovascular disease risk in youth. J Adolesc Health 41:146-52.
Patrick K., Norman G.J., Calfas K.J., Sallis J.F., Zabinski M.F., Rupp J. and J. Cella. 2004. Diet, physical activity, and sedentary behaviors as risk factors for overweight in adolescence. Arch Pediatr Adolesc Med 158:385-90.
Pedersen B.K. and B. Saltin. 2006. Evidence for prescribing exercise as therapy in chronic disease. Scand JMed
Sci Sports 16 Suppl 1:3-63. Review.
Ramos D. and D.F. Perkins. 2006. Goodness of fit assessment of an alcohol intervention program and the underlying theories of change. J Am Coll Health 55:57-64.
Riddoch C.J., Bo Andersen L., Wedderkopp N., Harro M., Klasson-Heggebø L, Sardina L.B., Cooper A.R. and U. Ekelund. 2004. Physical activity levels and patterns of 9- and 15-yr-old European children. Med Sci Sports
Exerc 36:86-92.
Riddoch C.J., Mattocks C., Deere K., Saunders J., Kirkby J., Tilling K., Leary S.D., Blair S.N. and A.R. Ness. 2007. Objective measurement of levels and patterns of physical activity. Arch Dis Child 92(11):963-9. Epub.
Swedish National Institute of Public Health. 2008. [Physical activity for prevention and treatment of diseases]. FYSS. In Swedish. www.fyss.se
Saris W.H.M., Blair S.N., van Baak M.A., Eaton S.B., Davies P.S.W., Di Pietro L., Fogelholm M., Rissanen A., Schoeller D., Swinburn B., Tremblay A., Westerterp K.R. And H. Wyatt. 2003. How much physical activity is enough to prevent unhealthy weight gain? Outcome of the IASO 1st Stock Conference and consensus statement. Obesity reviews 4: 101–114.
Shaw K., Gennat H., O'Rourke P. and C. Del Mar. 2006. Exercise for overweight or obesity. Cochrane Database Syst Rev CD003817
Thomas D.E., Elliott E.J. and G.A. Naughton. 2006. Exercise for type 2 diabetes mellitus. Cochrane Database Syst
Rev 3: CD002968.
Trolle Lagerros Y. 2006. Physical activity from epidemiological perspective – measurement issues and health effects. Thesis for doctoral degree. Karolinska Institutet. Stockholm, Sweden.
Wilmore Jack H., Costill David L. and W. Larry Kenney. 2008. Physiology of Sport and Exercise. 4th ed. Champaign, IL: Human Kinetics.
Published by the Forum on Public Policy