the Impact of Population Aging on
Real-estate Price
An empirical application at the provincial level in China
BACHELOR THESIS WITHIN: Economics NUMBER OF CREDITS: 15
PROGRAMME OF STUDY: International Economics AUTHOR:Jiayi Jin & Weiyi Dai
Bachelor Thesis in Economics
Title: The impact of population aging on real estate price (an empirical application at the province level in China)
Authors: Jiayi Jin and Weiyi Dai Tutor: Mikaela Backman
Date: 2021-05-22
Key terms: Housing price, Aging population, Generalized method of moments.
Abstract
Many previous studies have shown that the aging population correlates with housing prices. Studies in Japan, Korea and Scotland have shown different results. The results that disagrees with each other may be due to the differences of each sample. The differences include cultural diversity, population size and wealth gaps. To find more about the correlations of housing prices with population aging. This study picks China as an example, gathers data on China between the years 2004 to tear 2019, then applies economic methods such as OLG to figure out the correlations between these two factors. China has a large data size and cultural diversity, which will be a good example to test the hypothesis in this study.
By data analysis, the study shows a result of significant less than 1% which indicates the aging population and house prices do have positive correlations. In other words, the aging of a country does increase the house price. These results are based on fixed effects tests.
Table of Contents
1. Introduction... 4
2. Literature review... 6
3. Theoretical framework... 8
4. Status Quo of China's Population Aging and Housing Prices.13
5. Methodology... 15
5.1. Dependent Variables...15
5.2. Independent variables... 16
5.3. Data sources and descriptive statistics... 17
5.4. Model Construction... 18
6. Empirical Model and Result... 19
6.1. Stationarity analysis...19
6.2. Cointegration analysis... 20
6.3. Analysis of regression results...21
6.4. Robustness test...23
7. Conclusion...24
1.
Introduction
Traditionally, the age of 65 and above can be defined as seniors (Richard, 2019). By this indicator, the world is entering an aging society. This means people older than 65 contribute around 9 % of the world’s total population.
Population aging is likely to become one of the most important social trends in the 21st century (UNFPA, 2012). A lot of sectors of the economy are affected by population aging including total supply of labor resources, social productivity (Lee, 2016). The wages are affected by labour demand and supplies. Wages and CPI together decide the savings for individuals. Those factors are also key elements for real estate industry performance. Theoretically, older individuals need houses with living comfort, quiet environments and faster access to the hospital (Hansen & Gottschalk, 2007). Compared to young people, the elders should have fewer requirements for entertainment and distances to work or school. The difference of housing requirements from the elders and the youth with the shift of population age structures would shift the real estate market segments demands.
China is currently the most populous country in the world with a population of more than 1.4 billion (World Population Review, 2021). At the same time, China is also one of the third fast aging countries with an annually aging rate of 17.4% (aged people increasing rate compare to previous year)by 2020 (Statista, 2021). Following North Korea with an aging rate of 23.0% and Singapore with an aging rate of 20.9% made by the United Nations, Department of Economic and Social Affairs. When a country or region has an elderly population of 65 years, more than 7% of the total population, it means that the country or region is aging (United Nation, 1956). The issue of population aging has become a major measurement for the economic and social development of China. Since the government needs to pay extra public
resources to take care of elders and the pressure from social responsibilities for youth will be higher (Bloom and Williamson, 1998). In 2018, China's birth rate was
10.94% and at the lowest level since 1949. A low fertility rate often led to a
demographic shift in an economy especially in a non-immigrant country like China. The entire society has a low dependency ratio. The dependency ratio is the ratio to
indicate the relation of how much pressure or responsibilities the people in middle range age have, due to the responsibilities of taking care of the people under 18 or retired (Bloom and Williamson, 1998).
In the big picture, the average house price is 817 dollars per square and the average income of Chinese people is 612.3 dollars for a month (Chai, 2020). This means individuals may pay up to 75% of their incomes to buy a house without help from others. So logically elders with enough savings may support their kids financially on real estate conceptions.
Real estate is very important to a country. For Chinese people, it accommodates the function of housing and property appreciation, fiscal revenue. While people need houses to meet their basic living needs, the increase in real estate prices has also brought some people's property appreciation. It is also the backbone of the economy of China (Echo Chen,2018). In the context of the rapid increase in China's
population aging, it is not only urgent but also very important to study the impact of population aging on real estate prices. Thus, previous research has not found a consistent conclusion on the impact of a population hanging on real estate prices. Using data from different countries or regions, even sow the opposite conclusion. It is difficult for the government to provide effective policy recommendations. This study will take China from 2004 to 2019 as the research object and analyze the relationship between population aging and real estate prices by constructing a panel model. The estimation of the result for the model is the correlation between the volume of aged population and real estate prices is positive. The purpose of this study is to discuss in depth the impact of China's aging trend on real estate prices. Over the past decade, the demographic dividend, which is the extra productivity benefited from the high labour force, has had an important impact on the development of China’s real estate and has been a factor behind the rising of real estate prices (Yu Zhang, et al, 2020). Similar to the west after baby booming. A tedious amount of young people flow into the labour force market and exchange their labour for money. The open market of China to the world also helped people gain savings. (Mengqi Wang, 2020). However, instead of spending money on daily consumption to improve daily living standards, Chinese people are willing to save
money and invest in real estate. In certain perspectives, house ownership is one of the requirements for Chinese citizens as their life goal. (Mengqi Wang, 2020). This is caused by Chinese culture as an agricultural country. Chinese civilization is agricultural, which people mostly favour settleing down rather than keep moving (Yu Zhang, et al, 2020). The demand and supply of land are also intense since China has 17.9% of the world population but not 17.9% of world land. (Worldmeter, 2018) From a land demand and supply perspective, the land price will be increasing in the long run. So real estate has become a “must-have” item for every family. The Chinese government tried to adjust the market price of real estate using policies to make houses affordable for most citizens. Such as limitations on the number of houses individuals can purchase or staged taxes for houses after the first one for individuals (Wang, 2017). However, the demographic dividend is commonly only present in one stage of a country’s development. As China's aging problem becomes increasingly prominent, on the one hand, aging will directly affect the segmentation of the market. Because most elderly people who already own houses are less willing to purchase a second one. On the other hand, as the demographic dividend declines, the segments of youth will shrink and continuously shift to segments of elders. This will have a long-term and far-reaching impact on the Chinese real estate market. Since the elders' segment is not the target market segment for real estate (Drolet, 2019). For foreigners, in most instances, they will consider buying real estate in China only when they choose to get married to Chinese people. Because foreigners are allowed to only own one residential property for their use and may not rent out the property or act as a landlord (Visa, 2020). Therefore, the impact of foreign investment can be ignored.
2.
Literature review
Many existing researchers haveresearchedthe relationship between population aging and real estate prices. The conclusions from the studies can be divided into three different perspectives. The first view holds that there is a significant negative correlation between population aging and housing prices. Population aging will reduce the total housing demand of residents, leading to a decline in housing prices
(Mankiw, borns and
1989 ). From this study, the data showing the lack of new
fast aging rate shrinked the total population. Since the demands is based on population, supplies is based on total resources. The decrease on demand and constant supplies will change the demand and supply relations. The study is based on population of Welsh area in England. This study is only researched on developed country. Where average income is high and nation has mature financial system for house loans. Citizens can make a loan with bank and buy houses. So the key affection on house demand is based on citizen’s house needs. Currently, the relation may changed due to house price booming after 2008 global financial crisis. Which is 12 years later. The loan for houses have stricter rules to apply. Plus the income gap is way bigger than 12 years before. A further study with larger population would testify the result from this study.
Empirical studies on 22 developed economies such as the United Kingdom and the United States show that population aging does have a significant negative impact on housing prices (Takáts, 2012). In the open market, with developed countries. The majority of people will spend money on education rather than houses. After 2008 financial crisis of house loans. Currently the education loans are the biggest issue for developed countries. The willing for purchase a house is delayed by education loans. For some immigration country such as Canada and Australia, although they are aging fast with less birth rate. But immigrants is inflow to those country and fulfill the labour markets. The foreigner house demand may change the supply and demand relations. It is hard to claim the effects of aging on house price with those economies. The second view holds that there is a significant positive correlation between population aging and housing prices, this study is 20 years earlier where the population was not bombed, and half of the world was under the communist system since the Soviet Union. No free trade and open market affect the price of real estate. Governments see real estates as public properties and distribute to citizens based on the rules from system. The supplies is always after the demand and only produce amount to satisfy the demand. So the data is lack of evidence for proving aging effects on house prices(Engelhardt and Poterba, 1991).
The third view is that population aging is not the main determinant of housing prices. Chen and Gibb (2012) combined the housing price model at the macro level with the household composition model at the micro-level and used the microsimulation method to study the impact of population aging on housing prices in Scotland. The results show that population aging is not the main determinant of housing prices. Green and Hendershott’s (1996) studies also show that aging populations will not lead to falling house prices. This is an empirical study trying to find relations by big data, using models. The study gives a good result on the correlation between the aging population and housing prices. The study lacks enough data since it only studies the area of Scotland. The data is not big enough to prove the conclusion is universal.
To study how the aging population relates to housing prices, the designed ideal environment should be a large sample size with less other possible elements which may affect the house price. Those three studies either have political system factors or not enough sample size or historical backgrounds or large amount of immigrants. The study on mainland China will improve the study on the relationship between house prices and aging populations. China is large enough for sample, the country limited immigrants to China strictly so the foreigner buyer would be consider no affection. China have large income gaps and half open house markets. The “hukou” (citizenship is assigned with born place and outsider has strict rule on house buying kids educations) policy limited none local people’s buying power in urban cities. Hence the urbanization rate is considering as the development rate of urban area. The stable population structure and urbanization rate, green rate makes China a better example for study.
3.
Theoretical framework
3.1.Real Estate Economics (Housing supply and consumer demand side)
The housing price can reflect the level of the economic value of the real estate (Pagourtzi, 2003). Real estate is not only including all buildings and structures on the
land, but also includes the land (Gore, 1991). So, the price of real estate includes the economic value of all the buildings and structures and the value of the land. Real estate can be invested. It means not only the change of real estate value will affect the housing price, but also the housing price is dependent on the real estate market and the change in the supply and demand of the market.
Real estate is a commodity whose price is affected by supply and demand with the changes in the age structure of the social population (Paul, 2013). This means market segments by age do have effects on real estate prices. The relationship of supply and demand of housing is the basis of the stable development of the real estate market which is mainly explored in this demand and supplies theory, and it is the key factor of the fluctuation of the housing price (Hilbers, 2001).
Housing supply refers to the number of houses that can be provided and sold by real estate developers in the market under a certain period and price level (Benson, 1998).
The supply of real estate is divided into two kinds. One is the stock housing supply, that is, the number of existing housing available for sale in the market in a certain period also known as second-hand houses and the other one is flow supply, which is the number of housing available for sale at a given point in time (Gyourko, 2009). From the previous study, according to the data from the World Bank, the population aged 65 or above to the total population in the United Kingdom is 18.2% in 2017 and housing demand increases by 2.6 million from the year 2002 to 2017 as shown in the report from the ministry of housing, communications, and local government in the UK. Then the price growth rate of the UK reached its maximum. By prediction using the U.K as an example, the population age rate in China is still 11.2% (world bank, 2017). The population age rate in China is lower than in the United Kingdom. There are still theoretical chances for prices to dramatically increase in China. Since the U.K has house price increased with population age rate over 11.2%
In conclusion, housing supply and demand will affect the price directly, the population demographic is an important element that influences the demand for
houses. The population age structure affects the jobs demand and supplies result in individual wages increase or decrease. The increase in income will encourage people to buy houses. Hence increase in the aged population will be positively related to house demands.
3.2.The relationship between population aging and housing demand
The demand for housing changes along the life cycle of an individual. There is little demand for housing among teenagers, who live with their elders, so their consumer demand is close to zero (Feldstein, 1976). At the same time, they do not have the purchasing power of housing, so the housing demand of this age group is less. Or when children want a separate room, a bigger bedroom, it is part of the need that is usually reflected in their parents’ housing needs. Universally, houses demand only relate to mature people, the need of age under 18 is counted as their family purchases. Those purchases will not be analyzed separately since they will be double-counted if the study counts them as kids’ purchases.
People in their 20s and 30s are usually in the age of marriage, and they will prepare for a house for their marriage so that houses are necessary for them (Stockard, 1992). Their consumption demand is great. They are one of the main consumer groups of housing. The housing consumption of this group is reflected in strong demand, which means they will buy a house regardless of their income. There is a trend where girls require a house from their boyfriends before marriage otherwise, they refuse the marriage proposal. (Hu, M., Wu, L., Xiang, G. and Zhong, S. , 2021)
There is also a greater demand for housing for people in their 30s and 40s, (Green, 2016) who have been working for some time. They have a certain level of wealth accumulation and a higher level of income.
People aged 40 to 65, these people have higher wealth accumulation and higher income than people aged 30 to 40. Their demand for housing is not only the high quality of the house but also the pursuit of housing comfort environments (Green, 2016).
The elderly over 65 years old, they are more concerned about the health and medical treatment and they mainly focus on more convenient facilities when purchasing a new house (Robinson, 2014). At the same time, their children have reached the age to buy a house for marriage, while their children are hard to afford (Savage, 1999). Therefore, they will give their children economic help, which also increases the elders’ demand for housing consumption.
The social and economic effect of population aging will provide a lot of funds for the development of the housing market (Zhang, 2006), which means, most aged countries are well developed. People’s average education level increased, so they make incomes from their knowledge rather than cheap labour. Population decreases and supplies of workers decrease. The relation between demand and supplies of workers changed. Labour forces have less competitions. Therefore, Economic development is stable and people's salary level rises, which encourages people to get more consumption behaviours. This results in an improvement of consumption level and stimulates the increase of people's demand for housing consumption. Citizens with low wages have to spend money on living costs which spend the majority of their incomes, so they do not have residual money for house purchase. With increase salaries, people can save money for buying houses. Not only numbers for houses demand will increase due to more people get richer, but also the requirement for the size of houses will also increase due to rich people’s quality. In total, the revenue of the real estate market will increase.
3.3.Overlapping generation model (OLG model)
The overlapping generation (OLG) model was initially put forward by Samuelson in 1958 and proposed the OLG model of the pure-exchange economy on the interest rate to discuss the role of money in the economy (Ling, 1996). In 1965, Peter Arthur Diamond improved the model with the introduction of aggregate neoclassical production with the discussion of the function of the golden-rule level of capital and national debt in the economy (Donald, 1988).
The OLG model describes an economy producing only one product, assuming that the product is produced by both labour and capital elements and the product can be consumed or invested (Galor, 1989). Suppose that a person’s life is divided into two periods: youth and old age. Young people are productive, but old people are not. Thus, there are two types of people in society: the productive young and the unproductive old (Donald, 1988). A society with an aging population will have more and more unproductive old people and fewer young people means less labour force. When there is less productivity in society, there will be a surplus of labour-intensive jobs such as the real estate industry. The previous study shows people purchase houses based on their residual money after daily living costs and taxes. The larger number of old people will force the government to ask for more taxes from the young ones. So, the young one has high social responsibilities economically. This directly results in a negative consumption of expensive products including houses. This could be the key indicator for the correlation of the aged population and real estate price.
According to the OLG model, Wang (2015) established the function of the consumption of the young and the old. The function is t h h h , where is the consumption of young age, is the consumption of old age and is the discount rate. Wang took the data from 31 provinces in China from the year 2002 to 2013 and found that population aging inhibits housing demand which stands for when the elderly population ratio rises, the housing prices will increase. The situation in Wang's study is, China is a half free market half communism market society. For rich cities, those cities mainly focus on international trade, are open to the international market and have less government support. For poor areas, governments have plans to give houses freely to local citizens to illuminate the poverty level. Such as Daliangshan, a pool place in Sichuan China., where locals live on top of mountains. The governments provide free houses for them at the bottom of mountains and encourage them to move down (De Han, 1999). As mentioned in Wang’s paper, the problem with the decline in housing demand and the increase in housing supply in China is similar to other developed countries like the US and Japan. These countries are facing the severe problem of aging populations and lack
of housing demand (Rosenberg, 2001). The house price will drop since supply is over the demand.
4.
Status Quo of China's Population Aging and Housing Prices
The market of China follows half free market systems. The definition of the half-free market is the market price normally follows demand and supply ratios. However, the Chinese government had policies on the housing market by applying policies. The first method is to adjust taxes for buying houses. The second policy is to adjust the loan interest for purchasing a house for banks. The governments also applied rules such as the number of houses individuals can buy. (Z.Y., S.W., & Y.S., 2017)
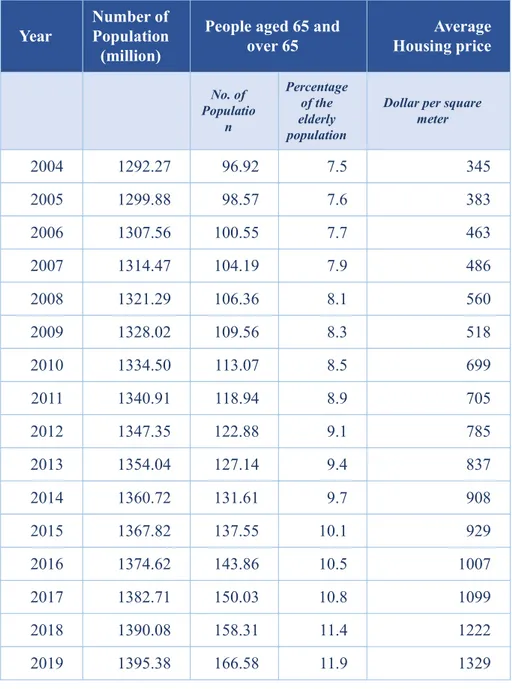
With the continuous rapid development of China's real estate market in recent years, the price of residential commercial housing has continued to increase. As shown in the figure below, the average price of real estate in China in 2004 was 345 dollars per square meter (Chamon, 2010). By 2019, it increased to 1328.6 dollars per square meter, 3.9 times increase during this period. It can be seen from the figure that the increase in housing prices fluctuates. Except for the negative growth in 2008, the increase in other years is positive. In 2008, due to the global financial crisis brought about by the subprime mortgage crisis in the United States, housing prices experienced the only negative growth in 15 years of -1.9%. Afterwards, China introduced a series of policies to stimulate the economy. Part of the funds flowed to the real estate market. In 2009, the increase reached a peak of 24.69%. Subsequently, the growth rate of housing prices began to slow down but still rose steadily every year. (Evans, 2000)
At the same time, as China is one of many populous countries, the deepening of aging will lead to a decline in the proportion of the labor force. It can be clearly seen from the figure below that the proportion of the elderly population is increasing year by year, from 7.5% in 2003 to 11.9% in 2019.
Table 1 Status Quo of China's Population Aging and Housing Prices
Year Number ofPopulation (million)
People aged 65 and
over 65 Housing priceAverage
No. of Populatio n Percentage of the elderly population
Dollar per square meter 2004 1292.27 96.92 7.5 345 2005 1299.88 98.57 7.6 383 2006 1307.56 100.55 7.7 463 2007 1314.47 104.19 7.9 486 2008 1321.29 106.36 8.1 560 2009 1328.02 109.56 8.3 518 2010 1334.50 113.07 8.5 699 2011 1340.91 118.94 8.9 705 2012 1347.35 122.88 9.1 785 2013 1354.04 127.14 9.4 837 2014 1360.72 131.61 9.7 908 2015 1367.82 137.55 10.1 929 2016 1374.62 143.86 10.5 1007 2017 1382.71 150.03 10.8 1099 2018 1390.08 158.31 11.4 1222 2019 1395.38 166.58 11.9 1329
Considering the difference in the exchange rate from 2004 to 2019, the unified conversion rate is RMB 1= USD 0.1156.
5.
Methodology
In this thesis, based on combining the existing literature, the following variables were selected as the object of study, and the specific variables, as well as explanations, are described below.
In order to strive for the accuracy and effectiveness of the research. The study is excluding Hong Kong, Macau. Those areas are under different governments and have their own policy and market system. To get the total population of the rest area of China. This thesis takes 31 administrative regions above the provincial level in China as the observation object, then sums it up as total instead of using nationwide data. Since nationwide data includes Hong Kong and Macau. The study needs data with the same conditions to avoid affections on house prices. 2004-2019 as the observation interval, and obtains its panel statistics, a total of 465 observations. These statistics come from the China Statistical Yearbook (2004-2019). The relevant data in this article uses the deflator method to eliminate the impact of inflation. In addition, in order to effectively eliminate the heteroscedasticity of the data sequence and shrink the linear trend of the data, which results in a weak correlation, the explanatory variable and the control variable will be processed by natural logarithm. 5.1.Dependent Variables
This paper explores the impact of population aging on real estate prices, and real estate prices are selected as the dependent variable. The real estate includes residential, commercial buildings, and other buildings. Since residential commercial housing accounts for about 80% of total commercial housing (National Bureau of Statistics of China, 2019), residential demand is also the main demand for real estate. Housing price (Hp) is chosen as a proxy indicator for real estate price in this thesis. It is expressed by the average price per square meter.
5.2.Independent variables
Population aging is commonly measured in demographics by the elderly population coefficient and population dependency ratio. First, the elderly population coefficient refers to the proportion of elderly people over 65 years old in the total population of the country, which can directly observe the degree of population aging. Secondly, the population dependency ratio mainly includes the total population dependency ratio, the child dependency ratio and the elderly population dependency ratio. The international definition of age groups is that those younger than 15 years old are children and adolescents, those above 65 years old are the elderly population, and those in between are the working population. The formula for calculating the dependency ratio is the dependent population divided by the working population. Therefore, the elderly population dependency ratio is equal to the elderly population divided by the total working population. Considering that house purchase is a lifelong decision. Most people only purchase one house. So, the ability to purchase a house is related to the labour rate. None working group of the population may be able to purchase a house. Banks only give loans to people with jobs since job wages are their credits. Therefore, the labour rate needs to be taken into account.
This thesis selects several control variables to be included in the estimations to reduce omitted variables bias.
Population density: Population density is the number of people living in a unit area within a region, and this indicator reflects the sparseness of the population in a particular region. Housing prices are determined by the supply relationship in the real estate market. With the fixed speed of supplies due to productivity, comparably, the regional population density will be relatively the main cause of an increase in real estate prices.
Urban environment: As people's living standards improve, their pursuit of quality of life is also getting higher. Environmental factors of cities have a significant impact on property prices (Klopp, 2017). In this paper, the green coverage rate of urban built-up areas is used as an indicator to measure urban environmental factors.
Urbanization rate: The rapid development of urbanization in China is one of the important factors that push up the house price, such as Beijing, Shanghai and Shenzhen. This part is different from population density, it is the ratio of the urban population to the permanent population of the city. The urbanization rate has a significant impact on housing prices, (Van Doorn, 2019) and an increase in the urbanization rate will push up housing prices.
Urbanization rate = Number of Urban Population / Number of Urban Resident Population
The urbanization rate indicates the percentage of people who are living in urbanized cities. Specifically indicate the ratio between temporary residents who rent places and permanent residents who own houses. Fully urbanized cities should do developments therefore there will be houses for everyone, which means the urbanization rate should be close to one. For urbanization rate larger than one indicates low urbanization progress. The urbanization rate should not be less than one since the resident population should always be less or equal to the total local population.
5.3.Data sources and descriptive statistics
The following table is a statistical description of the above data. Correlation matrix:
Year is the year range from 2004 to 2019 TP = Total Population
P65= aged 65 and above population
P65TP= age 65 and above in proportion to total population HP = house price
Table 2 Correlation matrix
Year TP P65TP HP
TP 0.9996 1.0000 0.9805 0.9852
P65 0.9831 0.9820 0.9999 0.9953
P65TP 0.9818 0.9805 1.0000 0.9950
HP 0.9867 0.9852 0.9950 1.0000
Table 3 Statistical description of the data Variables Variable
code NumberObservationsof Avergenumber Standard deviation Minimum Maximum
Housing price Lnhp 465 7.954 0.525 6.961 9.938
The older dependency
ratio Ln0dr 465 2.537 0.219 1.903 3.122
Population density Lndenp 465 7.714 0.595 5.226 8.749
Urbanization ratio Lnurb 465 3.91 0.286 3.037 4.495
Percentage of greenery
coverage Lngre 465 3.609 0.183 2.89 4.522
***income not considered since a lot of parents buy houses for their kids and as long as you have local hukou, no matter your income is , unless you do not have income, you can loan to buy houses. Limitation more depend on hukou rather than incomes 5.4.Model Construction
Based on the above analysis of the status quo of population aging and housing prices, the estimation is multi variables correlation to housing prices with fixed effects. Since the data is for the same location modifying the overtime period. The model is constructed as follows:
t
In the equation, i represents the province and t represents the year.
: the dependent variable, which represents the housing price.: the independent variable, which represents the aging population. : the residual term.
: the intercept.
: the coefficient of the population aging indicator. : a vector of the selected control variable.
The control variables include urbanization rate, population density, and green coverage rate. Beta is the estimated coefficient.
The assumption is that the control variables do not change overtime, so for better results, the model uses a fixed effect.
Possible control variables that eliminated from this study are :
Income per capital : Due to Chinese culture, parents may buy houses for their kids, citizens not all take loans from bank for their houses payments. The income per capital is not considered in this study
population growth : the population growth will be presented by population density, since the growth of total population will increase the density of population.
foreigner buyers: China has strict rules on foreigners buying real estates. The amount is small enough to eliminate in this study.
6.
Empirical Model and Result
6.1.Stationarity analysis
In this thesis, unit root tests are carried out on each variable. The unit root test of the homogeneous panel and the unit root test of the heterogeneous panel was carried out respectively, and the results of the two were combined for comprehensive analysis. The heterogeneous panel is for limitation study on any factors this study may be missing that also affect the housing price. The homogeneous panel is chosen since the model is Specifically, this paper uses Levin-Lin-Chu test and Fisher-ADF test. The results are shown in the table below.
The Levin-Lin-Chu and Fisher-ADF test are strong panel data unit root tests. For fixed effects, the study needs to do a unit root test to verify the stationary of variables in time series. The LLC test is for the assumption process that only has a common unit root, while the ADF test assumes an individual common unit root. If the study passes these two tests, then the control variables in this study should not be considered stable over time. Hence fixed effects should change to random effects in modelling.
Table 4 Levin-Lin-Chu test and Fisher-ADF test LLC Prob Fisher-ADF Prob Lnhp -6.36 0 98.973 0.002 Ln0dr -8.318 0 113.623 0 Lnind -11.261 0 216.52 0 Lndenp -8.991 0 120.634 0 Lnurb -34.27 0 422.076 0 Ingre -9.818 0 150.092 0
It can be clearly seen from the above table that each p-value of the LLC test rejects the null hypothesis at the 1% level, it also passed the Fisher-ADF test. It can be seen that at the 1% significance level, the first-order differences of all variables are stable. 6.2.Cointegration analysis
The effects of population aging on housing prices could be a short-term strike or a long-term. Since this study uses fixed effects on modelling. The Pedroni test was
chosen because of its comprehensiveness. The null hypothesis is that there is no cointegration link between the variables. The relevant verification results are shown in the following table, and the results show strong evidence there is a stable and balanced relationship between each variable.
Table 5 Pedroni test
Statistic Prob
Modified Phillips-Perron t 9.027 0.000
Phillips-Perron t -12.427 0.000
Augmented Dickey-Fuller t -19.281 0.000
6.3.Analysis of regression results
When analyzing the panel data, there are two kinds of data regression results. One is fixed effect regression (FER), which means that from the perspective of time, the marginal impact of independent variables and dependent variables in the panel data regression model is the same (Shaver, 2019). While the other result is random effect regression (RER) refers that the change of the dependent variable depends not only on the error term but also on the intervention measures of the research object, also known as heterogeneity (Rudemo, 1989). Hausman test is to test whether the individual effect or time effect of the model is correlated with explanatory variables (Arellano, 1993). This part is going to test whether the aging population is related to housing prices. Table 6 Hausman Test
Test Summary Chi-Sq. Statistic Prob.
Explanatory Variable
Regression 1 Regression 2
Fixed Effect Random Effect
Ln0dr 0.809*** 0.817*** LnHp (-1) 0.302*** 0.304*** LnDenP 0.305*** 0.340*** LnUrb 0.205*** 0.193*** LnGre 0.591*** 0.623*** R-squared within 0.450 0.450 F-test F(30,432) = 55.08 Prob < F
***means the value is significant on the level of 1%
The p-value in this result is 0.000 shown in the test summary of the cross-section random test which is smaller than 0.01. This result means we need to reject the null hypothesis at significant less than 1%. Since the null hypothesis of the Hausman test is the panel data has random effect regression. Rejecting this hypothesis signifies the model has the fixed effect regression. The fixed effect considers control variables do not change over time. Which may not be accurate. The Muslim population of China has raised (Triloki Nath Sharma, 1989). The house consumption behaviors of Muslim people may be different from others. Spurious relationships such as local income and land price, people’s annual travels for business are omitted variables in this study. People may also purchase houses in popular tourist areas for hospitality. This was not considered in this study.
This result also shows us population aging has a significant negative impact on housing prices. 0.809 is the coefficient of the Ln0dr with regression 1, which means when population aging increases as one unit, housing prices will increase by 0.809 units. And after calculation, 0.809 is significant on the level of 1%. This positive
relationship is consistent with the results of the theoretical part. The F-test is the significance test of the regression equation, indicating whether the relationship between the explained variable and the explanatory variables in the model. With the result, the probability is smaller than the F value. We need to reject the hypothesis as well. It is a double check to the Hausman test.
Improvements:
The study lacks consideration for house purchases for business purposes. People may buy houses to make money from the rental business. Those houses in popular tourist areas are considered business houses. It can be added by considering control variables such as travelling populations. The city with a high travel rate should logically have a high demand for house rentals.
The population density may change over time if the government passes bills such as nominating a city to be a municipality directly under the Central Government. Recently the government changed Hainan from a normal city to a Special Administrative Region just like Hong Kong. Then this city will have more policy independence and open markets. More jobs will be created by this kind of policy and it will change the current population density.
6.4.Robustness test
The generation of Gaussian mixture models (GMM) is mainly used when the strict assumption of the least square method is not established (Bond, 2002). For example, the explained variables can affect the explanatory variables in turn, called simultaneity (Bellemare, 2017). In this case, high housing prices will lead to the outflow of the labour force, thus changing the regional population age structure. The probability distribution of data is unknown so that the maximum likelihood estimation cannot be used (Gallant,1987).
There are many factors affecting the housing price, and the impact of the previous housing prices on the current period is also significant (San,2013). Thus, we added the last housing price as a new variable to ensure the robustness of the housing price on the basis of the above variables. The new function is:
t
Where is the first-order lag and is the coefficient of the first-order lag. Table 7 Sys-GMM test
Variable Coefficient StandardError Probability
Lnhp (-1) 0.693 0.071 0.000
Ln0dr 0.995 0.282 0.000
Lndenp 0.021 0.005 0.000
Lnurb 0.599 0.220 0.007
Lngre 0.033 0.022 0.140
According to sys-GMM regression analysis, the first-order lag of housing price has a significant relationship with the current housing price. For every unit increase in the previous prices, the current prices will increase by 0.693 units. People will focus on last year’s house prices. This reflects that when people buy a house, they expect the housing prices will increase in the future, which promoting people to buy houses lead to the increasing demand for housing and the prices rise.
7.
Conclusion
This paper makes a basic theoretical analysis on the relationship between population aging and housing prices in China and makes an empirical analysis by establishing an economic model on the basis of the basic theoretical analysis.
At the beginning of the paper, we explained the aging situation of Chinese society. As said in the introduction part, China is not only the most populous country in the
world, but it is also one of the fastest aging countries. In addition, the rapid rise of the housing price in China has affected residents’ living conditions. Therefore, we discussed the relationship between aging and housing prices in this paper. According to previous research, we preliminarily assume that aging will affect the housing prices through the relationship between supply and demand and there is a positive correlation between the aging population and housing prices.
From the study and analysis of data, the aging population does increase house prices, but it is not the only factor that increases housing prices. The relation between the aging population and house price is positive but the correlation is not strong enough to claim the aging population is the main factor. There should be other factors that also affect house pricing. Using the aging speed of a country as the main indicator for house price prediction is not effective.
After the theoretical discussion, we find that the difference in age has different effects on the housing price. Young people tend to buy houses, but the problem is that the young cannot afford them. Middle-aged people have a family and a certain amount of savings. They choose to buy a bigger house for their family with children. The old people generally prefer to live in a new house with a better environment. We also made a distinction in the method section, that is, those aged 65 and above will be accounted as the elderly. The OLG model is also mentioned in the theoretical part, and scholars have previously conducted research on the positive correlation between the aging population and housing price based on this model. The OLG model mainly discusses the issues of age and consumption power. Research shows that the higher the age, the higher the consumption power. Therefore, aging will lead to an increase in the number of people who are willing to buy houses. In real estate economics, the impact of consumer supply and demand on housing prices is discussed in detail. It makes a comparison between the aging population and the housing price in the UK and finds that there is a positive correlation between the two. According to the economic rules, as consumer demand increases, the supply of houses decreases so the housing prices rise.
We used 465 data from 31 provinces over 15 years. The stationarity analysis,
cointegration analysis, Durbin-Wu-Hausman test and System Generalized Method of Moment were conducted in the empirical analysis part. Thus, the following
conclusions were drawn:
From the Fisher-ADF test, we verify the correlation between aging and housing price, that is, aging does have an impact on housing price. The result of the Pedroni test shows variables have stable long-term relationships. From the Hausman test, we have the result that the relationship between the aging population and housing prices is positive. If the percentage of older people increases, the housing price will increase as well. The impact of the previous housing prices on present housing prices is positive. In the condition of rising housing prices, residents expect that housing prices will go up further. Thus, high housing prices in the last period will increase the housing prices in the current period. Governments play a major role in house prices since they can use policy to force the price to be stable. The governments can control the supplies of houses by controlling the land resources. A future study can be how the government's policy changes the price of houses to fight the price increase due to aging effects.
This thesis only studies the relationship between supply and demand of real estate. China's real estate policy regulates real estate frequently, and the impact of policy intervention on house prices is also very significant, and this paper does not consider policy intervention on real estate prices. Policies keep changes over time which was not considered in this study since this study uses fixed effects on modeling. In terms of the selection of indicators, this paper tries its best to start from the relationship between population aging and house prices, trying to find the most appropriate control variables, but there are still omitted variables, such as industrial structure, employment situation, and income level of residents.
Limitation and Suggestion :
The data collection on data from Chinas is hard since the only reliable source is from government statistic departments. Since the governments does not allow
investigation on rural area for population data collection and the income wages are collect using method of taxes payed. However, the e-payment allowed small business to do business without auditing on tax. The future study on picked area would improve this situation. Such as, only pick up data from top 10 income level cities. Hukou system, which only allow local to buy houses and two child policy, house purchase policy for foreigners are all hard to control in the current model which definitely effects the results. A country with more open and free market would be better data sources such as India. India has similar data amount but democratic systems.
Another study would be study on minority groups area such as Tibet and Xinjiang since minorities do not have child birth limitations. So the study on those area would be more clear.
Japan, South Korean are better example for study since they both East Asian and mono ethic groups. Both countries are developed and aging. A study on Japan and South Korean together would give enough data.
Reference List
Arellano, M. (1993). On the testing of correlated effects with panel data. Journal of econometrics, 59(1-2), 87-97.
Bellemare, M. F., Masaki, T., & Pepinsky, T. B. (2017). Lagged explanatory variables and the estimation of causal effect. The Journal of Politics, 79(3), 949-963. Benson, E.D., Hansen, J.L., Schwartz, A.L. et al. (1998) Pricing Residential Amenities: The Value of a View. The Journal of Real Estate Finance and Economics 16, 55–73. Https://doi.org/10.1023/A:1007785315925
Besley, T., & Ghatak, M. (2010). Property Rights and Economic Development. Handbook of Development Economics (pp. 4525-4595). Retrieved from https://doi.org/10.1016/B978-0-444-52944-2.00006-9.
Bloom D. E/ Williamson J. G(1998). Demographic Transition and Economic Miracles in Emerging Asia. The World Bank Economic Review. Vol. 12 (3), 1998, pp. 419-455
Bond, S. R. (2002). Dynamic panel data models: a guide to micro data methods and practice. Portuguese economic journal, 1(2), 141-162.
Chai, L., Han, Z., Liang, Y., Su, Y., & Huang, G. (2020). Understanding the blue water footprint of households in China from a perspective of consumption expenditure. Journal of Cleaner Production, 262, 121321.1010Samuelson, Paul A. (1958). "An exact consumption-loan model of interest with or without the social contrivance of money". Journal of Political Economy. 66 (6): 467–482. Doi:10.1086/258100.
Chan, K. W., & Zhang, L. (1996). The Hukou system and rural-urban migration in China: Processes and changes. Chinese Sociology & Anthropology, 29(1), 15-26. Chamon, M. D., & Prasad, E. S. (2010). Why are saving rates of urban households in China rising?. American Economic Journal: Macroeconomics, 2(1), 93-130.
Chen Y/ Gibb K/ Leishman C. Et al (2012). The Impact of Population aging on House Prices:A Micro-simulation Approach, Scottish Journal of Political Economy, Retrieved from https://ideas.repec.org/e/c/pwr21.html
Chen, E. (2018). ANALYZING CHINA’S REAL ESTATE BUBBLE. International Conference on Economics and Management Innovations, Retrieved from https://www.researchgate.net/publication/330442799_ANALYZING_CHINA'S_RE AL_ESTATE_BUBBLE.
De Haan, A. (1999). Livelihoods and poverty: The role of migration‐a critical review of the migration literature. The journal of development studies, 36(2), 1-47.
Drolet, A., Jiang, L., Pour Mohammad, A., & Davis, C. (2019). The influence of aging on consumer decision‐making. Consumer Psychology Review, 2(1), 3-16. Engelhardt G.V./ Poterba J.M (1991). House Prices and Demographic
Evans, G., Hutton, C., & Eng, K. K. (Eds.). (2000). Where China meets Southeast Asia: Social and cultural change in the border regions (Vol. 22). Institute of Southeast Asian Studies.
Feldstein, M. (1976). Social security and saving: the extended life cycle theory. The American Economic Review, 66(2), 77-86.
Gallant, A. R., & Nychka, D. W. (1987). Semi-nonparametric maximum likelihood estimation. Econometrica: Journal of the econometric society, 363-390.
Galor, O. (November 1992). A Two-Sector Overlapping-Generations Model: A Global Characterization of the Dynamical System. Econometrica, 60(6), 1351-1386. Retrieved from https://doi.org/10.2307/2951525.
Galor, Oded; Ryder, Harl E. (1989). "Existence, uniqueness, and stability of equilibrium in an overlapping-generations model with productive capital". Journal of Economic Theory. 49(2): 360–375. Doi:10.1016/0022-0531(89)90088-4
Green R./ Hendershott H (1996), Age, Housing Demand, and Real House Prices,
Regional Science and Urban Economics, Retrieved from
http://www.sciencedirect.com/science/article/pii/016604629602128X
Green, R. K., & Lee, H. (2016). Age, demographics, and the demand for housing, revisited. Regional Science and Urban Economics, 61, 86-98.
Gyourko, J. (September, 2009). Housing Supply. Annual Review of Economics (Vol.
1st ed., pp. 295-318). Retrieved from
https://doi.org/10.1146/annurev.economics.050708.142907.
Hilbers, Paul and Lei, Qin and Stausholm Zacho, Lisbeth (September 2001). Real Estate Market Developments and Financial Sector Soundness (IMF Working Paper No. 01/129th ed.). Retrieved from https://ssrn.com/abstract=879898.
Hu, M., Wu, L., Xiang, G. and Zhong, S. (2021), "Housing prices and the probability of marriage among the young: evidence from land reform in China", International
Journal of Emerging Markets, Vol. ahead-of-print No. ahead-of-print. https://doi.org/10.1108/IJOEM-09-2020-1116
Hansen, E., & Gottschalk, G. (2007, February 18). What Makes Older People
Consider Moving House and What Makes Them Move? Taylor & Francis.
https://www.tandfonline.com/doi/abs/10.1080/14036090600587521
Klopp, J. M., & Petretta, D. L. (2017). The urban sustainable development goal: Indicators, complexity and the politics of measuring cities. Cities, 63, 92-97.
Lee, R., Mason, A. Some macroeconomic aspects of global population aging.
Demography 47, S151–S172 (2010). Retrieved from
https://doi.org/10.1353/dem.2010.0002.
Lee, Ronald. 2016. “Macroeconomics, Aging and Growth.” In Handbook of the Economics of Population Aging, edited by John Piggott and Alan Woodland. Amsterdam: Elsevier, 59–118.
Ling, Z., & Jiang, Z. (1996). Public works and poverty alleviation in rural China. Nova Publishers.
Mankiw, N.G./ Weil D.N (1989). The Baby Boom, the Baby Bust and the Housing Market, Regional Science and Urban Economics, Retrieved from https://link.springer.com/article/10.1007/s11146-004-4830-z
Pagourtzi, E., Assimakopoulos, V., Hatzichristos, T., & French, N. ( 1 August 2003). Real estate appraisal: a review of valuation methods. Journal of Property Investment
& Finance, 21(4), 383-401. Retrieved from
https://doi.org/10.1108/14635780310483656.
Paul S. (2013). Real Estate Economics. Real estate markets. (pp. 39-58). Retrieved from https://doi.org/10.1080/13574809.2013.772848.
Rosenberg, M., & Everitt, J. (2001). Planning for aging populations: inside or outside the walls. Progress in planning, 56(3), 119-168.
Rudemo, M., Ruppert, D., & Streibig, J. C. (1989). Random-effect models in nonlinear regression with applications to bioassay. Biometrics, 349-362.
San Ong, T. (2013). Factors affecting the price of housing in Malaysia. J. Emerg. Issues Econ. Financ. Bank, 1, 414-429.
Shaver, J. M. (2019). Interpreting interactions in linear fixed-effect regression models: When fixed-effect estimates are no longer within-effects. Strategy Science, 4(1), 25-40.
Statista (2021). Aging population in China - statistics & facts. Retrieved from https://www.statista.com/topics/6000/aging-population-in-china/
T Gore, D Nicholson (1991). Models of the Land-Development Process: A Critical
Review. (Original work published 1991). Retrieved from
https://doi.org/10.1068%2Fa230705.
Takáts E (2012). Aging and House Prices, Journal of Housing Economics, Vol.21, No.2. Minds, M. F. (n.d.). China's birth rate falls to historic low. Retrieved from https://www.dw.com/en/chinas-birth-rate-falls-to-historic-low/a-47166326
Triloki Nath Sharma. (1989) The predicament of Lhasa Muslims in Tibet. Institute of Muslim Minority Affairs. Journal 10:1, pages 21-27.
U.N. (1986). Vienna Convention on the Law of Treaties between States and International Organizations or between International Organizations. Legal.Un.Org. UNFPA. (n.d.). aging in the Twenty-First Century: A Celebration and A Challenge. Retrieved 2012, from https://www.unfpa.org/sites/default/files/pub-pdf/UNFPA-Exec-Summary.pdf
United Nations, Department of Economic and Social Affairs, Population Division (2019). World Population aging 2019: Highlights (ST/ESA/SER.A/430).
Van Doorn, L., Arnold, A., & Rapoport, E. (2019). In the age of cities: The impact of urbanisation on house prices and affordability. In Hot Property (pp. 3-13). Springer, Cham.
Visa, A. (2020). Can Foreigners Buy a House in China? . Retrieved from http://anychinavisa.com/news/can-foreigners-buy-a-house-in-china/
Wang, M (2017). Governing the housing market in post-reform China: Price controls and regional inequalities. In: Sengupta, U, Shaw, A (eds.) Trends and Issues in Housing in Asia: Coming of an Age. London, New York: Routledge, pp. 232–249. Wang, M. (2018). ‘Rigid demand’: Economic imagination and practice in China’s urban housing market. Urban Studies.
Wang, X. (2020). Permits, Points, and Permanent Household Registration:
Recalibrating Hukou Policy under Top-Level Design”. Journal of Current Chinese Affairs, 1868102619894739.
Yu Zhang/ Haiyan Jin / Yue Xiao/Yumin Gao (2020). What are the Effects of Demographic Structures on Housing Consumption?: Evidence from 31 Provinces in China. Mathematical Problems in Engineering, Retrieved from https://www.hindawi.com/journals/mpe/2020/6974276/.
Z.Z. (2018, March 12). Characteristics of Agricultural Economy during the
Formation of Ancient Chinese Civilization.
Z.Y., S.W., & Y.S. (2017, March). Monetary Policy, House Prices, and Consumption in
China:A National and Regional Study. INTERNATIONAL REAL ESTATE REVIEW.
https://www.um.edu.mo/fba/irer/papers/current/vol20n1_pdf/02.pdf
Zeng, Y., & Hesketh, T. (2016). The effects of China's universal two-child policy. The Lancet, 388(10054), 1930-1938.