Heated Air Gaps
A Possibility to dry out Dampness from Building Constructions
By
1. Introduction
1.1 Water damages
Swedish building constructions are generally more sensitive to water damage, compared to corresponding constructions in southern Europe. The constructions in the latter countries are nowadays generally built by concrete and this material is more robust against such damages. Bathrooms are also supplied with a floor drain in Sweden and such a drain is seldom installed within southern Europe, (Arfvidsson et al 2005). Poorly mounted floor drains are considered to be a risk construction in Sweden, (Andersson & Kling 2000).
Water damage and mould
Water damage could cause mould growth if the damage results in a high RH within the construction. In an exterior wall of a bathroom, even a small amount of water, passing through a damp-proof membrane and trapped by the vapour barrier, may cause mould growth on gypsum boards in the construction,
(Jansson 2005). Mould needs satisfactory temperature, enough time and at least 75 % RH to grow and when the humidity rises, the growth of the mould will become more rapid, (Sedlbauer 2001, Viitanen 2002). The level of 75% RH is also considered to be the critical moisture limit according to BBR (Boverkets Byggregler 2006).
In Sweden, 0.7 % of all buildings are harmed by water damages yearly (Länsförsäkringar Bengt G. Johansson, personal communication) and small water damage can be hard to detect. Building construction is often rather tightly built and there are situations when mould growth is not noted, many mould toxins are also odourless. (University of Lund Lennart Larsson, personal communication).
Costs of water damages
Vattenskadecentrum, a Swedish organisation, run by insurance companies and building trade associations, that survey water damages, estimated that water damages cost more than 5 billions SEK in the year of 2005. (Ström et al 2005). This sum includes:
1. Actual costs for the insurance companies 2. Estimated costs regarding private deductibles
3. Estimated costs for water damages in the big public real-estate companies This sum does not include:
1. Water damage costs for buildings owned by the public, as hospitals, schools and other official buildings (Ström et al 2005)
3. Health costs caused by water damage as allergy and asthma.
Investigations performed by Emenius (2003) and Hägerhed Engman (2006) show that there are a clear correlation between water damages and asthma/allergy.
4. Costs caused during the building process and paid by the building enterprises. This cost is also difficult to estimate and there are no estimations yet found, calculated by the building enterprises, although many builders are committed to solve the problem (Tutti 2008).
1.2 Robust constructions of today
The author of this thesis claims that a majority of Swedish dwellings are fragile concerning water damages because moisture may become trapped within the building constructions. There are though some good examples to show, the Vaska concept, which is a regular building concept and also a number of ventilated constructions for floors and bathrooms.
Vaska concept
The Vaska concept was developed by the county authority of Västerbotten and Länsförsäkringar/Västerbotten during the eighties. This method implies
systematization of water protection and specially a secure installation of pipes (Länsförsäkringar/Vaska 2006) The building costs increase in price by 1 %, but the water damages caused by broken pipes and floods in kitchens are reduced to a minimum (Andersson & Kling 2000).
The ventilating plastic membrane
This kind of membrane is purchased by different manufacturer, (see
www.floordry.se and www.isola-platon.se ).The membrane creates an air gap of about 5 mm above the water damaged floor and gives the physical preconditions for construction air ventilation, which should be executed by mechanical
appliances. The ventilation rate in this type of system was investigated scientifically by Hagentoft and Holmberg (2005).
The ventilated prefabricated bathroom
This method is used to build prefabricated bathrooms, which are installed inside an old bathroom, also with possible water damage (www.inwall.nu,
www.rumirum.se,). The method is constructed with an air-gap between the old and the new bathroom, where ventilating air can circulate. Construction damp could dry after the prefabricated bathroom is installed. The time for this drying could, according to experience, be at about 6 to 9 months.
The floor on joists, (Nivell floor)
The floor is built on joists attached to the structural slabs of the building and creates an air-gap below the insulation, (www.nivellsystem.se). The floor system gives the physical preconditions for construction air ventilation, which also could be executed by mechanical appliances. The manufacturer estimates that the air flow should be between 0.15-0.20 l/m2·s.
1.3 Air gap method
The air gap method is hereby introduced as a modification of the common way of building indoor walls and floors. The method is a building construction design of walls and floors, with an air gap and a heating cable. The air gap method opens for convective airflows that can remove dampness that has entered the construction in case of water damage.
Close research fields
The air gap method uses slow air movements to obtain a dry out effect. The author have not yet found any reports from scientific studies that deal with the dry out effect of a heated air gap. There are however at least five other research fields where slow air movements are of interest:
1. Air flows inside air gaps inside a building envelope. These air gaps systems play an important role of drying exterior walls. This has been shown both by experiments and mathematically (Davidovic et al 2006, Gudum 2003) and is also the topic in ground level education material, (Johannesson 2006). The geometry of this type of air gap resembles the studied air gap of this thesis, but the air gap of the exterior wall has no heating cable. The temperature in these air gaps differ from the outdoor temperature because of solar radiation on the wall etc and this difference in temperature causes an air flow as well as wind pressure does.
2. Laminar convection in heated vertical channels is of interest in electronic cooling applications, (Burch et al 1985, Campo et al 2005 and Androzzi et al 2002). These articles treat wall conduction, wall and air gap
temperatures and air velocity, but the geometry of the gap and the amount of power added differ much from what is used in the air gap method. 3. Natural convections occurring in a heated column of air, is described by
the stack equation (Skistad 1995, Ashrae 1989) and this is further
investigated in paper 2. Foster (1987) has compiled a number of different expressions that describes this effect.
4. Convective air flow is the reason for thermal plumes around persons and electrical devices in dwellings. This flow has been measured
(Mierzwinski 1981, Popiolek 1981) as well as calculated (Mundt 1996, Mundt in Skistad 2002). These works are also interesting as they relate the flow with an estimated power from a line source.
5. The air flow in ventilated floors caused by fans has also been investigated. The generated air flow in these systems was found to be 5.5 m3 per hour for a floor that measured 99 m2, which is the same as 0.015 litres of ventilating air per m2 and second (Hagentoft & Holmberg 2005).
Studies in this thesis
This licentiate thesis contains two accepted articles, paper 1: “Air Gaps in Building Construction avoiding Dampness and Mould” by af Klintberg, Björk and Johannesson and paper 2:”Air Gap Method: Measurements of Air Flow inside Air Gaps of walls” “, by af Klintberg and Björk. Paper 1 describes that the air gap manage to drain and dry out a flooded intermediate floor in 13 days and also that the method prevents all mould growth provided that the indoor RH is not too high. Paper 2 quantifies the air flow inside a wall built by the air gap method and shows that it is a relation between the power of the heating cable, the increased temperature in the wall and the air flow.
The work of paper 1 is a full scale study of a flooding in an intermediate floor, which is not easy to control and make fully reproducible. The amount of water removed by drying from the ceiling board is not quite known, neither how much that was drained out, nor how much water actually was transported away by the air gap method. Paper 2 treats only with a ventilated wall; although a combined floor and wall construction would be a more interesting case.
Hence there are two more parts to investigate in this context:
1. Is it really established an air flow in a combined wall and floor construction in this air gap system?
2. If so, can the dry out effect from such a flow be quantified?
To answer the questions above and to complement the results of paper 1 and 2, this thesis also includes results from more controlled experiments relating to a “slab on ground” construction with thermal insulation placed on top of the slab. This is a type of small house construction that was built during the seventies and eighties, but is nowadays considered being a risk construction (Harderup 1991). There is an obstacle in this context relating to the air flow measurements. In the second paper in this thesis it was found difficult to register really slow air movements and such movements in a combined wall and floor construction might be hard to detect.
General hypothesis
The general hypothesis for this thesis is that the air gap method makes it possible to drain and evaporate dampness after water damage without
demolishing the construction, while keeping RH at a safe level, less than 75 %, during this process.
Limitations
This work deals only with small detached houses, built with a wooden frame. How the air gap method work in an apartment building will be investigated in coming articles.
2. Nomenclature
Latin
Abbreviation Explanation Denomination
a Constant in saturation moisture content equation -
b Constant in saturation moisture content equation -
C Thermal capacity J/K
I Current of heating cable A
l Length of heating cable m
M Mean value of molecular weight of air kg/kmol
mOD Owen dry mass kg
mW Mass of water in moist material kg
n Constant in saturation moisture content equation -
Nr Experiment number
p Number of heating cables -
ps Air pressure at saturation point Pa
Q Air flow m3/s
QD Total air flow per meter wall during 24 hours m3/24 h
q Power from the heating cable, calculated by equation (1) W/m
qHC Power of heating cable, stated by manufacturer W/m
R General gas constant J/kmol·K
RH Relative humidity of air %
T Temperature oC
TAG Average temperature in air gap oC
TR Average temperature in room oC
∆T Temperature difference between TAG and TR oC
Greek
ρ Air density kg/m3
vA Moisture content at air inlet, point A kg/m3
vs Vapour concentration at saturation point kg/m3
vx Actual vapour concentration at each measurement point A to M kg/m3
3. Experimental studies
3.1 General
In order to evaluate the performance of the air gap method, measurements were made in a full scale construction in a laboratory hall close to Stockholm, during summertime conditions, which implies a comparably high RH. This section will present the experimental set up for several aspects of drying and air flow inside a construction built by an air gap system. Thus this section is divided into seven parts:
• Construction of the air gap system • Heating cables
• Calibration of moisture ratio meter • Drying of a flooded intermediate floor • Investigation of mould growth
• Temperature and air flow in a vertical air gap • RH studies in a “slab on ground” construction
3.2 Construction of the air gap system
This section of the thesis describes the common way of building a wooden detached house modified with the air gap system. The air gap system is built with inlets, air gaps, slits and outlets, shown in Figures 1 to 3 and 5 to 7. Some of the air gaps are already parts of a general construction method while others are provided by a simple modification of common methods.
It may be observed that all the figures showing construction parts are drafts without dimensioning and they are not suitable as basis for building. The air gap method is furthermore patented.
Figure 1 Schematic cross-section of an air gap system in a small detached wooden house, used in paper 1. The circles display three different applications found in Figures 3 and 6.
The general idea is that air gaps in floor construction and walls are connected with each other and have air inlets and outlets at connections between floor and wall and at connections between ceiling and wall. The ventilating air is interior air, which goes through the building construction driven by thermals caused by an electrical heating cable inside the vertical gap. The ventilation direction is shown as arrows in Figures 2 to 3 and 5 to 7 and is described more in detail in papers 1 and 2.
Air gap Figure 6
Intermediate floor construction
The type of floor used in this study, has wooden joists as the main load bearing part. Battings of mineral wool (for acoustic insulation) lie between the joists. There is an air gap, see Figure 2 point 15 and Figure 3 point 18, between floor chipboard and the mineral wool insulation, since this insulation is not as thick as the height of the floor joists. This air gap is parallel to the joists.
Figure 2 Cross-section of a spine-wall and floor used in paper 1. Arrows show the direction of ventilating air
The insulation rests upon secondary spaced boarding and there is also an air gap, see Figure 2 point 18 and Figure 3 point 13, between the battens of the spaced boarding. This air gap is perpendicular to the floor joists. This intermediate floor construction is combined with slits where the ventilating air may enter, see Figure 2 point 14, Figure 3 point 16 and it is used in the full scale studies of paper 1.
3
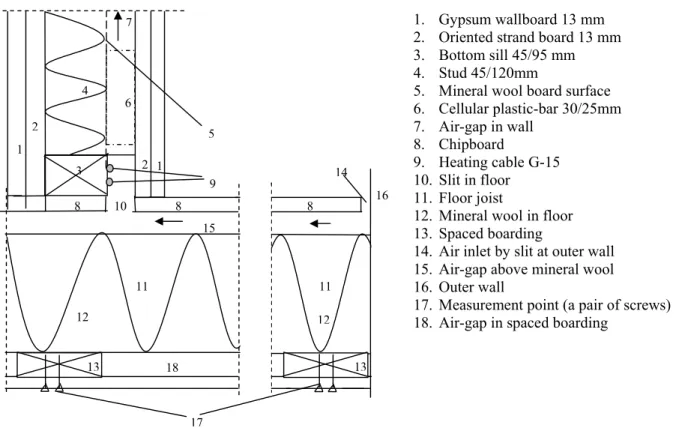
1. Gypsum wallboard 13 mm 2. Oriented strand board 13 mm 3. Bottom sill 45/95 mm 4. Stud 45/120mm
5. Mineral wool board surface 6. Cellular plastic-bar 30/25mm 7. Air-gap in wall 8. Chipboard 9. Heating cable G-15 10. Slit in floor 11. Floor joist
12. Mineral wool in floor 13. Spaced boarding
14. Air inlet by slit at outer wall 15. Air-gap above mineral wool 16. Outer wall
17. Measurement point (a pair of screws) 18. Air-gap in spaced boarding
17 9 5 1 15 8 8 12 12 16 11 11 14 1 1 2 2 4 8 6 10 7 13 18 13
Figure 3 Cross-section of an interior wall and intermediate floor, used in paper 1. Arrows show the direction of ventilating air.
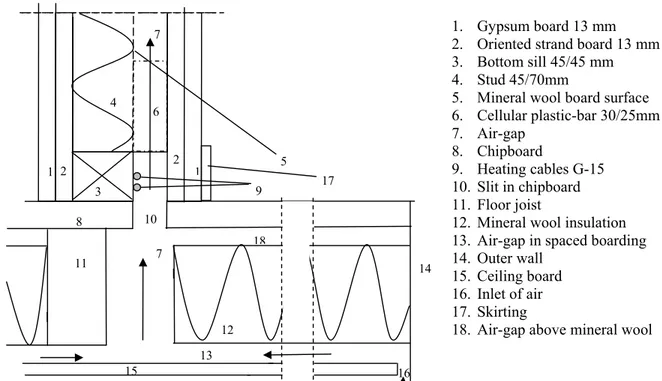
1. Gypsum board 13 mm 2. Oriented strand board 13 mm 3. Bottom sill 45/45 mm 4. Stud 45/70mm
5. Mineral wool board surface 6. Cellular plastic-bar 30/25mm 7. Air-gap 8. Chipboard 9. Heating cables G-15 10. Slit in chipboard 11. Floor joist
12. Mineral wool insulation 13. Air-gap in spaced boarding 14. Outer wall
15. Ceiling board 16. Inlet of air 17. Skirting
18. Air-gap above mineral wool
1 2 2 1 3 4 8 6 9 5 10 11 13 7 7 14 15 16 12 18 17
Constructions with slab on ground
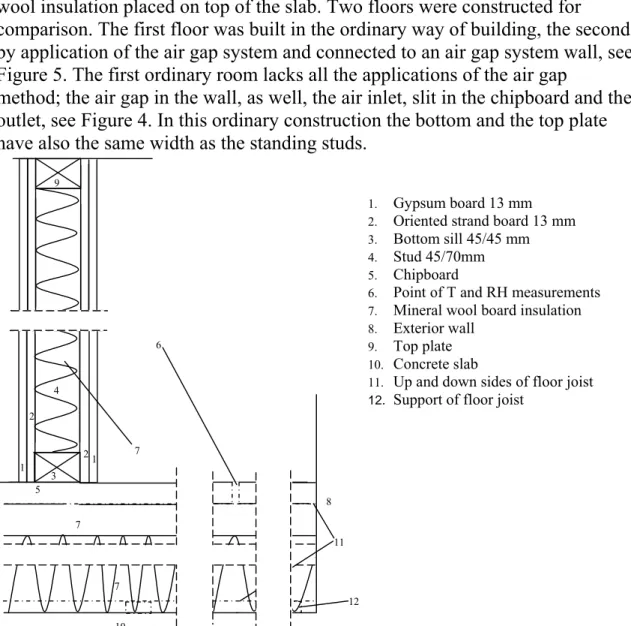
This floor is constructed with a “slab on ground” foundation and with mineral wool insulation placed on top of the slab. Two floors were constructed for comparison. The first floor was built in the ordinary way of building, the second by application of the air gap system and connected to an air gap system wall, see Figure 5. The first ordinary room lacks all the applications of the air gap
method; the air gap in the wall, as well, the air inlet, slit in the chipboard and the outlet, see Figure 4. In this ordinary construction the bottom and the top plate have also the same width as the standing studs.
Figure 4 Cross-section of wall and bottom floor by an ordinary construction of slab on ground with thermal insulation above the slab.
The second floor has a construction that is similar to Figure 2, the air gap is situated above the mineral wool board insulation and the inlet is in the
connection between floor and wall. The only difference is that the insulation lies upon the concrete slab in this case.
These two building constructions were used in the RH studies of a “slab on
1. Gypsum board 13 mm
2. Oriented strand board 13 mm 3. Bottom sill 45/45 mm 4. Stud 45/70mm 5. Chipboard
6. Point of T and RH measurements 7. Mineral wool board insulation 8. Exterior wall
9. Top plate 10. Concrete slab
11. Up and down sides of floor joist 12. Support of floor joist
7 1 2 4 5 7 7 7 10 8 6 11 12 2 1 3 9
Figure 5 Cross-section of wall and bottom floor construction by the air gap method of the “slab on ground” construction with thermal insulation above the slab. Arrows show the direction of ventilating air and moisture transport.
Wall construction
Ordinary wall
There are two types of walls in a wooden detached house, the exterior wall and the interior wall. The interior wall might be a load bearing spine wall or a
common light wall. The inner part of the exterior wall could be supplied with an air gap, but this construction is not investigated in this thesis and therefore not described here. The spine wall and the light wall are built in the same way, but differ often in thickness as the spine wall is load bearing. Interior walls are built with bottom sill, top plate, standing studs and mineral wool for acoustic
insulation between the studs.
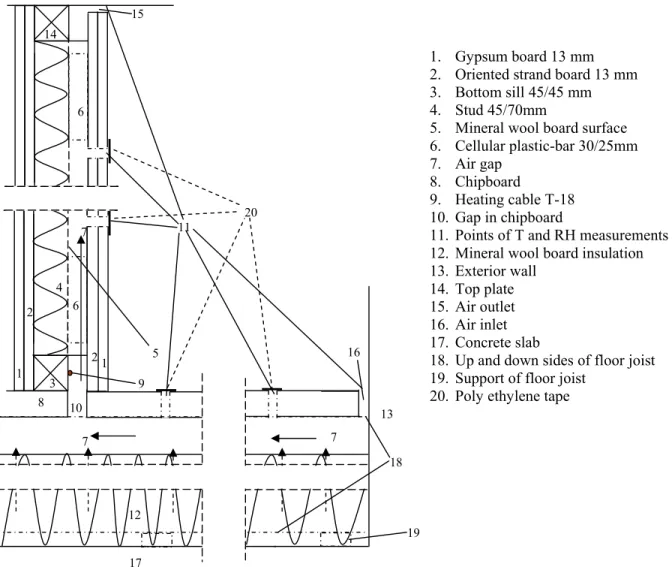
1. Gypsum board 13 mm 2. Oriented strand board 13 mm 3. Bottom sill 45/45 mm 4. Stud 45/70mm
5. Mineral wool board surface 6. Cellular plastic-bar 30/25mm 7. Air gap
8. Chipboard
9. Heating cable T-18 10. Gap in chipboard
11. Points of T and RH measurements 12. Mineral wool board insulation 13. Exterior wall
14. Top plate 15. Air outlet 16. Air inlet 17. Concrete slab
18. Up and down sides of floor joist 19. Support of floor joist
20. Poly ethylene tape 9 5 1 2 4 6 7 8 10 12 7 7 17 15 16 13 11 6 18 19 2 1 3 14 20
Air gap wall
Unlike the intermediate floor described above, a common interior wall has no air gap. The mineral wool insulation usually fills all the space between the studs, the bottom sill, top plate and the covering boards and this construction part is rather tight. Thus it is necessary to construct an air gap in the wall that permits an air flow.
The wall of the air gap system is constructed with bottom sill, top plate and mineral wool wall boards that are not as thick as the width of the standing studs in order to create an air gap inside the wall. The mineral boards (for acoustic insulation) are hindered from falling back into the air gap by a number of cellular plastic-bars 100x25x30 mm and a heating cable is attached to the bottom sill. To vary the experimental conditions, two heating cables are used in the tests of this thesis. The outlet of air is situated in the connection of the wall and the ceiling, as shown in Figure 6 point 9.
Figure 6 Cross-section of an interior wall at the ceiling wall connection, built by the air gap method. Arrows show the direction of the ventilating air.
This type of wall is used as a spine wall, see Figure 2 and as a common light wall, see Figure 3. It is used in combination with the floor in paper 1 and in combination with the air gap in the “slab on ground” construction of this thesis.
1. Gypsum wallboard 13 mm 2. Oriented strand board 13 mm 3. Top plate 45/95 mm
4. Stud 45/120 mm
5. Mineral wool board surface 6. Cellular plastic-bar 30/25mm 7. Air-gap, between studs 8. Ceiling 9. Outlet of air 1 2 2 1 3 4 5 6 7 8 9
A wall built by the air gap system can also be built with no air gap connection into the floor. In this case there are connections to the room air at bottom and top of the wall see Figure 7 points 11 and 13. This type of wall is used in paper 2.
Figure 7 Cross-section of air gap wall used in paper 2. The arrows indicate the direction of the ventilating air.
3.3 Heating cables
The heating cables, named T-18 and G-15 are manufactured by Ebeco AB. The intended use for T-18 is to melt ice inside drain pipes and the intended use for G-15 is to perform floor heating. The cables are made of two electrical
conductors embedded in a semiconductor material which resistivity increase with temperature, so the maximum temperature lies in the range of 28-40 oC. The cables are supposed to give different levels of power because of the temperature of the surrounding air “If this air is colder it takes more power to reach the maximum temperature of the cable”, (Ebeco AB, Kent Svensson, personal communication).
The manufacturer also states that T-18 gives a power of 15 W/m ±3 W/m and G-15 a power of 8 W/m ± 2 W/m at room temperature. Each batch (around 3000 meter length of the cable) gives different levels of power, because of minor variations in the properties of the semiconductor material. The G-15 cable was used in paper 1, both cables were used in paper 2 and only the T-18 was used in the RH studies in a “slab on ground” construction.
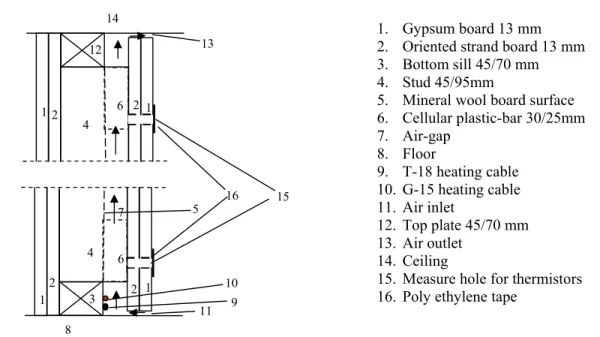
1. Gypsum board 13 mm 2. Oriented strand board 13 mm 3. Bottom sill 45/70 mm 4. Stud 45/95mm
5. Mineral wool board surface 6. Cellular plastic-bar 30/25mm 7. Air-gap 8. Floor 9. T-18 heating cable 10. G-15 heating cable 11. Air inlet 12. Top plate 45/70 mm 13. Air outlet 14. Ceiling
15. Measure hole for thermistors 16. Poly ethylene tape
1 3 2 1 4 6 5 7 10 11 6 2 1 2 1 4 12 13 15 2 9 14 16 8
3.4 Calibration of moisture ratio meter (
Paper 1)
Measure point and device
A measure point in paper 1 of this study is literally a “pair of screws”, which are screwed through the gypsum board ceiling and into the battens of the spaced boarding, see point 17 in Figure 2 and point 4 in Figure 8. The screws are 41 mm long and the distance between them is 25 mm. This measure point is chosen because it will be in contact with the presumably dampest spot in the
experiment; the layer between the gypsum board of the ceiling and the spaced boarding. Any flooding into the floor construction will reach this layer and this water will remain last.
The moisture ratio of a measure point was measured by a moisture meter, “Surveymaster SM” from Protimeter pic. England. This moisture meter uses electrical conductance principles to measure the moisture level of the material between two electrodes and has an instrument scale, which grades moisture ratio from 0 to 100 %. Tests are performed by putting the two pin electrodes from the instrument in contact with the measure point. A value is shown on the display of the instrument after about 10 seconds.
Experiment
It is interesting to investigate which relation a certain reading of the instrument scale has to actual water content. Below the fibre saturation point, at 30 %, the readings indicate the ratio of mW/mOD, where mW is the mass of water in the
material and mOD is the mass of the oven dry weight of the same material.
However there is an uncertainty regarding how readings above 30 % in this equipment should be understood. Above this number, the wooden cells are saturated of water (Ashrae 2005) and it is not known what actually is measured in instrument scale between 30-100%. This experiment was set up at ordinary indoor temperature and RH.
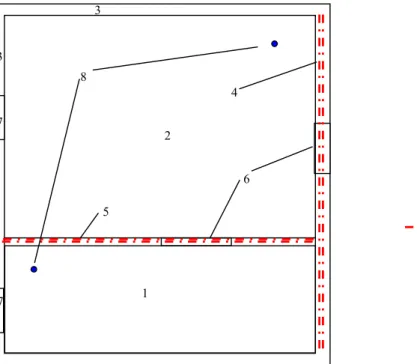
In order to investigate this calibration task, a small part of a gypsum board ceiling was constructed, see Figure 8. The board was provided with six measuring points (a-f), which are “pair of screws” described above.
The area inside the water bank measured 0.125 m2 and the amount of water, 157.8 grams, was chosen so it didn’t spill over the water-bank, see point 3 in Figure 8. The following evaporation of the water was measured both by weighing the board in a lapse of time and by “measurements of the moisture meter” in the following called MMM.
Figure 8 Air Gap Method. Draft of cross-section and plan of ceiling part for calibration of moisture meter, together with six measure points (a-f).
3.5 Drying of a flooded intermediate floor
(Paper 1)
Laboratory apartment
The laboratory apartment for paper 1 was built on 1.2 meter high posts and has a total area of 24 m2. Thanks to the posts, the ceiling beneath the floor is available from a crawl space beneath, see the arrow in Figure 9
Figure 9 Photograph of the laboratory apartment, the arrow points into the crawl space beneath the ceiling.
The apartment is divided into two rooms, “bedroom” 18 m2, and “bathroom”, 6
m2. The walls are 2.5 m high. Intermediate floor, spine wall and interior wall are
1 2 3 1 1. Gypsum board 2. Spaced boarding 3. Water-bank
4. Measure point (a pair of screws)
2 2 4 a b c d e f
constructed by the air gap system described above. The spine wall and the interior wall are provided with two heating cables (G-15) each. As part of the experiment, two holes were drilled into the floor, to be inlets for flooding water. See ground plan Figure 10.
Figure 10 Ground plan of laboratory apartment. Showing places for heating cables and flooding inlets.
Measure points
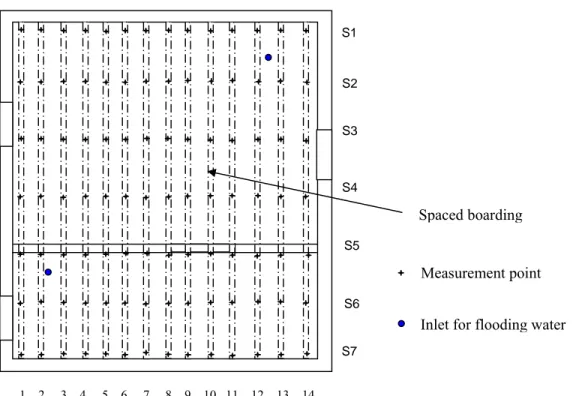
The floor construction was provided with 98 measurement points, see Figure 11, attached to the spaced boarding from beneath, through the ceiling board. These are pairs of screws as shown in Figure 2, point 17 and Figure 8 point 4.
7 1. Bathroom 2. Bedroom 3. Outer wall 4. Spine wall 5. Interior wall 6. DDoooor r 7. WWiinnddoow w 8. IInnlleettffoorrffllooooddiinnggwwaatteer r 3 6 7 2 1 5 8 4 Heating cable G-15 3
Figure 11 Ground plan of the intermediate floor. Placing of spaced boarding, positions of flooding inlets and measure points.
Experiments
Four experiments, named A1 to A4, were performed in the laboratory apartment. In each experiment 120 litres of domestic wastewater was poured into the
construction i.e. 60 litres into each “Inlet for flooding water”, see Figure 10. The “measurements of the moisture meter”, MMM, were intermittently taken during each experimental period.
The conditions in the laboratory apartment are described below in Table 1. The
RH and temperature were continuously measured by a thermo hygrograph from
Thies Göttingen.
Table 1 Preconditions for experiments A1-A4, p stands for numbers of heating cables Experiment A1 A2 A3 A4 Heating cables 2p→16 (W/m) 1p→8 (W/m) 1p→8 (W/m) 0p→0 (W/m) Temperature Average Temperature Max/Min 19,7 (oC) 22/17 (oC) 21,2 ( oC) 23/19 (oC) 19.8 ( oC) 23/18 (oC) 19.9 ( oC) 22/18 (oC)
Average max. RH during 5 days
RH Max/Min 43.6 (%) 48/40 (%) 53.4 (%) 65/47 (%) 65.2 (%) 74/50 (%) 74.4 (%) 77/63 (%) 1 2 3 4 5 6 7 8 9 10 11 12 13 14 S7 S1 S2 S3 S4 S5 S6 6
Inlet for flooding water Measurement point Spaced boarding
3.6 Investigation of mould growth
(Paper 1)
Experiments
After each experiment, A1 to A4, see above, the floor was opened from above and also from beneath. Clear tape samples for microscopic investigations of mould and bacteria, (Gutarowska & Piotrowska 2007) were taken from the battens of the spaced boardings and from the upper side of the ceilings gypsum board beside the measure points, point 17, see Figure 2. Samples were
examined concerning mould species and quantity by a well-reputed mould laboratory (Aimex AB).
3.7 Temperature and air flow in a vertical air gap
(Paper 2)
The purpose of this part is to find a connection between raised temperature in an air gap wall and air flow. The experimental set up is presented in Figure 7
above; this wall was provided with two heating cables T-18 and G-15, also presented above. The experimental work was done during two occasions which are referred to as Day 1 and Day 2. Measurements of temperature and air velocity were performed simultaneously during stable conditions, when the heating cable had been switched on for at least 60 minutes.
Temperature and air velocity studies
When a heating cable warms the air inside the air gap, it will result in a
temperature difference between the average air gap temperature and the average room temperature, hereby called ΔT. A positive value of ∆T gives a lower air density inside the air gap compared to room air. This lower density makes a pressure gradient that will create an upward air flow inside the air gap and this temperature rise is measured in this study, as well as the air velocity.
For the purpose of the experiments, eight holes were drilled at suitable heights in the panelling for insertion of temperature sensors. The room temperatures were measured simultaneously at three heights, with sensors placed 0.01 m from the surface of the wall.
A weighted mean value of the temperature in the air gap was calculated and, in a similar way, a mean value for the room temperature. The temperature difference, ΔT, turns out to be the mean value of the air gap temperature minus the mean value of the room temperature.
Air flow
The air flow, calculated from the air velocity, is supposed to be the important agent of the air gap method, both resulting in a dry out effect and in a low relative humidity (RH) inside a building construction. The air velocity was measured by the air inlet; see point 11 in Figure 7, at three measure points side by side with 10 cm in between, right below the line of temperature measure points. The air velocity measurements were made by a hot wire anemometer from TSI, USA, simultaneously with the temperature measurements. The lower detection limit of this anemometer is 5 cm/s. The measurements were performed for; no cable, T-18 cable, G-15 cable and both cables at Day 1 and 2
respectively and the air flows per meter wall were calculated from the measured air velocities.
Power of the heating cable, ΔT and air flow
The investigation of ΔT and its relation to the air flow was one of the main tasks of paper 2 and this relation is shown in the results. There is also a relation
between the power coming from the heating cable, q, temperature difference, ΔT and the air flow, Q, shown in the energy equation:
q·l=ρ·Q·C·ΔT (1)
where:
l = 1 m ρ = 1.2 kg/m3 C = 1000 J/K
The value q in equation (1) is actually the part of the total power that causes the temperature rise and the air flow. Yet the energy losses are not shown in this equation, therefore the power calculated here should be lower than the stated electrical power of the heating cable.
3.8 RH studies in a “slab on ground” construction
One consequence of the full scale study described in paper 1 is that the main part of the injected water disappears by drainage and evaporation through the ceiling of the “room” below. Therefore it was difficult to estimate the amount of water that was actually ventilated away by the air gap system. One goal of the studies of the “slab on ground” construction is to do such estimation. Another aim is to compare the RH values in a floor construction built with air gaps with an ordinary ground floor system.
Experimental rooms for “slab on ground” studies
Two rooms are constructed with chipboard floor and insulation on the slab, the first is built in the ordinary way of building, see Figures 4 and 12, the second by application of the air gap system; see Figures 5 and 13. Both rooms measure 2.75 times 2.25 meters (6 m2) and the concrete (quality C 32/40-K40) slab is 0.1 m thick, giving a volume of each slab of approximately 0.6 m3. The volume of the space between the rear side of the floor and the slab is 1.5 m3 as the floor beams are 0.25 m high. This space was filled with mineral wool board insulation up to a height of 0.20 m.
Before casting the slabs the forms were covered with two layers of Polyethylene film (0.20 mm) in order to avoid moisture transport between the slab and the ground. The floors were covered too, for experimental reasons, with
Polyethylene film, to prevent moisture transport through the chipboard. Thus all moisture transport out from the constructions goes through intended or
unintended gaps in the constructions.
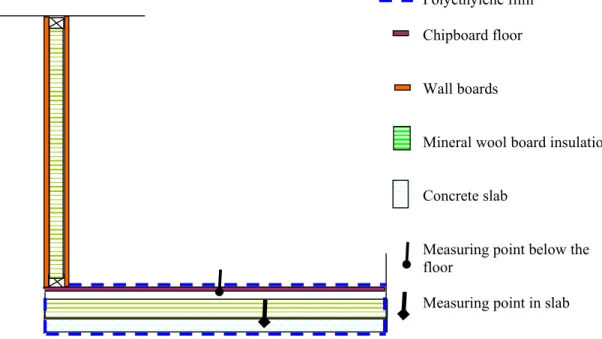
Figure 12 Schematic cross-section of an ordinary of wall and bottom floor construction used in the extra RH studies, supplied with measurement points for
RH and T in concrete slab and in floor.
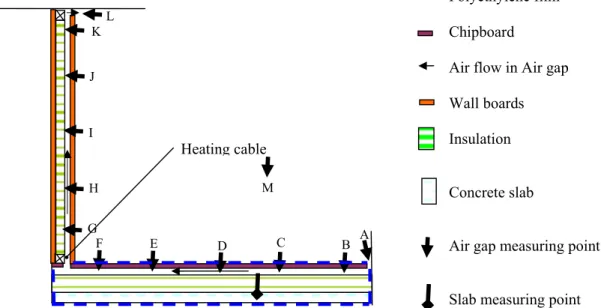
For the purpose of this study, five holes were drilled in the panelling and five holes in the chipboard of the floor, for insertion of measurement devices. The holes in the floor chipboard were situated along a line 25, 75, 125, 175, and 225 cm from the air inlet, see points A to F, Figure 13, and the holes in the wall were
Polyethylene film Chipboard floor Wall boards
Mineral wool board insulation Concrete slab
Measuring point below the floor
barrier tape to hinder moisture to escape and the holes were only open for short intervals when measurements were done.
The hypothesis concerning the air flow is that the air enters the air gap, at point A, in the opposite wall/floor connection, goes subsequently above the mineral wool insulation, through the slit of the floor, and up through the inside of the interior wall. The construction air outlet is in the interior wall/ceiling angel, at point L.
Figure 13 Schematic cross-section of wall and bottom floor construction by the air gap system, supplied with measurement points for RH and T in air gaps and concrete slab.
Experiments
The function of the air gap system in walls and floors can be tested by comparing the two dry out processes performed in the two rooms described above. If the method works, the wet concrete slab of the air gap room should dry faster than the slab of the ordinary room. It should also be possible to detect increased moisture concentrations in the total air gap shown in Figure 13.
This experiment was thus divided into two major studies. The first examined the water reduction in the concrete slabs. This was done directly after the concrete slab had been casted. The second investigated the development of RH and
vapour concentration in the construction air. This second investigation was done later and the slabs were watered again in advance of this test.
G
Polyethylene film Chipboard
Air flow in Air gap Wall boards Insulation Concrete slab
Air gap measuring point Slab measuring point
K J L I H F E D C B A Heating cable M
RH decrease in the slabs
A few days after the concrete slabs were cast, one detector for RH and T, Vaisala Intercap Humidity and Temperature Probe HMP5 was installed at the depth of 50 mm into each slab. Location of the sensors is indicated in Figures 12 and 13.
The concrete slabs were saturated by water, as they were newly cast and the humidity decrease was followed during 56 days, by measuring the RH values. The investigation was performed at the same time for both experimental rooms, during summer time at ordinary indoor conditions. The heating cable in the air gap system room was turned on when the experiment started.
RH and vapour concentration in construction air
In this study the “slab on ground” constructions needed to be moist. Therefore the constructions were flooded in advance in order to provide the necessary dampness. As the slabs had dried out unequally in the “slab” study above, 26 litres of water were added to the air gap slab and 12 litres were added to the ordinary slab. This study was followed in a time lapse of 54 days.
This second study is divided in two parts, a: “RH levels in the air gap construction compared to ordinary” and b: “Distribution of RH and vapour concentration in the air gap system”.
RH levels between floor and concrete slab
A high RH level is an important factor for mould growth. If the air gap system manages to lower RH inside a building construction, it would lead to a less fragile construction, concerning mould growth. This study registered the
difference in RH levels between the inside of an air gap construction, compared to the ordinary floor construction. RH measurements were performed, by the combined RH and temperature meter Vaisala HM 70, at the “Air gap
measurement points”, see Figures 12 and 13/point D, below the chipboard floors.
Distribution of vapour concentration in the air gap system
It is of interest whether a higher vapour concentration is distributed in both floor and wall construction of the air gap system. This should indicate that the system actually transports the vapour away. If the heating cable manages to create an air flow through the air gap system, it would result in increasing values of vapour concentration also in the air gap wall.
In this study, RH and temperature values were intermittently registered, by the combined RH and temperature meter Vaisala HM 70. The measurements were taken at the “RH and T measuring points” A to M, see Figure 13, below the floor, inside the wall and also in room, during the experimental period. The hypothesis is that it should be possible to detect higher moisture content compared to the room air, inside the total air gap.
The moisture vapour concentration at saturation point, vs, the actual vapour
concentration, vx and the moisture addition, ∆vx are calculated by the equations 2
to 5 (Nevander and Elmarsson 1994) and presented in the results.
vs=ps·M/[R·(273.15+T)] (2) where: ps=a·(b+T/100)n (3) vx=vs· RH/100 (4) ∆vx = vx-vA (5) Where: a = 288.68 b = 1.098 oC M = 18.02 kg/kmol n = 8.02 R = 8 314,3 J/kmol·K
vA = moisture content at air inlet
Air velocity in air gap
Air velocity measurements were also performed in the “Air gap measuring point H, see Figure 13, by a hot wire anemometer from TSI, USA
4. Results
4.1 Calibration of moisture meter
(Paper 1)
The percentage decrease of weight and of the MMM is presented versus time at Figure 14. In this figure the evaporation is shown as the remaining part of the originally added amount of water in percent. For example 50 % means that 78.9 grams of the originally added 157.8 grams of water still remains. The readings from the moisture meter (MMM) are shown with the highest (from point a) and lowest value (from point f) together with mean values of the six points
measured.
Figure 14 Air Gap Method. % Measurements of the moisture meter (MMM) and % Water remaining versus days
In this diagram two ranges can be noted: “Range A”, see A in Figure 14:
1. The water evaporates at a rate of little less than 10 %/hour and this
decrease in weight is due to that water dries both upwards and downwards from the gypsum board. The whole area of the test set up is wet, during this “time range”.
2. The curves for MMM remain on a 100 % plateau and this relates to the very high electrical conductance between the screws, because a water film
0 20 40 60 80 100 0 0,5 1 1,5 2 2,5 % Average MMM % Highest MMM % Lowest MMM % Water remaining Days % A B , point a , point f
“Range B”, see B in Figure 14:
1. The amount of remaining water has become smaller and the rate of drying is decreased to a lower level. More than 90 % of the added water has evaporated after two days.
2. In this part, the water that was stored between the gypsum board and the spaced boardings is dried out or taken up into the material. The readings from the MMM now goes quite rapidly down under the levels around the fibre saturation point (30 %).
This test show that the evaporation proceeds continuously, but the MMM values stays at level 100 for a quarter of a day before it starts to decrease. It can also be seen that half of the added water has evaporated before the value of the MMM becomes lower than 100%.
In spite of the different shapes of the % Water remaining curve and the %MMM curves, the conclusion of this part is that the “Surveymaster SM” is useful in this context because:
1. When the readings from the moisture meter have gone down to 20 %, more than 80 % of the water has evaporated.
2. When the readings from the instrument is higher than 30 %, a decreasing trend in the readings still reflects a decrease in moisture content in the construction.
The result of this calibration is the reason why the “measurements of the moisture meter” MMM were used to detect humidity decrease in the
intermediate floor studied in paper 1. A number of measure points (98) were screwed into the spaced boarding in the intermediate floor of the laboratory apartment, see Figure 11 and Figure 2, point 17.
4.2 Drying of a flooded intermediate floor
(Paper 1)
The flooded floor
The flooding was 120 litres and the floor area is 24 m2, which gives 5 litres per square meter, giving the possibility of covering the whole area with a 5 mm deep layer of water if there were no drainage.
Drainage
Between 90 and 105 litres of the 120 litres of the water added, drained out immediately by the “inlet of air”, see point 16 in Figure 3. In Figure 15 below, this air inlet is situated at the S7 line in the lowest part of the diagram. Most of the drainage took place at this place, but some water also dripped slowly from some joints between the gypsum boards. This drainage was noted quite early in the process, already when less than 10 litres were poured into the floor.
Iso-humidity map
The water damage is shown as raised MMM values in parts of the floor map, see Figure 15 below. In this figure, shown as an example, there are measurement points in each cross of the screen, to be compared with Figure 11 above.
Figure 15 Schematic map of ground plan, showing the iso-humidity lines three days after flooding. The disposition of the MMM scale humidity is shown at the right side of the map.
This iso-humidity map confirms that a major part of the water has drained out from the construction and that most of the measurement points are unaffected by water. It is also clear that theremaining water seems to be in pools, for instance around the S6/12 cross and the S2/12 cross. The dampest point turned also out to be this cross at S2/12, for all the experimental series.
1 2 3 4 5 6 7 8 9 10 11 12 13 14
S1
S2
S3
S4
S5
S6
S7
Experiment C D a y 3
90-100
80-90
70-80
60-70
50-60
40-50
30-40
20-30
10-20
0-10
Experiment C Day 3
Results for dampest point; “cross at S2/12”
The results are shown in Figure 16, where the MMM readings for the S2/12 point for each test, are plotted versus time. It is shown that the flooding water evacuates faster when heating cables are switched on. This is displayed both by the time needed to reach down to the level of 20 % and also by the slope of the curves. The drying rate was fastest in experiment A1 (with two heating cables switched on), compared to experiment A2 and A3 (with one heating cable switched on).
It took 8 days for the construction to dry with two cables operating, compared to 12 and 13 days while one cable was switched on and 21 days with no cable working. So it is a significant difference in actual drying time and drying
velocity between the first three experiments A1, A2 and A3 with heating cables operating, and the experiment A4, when the heating cable was switched off. The drying velocity can be understood as the gradient of the curves in Figure 16, the steeper inclination, the higher drying velocity.
Figure 16 Decrease of moisture meter measurements (MMM) as a function of time. % MMM scale versus days.
0 20 40 60 80 100 0 5 10 15 20 25 A1 2 heating cables A2 One heating cable A3 One heating cable A4 No heating cable
Days % MMM scale
4.3 Investigation of mould growth
(Paper 1)
Results
The mould was investigated concerning species, growth and occurrence of mould by Aimex AB.
Table 2 Occurrence and fouling or bacteria and mould inside intermediate floor.
Experiment A B C D
Growth No No No Yes
Occurrence of spores and hyphas
Yes Yes Yes Yes
Species mould No No No Acremonium sp
Cladosporium sp
No mould growth was found after experiments A1, A2 or A3, based on visual examination and microscopic observation. After experiment A4, when the heating cables had been turned off, there were an abundant growth of active Acremonium sp and Cladosporium sp seen in microscope upon an area close to the S2/12 point.
4.4 Temperature and air flow in a vertical air gap
(Paper 2)
The temperature and air velocity measurements were performed during two days, named Day 1 and Day 2. The mean room temperature was 15.9 oC during Day 1 and 17.6 oC during Day 2, which, according to the manufacturer, should imply that the emitted power from heating cables ought to be somewhat higher during the colder Day 1.
Temperature
A typical result from the temperature measurements are displayed in the histogram in Figure 17 below, showing the air gap temperature for each measuring point in grey bars and the room temperature inside the dashed quadrangles. The difference in temperature, ΔT, could visually be described as the areas of the grey bars minus the area of the dash-lined quadrangles. The calculations are displayed in paper 2 in this thesis.
Figure 17 Histogram of temperature in air gap (grey bars) and in room (inside dashed lines), Day 1, Nr1. The raised temperature in the lower part of the histogram is caused by the T-18 cable.
Temperature difference ∆T
H (m)
T (oC)
Air Gap Temperature
Room Temperature 0 5 10 15 20 25 0.5 1.0 1.5 2.0 0
lowest values in the same sequence. There is also a big disparity between the different days, giving higher values for Day 1 compared to Day 2.
Table 3 Values of ΔT for each series, “No C.” stands for no cable switched on, and “Bo. C” stands for cables “G-15 and T-18” switched on together. D 1 and D 2 stands for Day 1 and Day 2 respectively. Ratio H/L stands for ratio between the highest and the lowest value.
Nr No C. D1 No C. D2 G-15 D1 G-15 D2 T-18 D1 T-18 D2 Bo. C. D 1 Bo C. D 2 1 0.18 -0.08 0.48 0.17 0.54 0.44 1.13 0.61 2 0.12 -0.03 0.40 0.24 0.59 0.36 1.20 0.64 3 0.09 -0.03 0.37 0.24 0.63 0.38 1.21 0.68 4 -0.04 -0.05 0.40 0.23 0.67 0.34 1.13 0.64 5 -0.01 -0.04 0.39 0.21 0.58 0.45 1.10 0.85 6 0.09 -0.03 0.54 0.30 0.60 0.39 1.13 0.69 7 -0.04 -0.11 0.40 0.27 0.69 0.39 1.15 0.70 8 -0.04 -0.11 0.34 0.31 0.64 0.41 1.15 0.75 9 0.03 -0.12 0.36 0.30 0.67 0.43 1.17 0.84 10 0.00 -0.08 0.39 0.30 0.40 0.37 1.13 0.80 Average 0.04 -0.07 0.41 0.26 0.60 0.40 1.15 0.72 Ratio H/L 1.59 1.760 1.73 1.32 1.1 1.39
Air flow
The average air flow is calculated out of the air velocity and displayed in Table 4. The air flow is quite measurable and stable values are obtained down to air flow values of approximately 9·10-4 m3/s. However the G-15 values on Day 2 have the biggest ratio between highest and lowest value. This is probably because this measure range is close to the lower detection limit of the
anemometer. It may also be noted that the value of the air flow changes between Day 1 and Day 2, giving higher flow during Day 1.
Table 4 Values of average air flow (Q·10-4 m3/s) per meter wall for each series, No C. stands for no cable, and Bo. C stands for G-15 and T-18 switched on together. D 1 and D 2 stands for Day 1 and Day 2 respectively. Ratio H/L stands for ratio between the highest and the lowest value.
Nr No C. D1 No C. D2 G-15 D1 G-15 D2 T-18 D1 T-18 D2 Bo. C. D 1 Bo C. D 2 1 0 0 9.5 8.0 16.0 13.2 21.0 18.5 2 0 0 10.2 7.1 16.0 13.2 20.6 18.5 3 0 0.3 9.3 5.6 15.7 14.5 20.6 17.3 4 0.7 0 9.5 5.8 14.8 13.9 20.1 17.6 5 0.3 0.3 9.3 5.8 16.0 13.9 21.3 16.9 6 0.3 0.7 9.3 7.1 17.9 13.6 20.6 17.3 7 0 0.3 9.3 6.2 16.7 14.5 20.6 17.9 8 1 0 9.5 6,5 15.7 13.2 19.4 17.9 9 0 0.7 10.2 5.3 16,9 13.2 21.3 18.5 10 0 0.3 9.5 5.8 15.7 13.2 20.1 17.9 Av. Q ·10-4 (m3/s) 0.2 0.3 9.5 6.3 16,2 13,6 20,5 17,8 Av. QD (m3/24h) 1.9 2.8 82 54 140 118 177 154 Ratio H/L 1.1 1.5 1.2 1.1 1.1 1.1
Air flow versus ΔT
The air flow is plotted against the ∆T in Figure 18. The diagram shows rather spread values, but it is clear that flow increases with rising temperature
difference, ∆T, between the air gap and the room. The figure also shows a clear null result, when the heating cable is switched of there is no raised ∆T and no air flow.
Figure 18 Air flow versus ΔT in the air gap wall, described in Figure 7.
Power of the heating cable, ΔT and air flow
The relation, from equation (1), between power, q, temperature difference, ΔT and air flow Q is displayed in Table 5 together with the power values stated by the manufacturer.
Table 5 q calculated out of equation (1) and the losses, compared to the stated power of the heating cable, expressed as a percentage.
Heating cable Day ΔT (oC) Q·10-4 (m3/s) qHC (W/m) q (W/m) Losses %
No cable 1 0.04 0.2 0 9,6·10-4 - No cable 2 -0.07 0.3 0 -2.5·10-3 - G-15 1 0.41 9.5 8 0.47 94 G-15 2 0.26 6.3 8 0.20 97 T-18 1 0.60 16.2 15 1.2 92 T-18 2 0.40 13.6 15 0.65 96 Both cables 1 1.15 20.5 23 2.8 88 Both cables 2 0.72 17.8 23 1.5 93 -1 4 9 14 19 24 29 -0,2 0 0,2 0,4 0,6 0,8 1 1,2 1,4 No cable Day 1 G-15 Day 1 T-18 Day 1 Both cables Day 1 No cable Day 2 G-15 Day 2 T-18 Day 2 Both cables Day 2
ΔT (oC)
4.5 RH studies of a “slab on ground” construction
RH decrease in the slabs
The concrete slabs of the two rooms show different dry out processes. In the air gap floor construction, the RH level has gone down 12 %, from 97 % to 85 % over a time lapse of 56 days. The RH reduction, in the slab of the ordinary floor system, is 6 %, from 98 % to 92 %, see Figure 19.
Figure 19 RH decrease in slabs on ground. A comparison between an ordinary floor construction and an air gap construction.
RH (%) in slab Days 80 85 90 95 100 0 10 20 30 40 50 60
Ordinary floor construction
A sorption curve is presented in Figure 20 (Nevander and Elmarsson 1994); this curve is valid for a concrete K 40, which is similar to the concrete in this study. According to this curve, one cubic meter of concrete contains around 102 kg of water at 92 % RH and around 89 kg of water at 85 % RH, see point A and B in Figure 20. As the slabs contain approximately 0.6 m3, the air gap system
succeeds in evaporating around 8 litres more during this period, compared to the ordinary built system.
Figure 20 Dry out process in concrete K 40. The points “A” and “B” refer to the dry out level reached by the ordinary floor and air gap system respectively after
92 85 102 89 A B Mass water in concrete (Kg/m3)
RH % 100 100 50 50 0
RH levels between floor and concrete slab
The RH levels below the two floor constructions are plotted versus time in Figure 21, together with the comparable RH levels of the two rooms. The measure points are shown in Figures 12 and 13/ point D. The diagram shows that the ordinary construction has significantly higher RH levels compared to the air gap system. The ordinary floor values exceed 75 % for more than 20 days, while the RH level in the air gap floor is less than 75 %, all the period.
Figure 21 RH levels inside ordinary floor construction upon slab, inside air gap construction upon slab and in room air.
0 10 20 30 40 50 60 70 80 90 100 0 10 20 30 40 50 60
RH below air gap floor RH below ref. floor RH in ref. room RH in air gap room
RH (%)
Distribution of vapour concentration in the air gap system
All results of RH and temperature measurements together with the calculated vapour concentrations are displayed in Tables A1 to A8, shown in Appendix. As an example, the results from day 28 are also displayed in Table 6 below. In these tables, “the moisture addition”, Δvx, is introduced as the vapour concentration
from one measurement point A-M, see Figure 13 minus the vapour concentration at the inlet, point A.
The data of the Table 6 shows that there is an increase in moisture addition ∆vx
in the floor from the air inlet at “A” to point “F”. This moisture addition remains in principal at this level up to point “K” in the wall. The lower value at the air outlet ”L” is explained by the process of mixing between air from the room and air from the air gap. The damp concrete slab is the only source for moisture in this construction.
Table 6 RH, temperature, vapour concentration and the moisture addition ∆vx of
construction air, in wall, floor and by inlet and outlet at day 28.
Place RH % Temp. (C) vx g/m3 Δvx (g/m3) A Air inlet 43.6 18.8 7.0 0 B Floor 25 cm 49.7 18.1 7.7 0.7 C Floor 75 cm 55.4 18.4 8.7 1.7 D Floor 125 cm 56.2 18.3 8.8 1.8 E Floor 175 cm 58.2 18.3 9.1 2.1 F Floor 225 cm 57.5 18.4 9.0 2.0 G Wall 20 cm 46.8 21.5 8.8 1.8 H Wall 70 cm 51.0 20.0 8.8 1.8 I Wall 120 cm 51.5 19.9 8.8 1.9 J Wall 170 cm 52.0 19.8 8.9 1.9 K Wall 220 cm 52.2 19.7 8.9 1.9 L Air outlet 43.5 20.0 7.6 0.9 M Room 40.7 20.0 7.1 0.1
Moisture addition over time
Figure 22 shows how the moisture addition at point “K”, ∆vK in the outlet air
varies over time. The average value for 54 days is 1.3 gram/m3 air, which means that 1.3 grams of water leaves the construction with each cubic meter of air. It is also shown that the addition was zero at 54 days, when the moisture content was the same beneath the floor as well as above the floor.
Figure 22 The moisture addition, ΔvK, in point K versus days
Air velocity in air gap
No air velocity could be detected, by the hot wire anemometer, inside the air gap at the “Air gap measuring point H, in Figure 13.
0 0,5 1 1,5 2 2,5 3 0 10 20 30 40 50 60
Moisture addition at point K
Days Δ vK (g/m3)
5. Discussion
5.1 Drainage, air flow and RH values
The general hypothesis for this thesis claims that it is possible to drain and evaporate dampness after water damage without demolition and also that it is possible to keep RH at a proportionately low level during this process. The function of the air gap method depends on two major operating parts, drainage and air flow. The importance of the latter is also divided into two parts, the dry out effect and the reduced RH values inside the construction, both parts mainly caused by the air flow.
Drainage
It was only 120 litres that entered the intermediate floor in paper 1, which is a rather small flooding. However as the construction has an inbuilt drainage, see point 16, Figure 2, the flooding could have been considerably bigger and the main part of the water would still drain out. This drainage works also as an early warning and makes it easier to localize the damage point. One difficulty when water damage occurs in real life is to determine where the leakage takes place. Hence fault-tracing is easier to do, by the air gap method.
Air flow
The results in paper 2, displayed in Tables 3 and 4 and Figure 18 also show a clear null result; when the heating cable is switched off, there is no increased temperature in the air gap, ΔT=0, and there is no measurable air flow either. The air change rate per hour inside the wall construction varied between 13 times for the G-15 cable and 36 times for the stronger T-18 cable.
The air flow values in paper 2, displayed in Table 4, are rather well together; it
is only the values for the G-15 cable during Day 2 that show a greater spread probably because these values come close to the lower detection limit of the hot wire anemometer.
Temperature
It is difficult to measure temperature with a resolution down to a tenth of a degree Celsius. Lamps and the persons who perform the investigation add heat to the system and an unexpected draught may change the basis for the
experiment. General measure conditions are somewhat unstable and therefore it could be expected to obtain such spread results in the temperature as shown in Table 3. It is noted that ΔT for the T-18 cable for Day 2 (0.40 oC) is almost the
Air flow and the dry out effect
The results from paper 1, displayed in Figure 16 show that the water disappears faster when the heating cable is operating, but the air flow was not measured so there are no direct proofs of ventilation in this case.
There are though proofs, see Figure 18, that the heating cable causes a raised temperature, which on its part causes an air flow. This air flow noted in paper 2 was possible to measure because the measure point was narrowed from 25 mm to 10 mm, see Figure 7 and the fact that the measure point was close to the heating cable. In a larger system with both horizontal and vertical building parts and when the air gap is wider, the air flow is harder to detect.
Table 5 shows that most of the power added from the heating cable disappeared from the air gap system, the energy used for temperature rise and air flow lies between 3 and 12 %. The rest of the energy could be lost as heat conduction through the OS-board and gypsum board. If the air gap could be better insulated it should lead to higher efficiency of the air gap system. This will be
investigated in coming papers.
The results from RH studies in a “slab on ground” construction indicates that 8 extra litres of water has disappeared from the “air gap” concrete slab in 56 days compared to the reference slab. The air flow was found to be below the
detection limit for the hot wire anemometer, but the results from Table 6 and Tables A1 to A8, shown in Appendix, indicate that the moisture finds its way towards the air outlet. As seen in these tables the moisture content
measurements in the air gap wall and in the air gap floor correspond very well, which indicate that there are only small leakages in this type of system.
The results from the RH studies in a “slab on ground” construction can be used for a rough estimation of the air flow: The average ΔvK for the period was 1.3
grams per m3 air, around 8 litres disappeared during this period and this will imply that around 6000 m3 of air has ventilated through the system during 54 days (equal to 4 665 600 seconds). This leads to an air flow of 1.3 litres per second and as the wall is 2.25 m long, the air flow will be approximately 0.6 litres per second and meter.
As the air gap is 0.025 m wide, the air velocity should be around 0.024 m/s. This velocity in this range it is too low to be detected by the anemometer from TSI, which lower detection range is about 0.05 m/s. The task of developing a more sensitive method of measuring low air velocities will be undertaken in a coming paper.
This air flow may be compared to the air flow registered in paper 2 showing measured flows of 1.3 to 1.7 litres per second and meter for the same cable. The results are in the same magnitude and it is reasonable to believe that the air flow
should be lower in a combined wall and floor system compared to a sole wall system presented in paper 2. The air gap is more than twice as long in the combined wall and floor construction, and the air flow is assumed to meet a stronger friction in this case.
As the area of the room is 6 m2 and the air flow is 1.3 litres per second, it will lead us to an air flow of 0.2 litres of ventilating air per m2 of the floor and second, which is in the same magnitude as the Nivell-floor, see page 6.
As the volume between the floor and the concrete slab is 1.5 m3 it will lead us to an air change rate around 3 times per hour, to compare with an ordinary air change rate for a room, which is 0.5 times per hour (Boverkets byggregler 2006). The high air change rate is important, while it will lower harmful levels of RH.
Reduced RH values gives less fragility
If water has entered into a building construction, the dampness needs to be removed. It is also important that the relative humidity inside the construction is kept at a low level in order to avoid mould growth. The results displayed in Figure 21 show that the RH level below the floor in the air gap construction never exceeds 75 %. This is a rather big difference compared the reference floor, where the RH levels exceed 75 % during 20 days at the beginning of the study.
The low RH values also imply that there ought to be no mould growth on the rear side of the air gap floor. As this investigation is performed during
summertime, with comparably high RH, it may be considered that the possibility to avoid mould growth would be even better during the rest of the year.
5.2 Mould growth in the flooded intermediate floor
The mould species found in experiment A4 of paper 1 were Acremonium sp and Cladosporium sp and these species could be harmful to humans in high
concentration (Gutarowska & Piotrowska 2007).
The growth of mould during experiment A4 could however be due to both high relative humidity at time, see Table 1, as well as reduced ventilation, because the heating cable was switched off. Further test could be done to investigate this matter.
The conclusion is anyhow that the method reduces the relative humidity inside a construction and that this reduced RH makes a building construction less fragile
5.3 Air gap method inside a bathroom
When the investigation of the air gap wall in paper 2 was performed, the air inlet and outlet were situated at the same side as the air gap inside the wall, see
Figure 7. If the inlet and outlet would be situated in the neighbour room as shown in Figure 23, it would be possible to obtain an air flow, without a heating cable in the air gap, provided there is a temperature difference between the rooms.
Figure 23 Air gap wall where air inlet and outlet are situated in neighbour room. The arrows indicate an upwards going motion of the air flow
The results displayed in Table 3-4 and in Figure 18 show that it is possible to obtain an air flow, 50 m3 per m wall and day, by a rather small temperature difference, 0.2-0.3 oC. Table 5 also indicates that heat could transfer rather
easily from the air gap to the room and vice versa. A small difference in
temperature between bathroom and neighbour room would therefore cause an air flow in the system.
It is also quite possible that the bathroom temperature differs from the
surrounding rooms. A bathroom gets warmer when a person takes a shower and the bathroom can also become colder as this room can get a downdraught, since a bathroom often ventilates towards exterior air. This will imply that the air gap
3
1. Gypsum board 13 mm 2. OS-board 13 mm 3. Bottom sill 45/45 mm 4. Stud 45/70mm
5. Mineral wool board surface 6. Cellular plastic-bar 30/25mm 7. Air-gap 8. Floor 9. Air inlet 10. Top plate 11. Air outlet 12. Ceiling 13. Bathroom 14. Neighbour room 12 6 8 1 2 1 4 5 7 9 13 12 4 6 21 10 11 14 2
temperature also will differ from the temperature of neighbouring rooms. The air flow of the air gap could thus go in both directions, taking harmful water out of the construction. In this case it would not be necessary to use a heating cable.
5.4 Nordic building rules
An air gap solution is by the way desired by the Finnish building rules C2 (Haavisto and Särkijärvi 1998) where it is written: If there are two water tight layers in a building construction, no material that requires drying shall be placed between these layers, unless precautions have been taken to ensure the moisture to leave without hindrance. This is in fact a description of the aim of the air gap method; moisture should always be able to leave the construction and therefore make it less fragile.
Byggforskserien (Bad i underetasjer 30.055) in Norway has also solutions where an air gap can be used behind a panelling of a bathroom. This is recommended when a bathroom is placed in a cellar (Arfvidsson et al 2005).
6. Conclusions
The aim of the of the air gap method is to make a house less fragile according to water damage, where moisture can be removed without demolishing the
construction.
When temperature and convective air flow in a vertical air gap was studied, it was noted how air flow increased with raised power of the heating cable. In this test the air flow for one meter of wall varied between 50 m3/day (13 air changes per hour) and 140 m3/day (36 air changes per hour). The lower value is caused
by a temperature difference in the range 0.2-0.3 oC. Without heating there was no air flow.
In studies of moisture and RH in slab on ground constructions, it was noted how the slab in the room with the air gap method dried to a much higher extent than the slab in the room built in an ordinary way. It was also noted that moisture was transported from the air gap in the floor and up through the air gap in the wall, although the air velocity was too slow to be detected. In the room with the air gap construction, RH beneath the floor was at a lower level (and below 75 %
RH) than RH beneath the floor of conventional construction.
In the study of a flooded intermediate floor, it was noted how the thermally driven convective air flow evidently speeded up drying of the construction. Mould growth was only noted in the case where the heating cables were turned off
The general conclusion is that the air gap method provides means to build houses in a less fragile way, minimizing the negative effects of water damage.
7. Acknowledgement
The author expresses gratitude for fruitful discussions with his colleagues: • Docent Folke Björk
• Tekn. dr. Kjartan Gudmundsson • Professor Gudni Johannesson • Professor Tor-Göran Malmström • Professor Elisabeth Mundt
• Professor Lars Olander • Professor Ove Söderström • Professor Kai Ödéen
The author also wishes to express his gratitude for financial support and fruitful discussions to:
• Formas/BIC (the Swedish Research Council/the Swedish Construction Sector Innovation Centre)
• SBUF (the Development Fund of the Swedish Construction Industry) • NCC