Commissioned by the Swedish Environmental Protection Agency
SMED Report No 65 2005
A review of Swedish crop
residue statistics used in the
greenhouse gas inventory
Published at: www.smed.se
Publisher: Swedish Meteorological and Hydrological Institute Address: SE-601 76 Norrköping, Sweden
Start year: 2006 ISSN: 1653-8102
SMED is short for Swedish Environmental Emissions Data, which is a collaboration between IVL Swedish Environmental Research Institute, SCB Statistics Sweden, SLU Swedish University of Agricultural Sciences, and SMHI Swedish Meteorological and Hydrological Institute. The work co-operation within SMED commenced during 2001 with the long-term aim of acquiring and developing expertise within emission statistics. Through a long-term contract for the Swedish Environmental Protection Agency extending until 2014, SMED is heavily involved in all work related to Sweden's international reporting obligations on emissions to air and water, waste and hazardous substances. A central objective of the SMED collaboration is to develop and operate national emission databases and offer related services to clients such as national, regional and local governmental authorities, air and water quality management districts, as well as industry. For more information visit SMED's website www.smed.se.
3
1 SUMMARY ___________________________________________________ 4 2 BACKGROUND _______________________________________________ 4 3 PURPOSE ___________________________________________________ 4 4 IMPLEMENTATION ____________________________________________ 4 5 RESULTS AND ANALYSES _____________________________________ 5 5.1 Definition of crop residues ___________________________________________ 5 5.2 Choice of measurement _____________________________________________ 5 5.3 Causes of variations ________________________________________________ 5 5.4 Available data on crop residues ______________________________________ 6
5.4.1 Data used up until the 2005 Submission _____________________________ 6 5.4.2 Other sources of data ____________________________________________ 7
5.5 Recommendations _________________________________________________ 7
5.5.1 Recalculations _________________________________________________ 7 5.5.2 Removed crop residues __________________________________________ 8
5.6 Sensitivity analysis _________________________________________________ 8 5.7 Comparisons with Finland and Denmark ______________________________ 9 5.8 Potential improvements _____________________________________________ 9 Appendix 1, Choice of factors in the GHG-inventory, Submission 2006 __________ 10 Appendix 2, Choice of factors for the nitrogen content of crop residues __________ 11 Appendix 3, Data on crop residues according to the Submission 2005 ____________ 12 Appendix 4, Calculation of the amount of crop residues based on the level of fertilizer use ___________________________________________________________________ 13 References _____________________________________________________________ 14
4
1 Summary
Factors for recalculating primary crops into the nitrogen content of crop residues for different arable crops are compiled and summarised here. The data is included in the calculation of nitrous oxide from the turnover in crop residues and was used in the inventory of greenhouse gases in the 2006 Submission. The data is compared to data for both Denmark and Finland. In addition, sources of uncertainty are discussed. The
suggested revision decreases the estimated emissions from crop residues by 18 % in 2003. The emissions from crop residues correspond to 6 % of the N2O emissions from
agriculture in this year.
2 Background
The IPCC (Intergovernmental Panel on Climate Change) calculation model for nitrous oxide (N2O) emissions from agricultural land includes emissions from the nitrogen
turnover in crop residues. The nitrogen content of crop residues is calculated using primary crop statistics in combination with recalculation factors, that is, the ratios of crop
residue/primary crop and the nitrogen content in crop residues. In addition, information on removed crop residues is used to subtract that part of the crop residues that is not turned over on agricultural land.
A comparison between data used in different countries reveals great differences.1
Variations in climate, soil fertility and production methods across different countries partly explain some of the differences. Nevertheless, it is likely that these differences also depend on different definitions as well as on variations in the trial data. A more systematic
comparison of the recalculations for different countries requires well-documented sources of information.
3 Purpose
This project provides an opportunity to review national recalculations in order to both improve documentation and explain, where possible, differences compared to Denmark and Finland.
4 Implementation
A new set of recalculations is produced and documented to the extent possible. Reasons for the differences between the Nordic countries are discussed. Data sources include the SLU (Swedish University of Agricultural Sciences) trial database as well as national statistics and IPCC guidelines.
5
5 Results and analyses
5.1 Definition of crop residues
Crop residues consist of straw and light fractions (husk and chaff). A commonly used concept is the straw-grain ratio, that is, the yield of straw (kg/ha) divided by the yield of grain (kg/ha).2 The size of this ratio is significantly affected by whether or not one includes light fractions as well as by the length of stubble. The IPCC guidelines refer to
aboveground biomass, excluding the yield of grain, and thereby including stubble. It appears arbitrary to include only aboveground biomass and exclude roots yet the reasons for this limitation are not explained in the guidelines.3
In the Swedish greenhouse gas inventory, the IPCC definition of crop residues should be applied, which was interpreted in this project as “aboveground biomass excluding the yield of grain”. When transferred to pasture land, the definition must be generalised somewhat to refer to “the aboveground biomass remaining on the field after harvesting or grazing”.
5.2 Choice of measurement
Measurements differ between different reports. For example, data from Haak4 refers to wet weight (even in the case of nitrogen content) while data from Mattsson5 indicates the ratio between crop residues, expressed as dry matter, and the yield, expressed in wet weight. Units of measure thus have to be carefully considered before any of the data is used. The IPCC Table regarding ”Selected crop residue statistics” includes no measurements. This leaves room for arbitrariness in interpretation. Moreover, things are not made any clearer by referring to the main source.6
Another source of potential confusion within the IPCC material is how to interpret the ratio - are the crop residues a percentage of the crop or vice versa. A review of the source
indicates that the ratio may actually be the quotient between the primary crop and the crop residues. Moreover, the inverted IPCC data appears to more closely approach both the national data from Denmark as well as the national data that is chosen for the Swedish 2006 Submission.
The measurement that seems most practical and lucid for greenhouse gas reporting is to calculate crop residues expressed as a percentage of the primary crop where both are expressed in dry matter. The nitrogen content can then be expressed as a percentage of the weight of the crop residues (dm). In terms of calculations, one can recalculate crop
residues as dry matter and then apply both recalculations in order to obtain the resulting amount of nitrogen in the crop residues.
5.3 Causes of variations
The relation between crop residues and seed varies with the choice and sort of grain and is dependent on the year's weather and growing conditions. Climate, type of soil, cultivation
2 Statistics Sweden 1997.
3 The 2006 IPCC guidelines may further consider this issue. 4 Claesson & Steineck, 1991.
5 Mattsson L., 2005a. 6
6 methods and the use of fertilisers and/or straw shortening chemicals also influence the relation between crop residues and seed. Trends over time can thus potentially be explained by factors such as plant processing and the choice of seed.
Other reasons for differences in data between different countries may be the different definitions of concepts - differences such as whether stubble or light fractions are included. Even haphazard differences such as variations in weather and growing conditions may have impacts due to the incorrect inclinations or too few measurements.
Stubble height, for example, plays a significant role in the straw/grain ratio since a large part of the straw is located in the lower part of the stalk. According to a trial survey7 some 20% of the straw has a stubble height of 0-10 cm while some 40% has a stubble height of 0-20 cm. If the straw/grain ratio is, say, 1 above ground then harvested straw/grain ratios of 0.8 and 0.6 depend on the stubble height used. The estimated straw/grain ratio is
consequently very sensitive to stubble height given the interpretation of the measurement data.
5.4 Available data on crop residues
5.4.1 Data used up until the 2005 Submission
The recalculation factors used in the Submission 2005 of the Swedish greenhouse gas inventory are derived in principal from an account in Claesson and Steineck, Plant nutrient management - environment, 1991, which is based on data proposed by Enok Haak.8 Claesson and Steineck are not thorough in their reporting. This means that it is sometimes necessary to generalise the data for use on other crops. In these cases, rules for generalising are based upon assessments of which crops are most like one another. The list must be complemented with more information including information on temporary pasture. A complete account of the data used (up until and including the 2005 Submission) is presented in Appendix 3.
In 1997, Statistics Sweden carried out an interview survey on the use of crop residues. Some 3 500 farmers answered questions on how straw and tops from the different agricultural crops were used.9 These statistics were used in the calculation of greenhouse gases in order to remove that part of the crop residues that is not returned to the field.
7 Statistics Sweden 1981.
8
The reference is Haak, 1988, which has not been possible to identify despite a search of the majority of references.
7 5.4.2 Other sources of data
5.4.2.1 The trial database at the Swedish University of Agricultural Sciences (SLU)
This project included extraction of some data from the SLU trial database.10 The results of this extraction are reported in a Memorandum.11 The trial database contains all
experimental material that has included straw weighing as a part of a trial. Results have been obtained for oat, autumn rye, autumn wheat, spring corn and spring wheat crops. These have been reported for different levels of fertiliser use.
5.4.2.2 Statistics Sweden 1980
In 1980, Statistics Sweden conducted a survey of crop yield estimates for cereal straw. Crop residues and yields were harvested and weighed. Crop residues were defined as biological yield excluding the grain yield and 1-2 cm stubble but including husk and chaff. The ratios of the straw yield/grain yield for some cereal crops were Reported. These ratios were consistently somewhat higher than the data from Haak. The yield of different straw-lengths was also weighed based on a small amount of the test material.
5.5 Recommendations
5.5.1 Recalculations
The proposed recalculations including source references are reported in Appendices 1-2. The results from the SLU database runs have been used for cereal crops. The residue/crop product ratio (or the quotient crop residues/grain yield) has been increased by 25 % in order to include the stubble.12 Since the ratio varies with the nitrogen fertilisation, the value of different fertilisation levels is weighted together using information on fertilisation from the fertiliser survey, 2003.13 This calculation is further explained in Appendix 4. For cereal crops with insufficient information, values for similar crops have been applied according to the comments in the second column in the tables of the appendix 1 and 2 respectively. For rape, no well-documented information is available. The data here have been derived from Claesson and Steineck, 1991. The values of crop product/residue ration have been inverted in order to obtain the quotient of crop residues to grain yield. Unfortunately, the data have been reduced for moisture content one too many times and has thus been underestimated by 15 % in the 2006 Submission. It is also unclear whether or not stubble was accounted for in the source.
For potatoes (table and processing potatoes) and for peas (table peas and peas for
conservation), IPCC default values have been used. The value used for brown beans is the same as that used for peas. For sugar beets, national data on the ratio of tops/yield14 and the nitrogen content have been used.15
10 Mattsson L 2005a. 11 Mattsson L 2005a. 12 Mattsson L 2005b. 13 Statistics Sweden 2004. 14 Mattsson L. 1994.
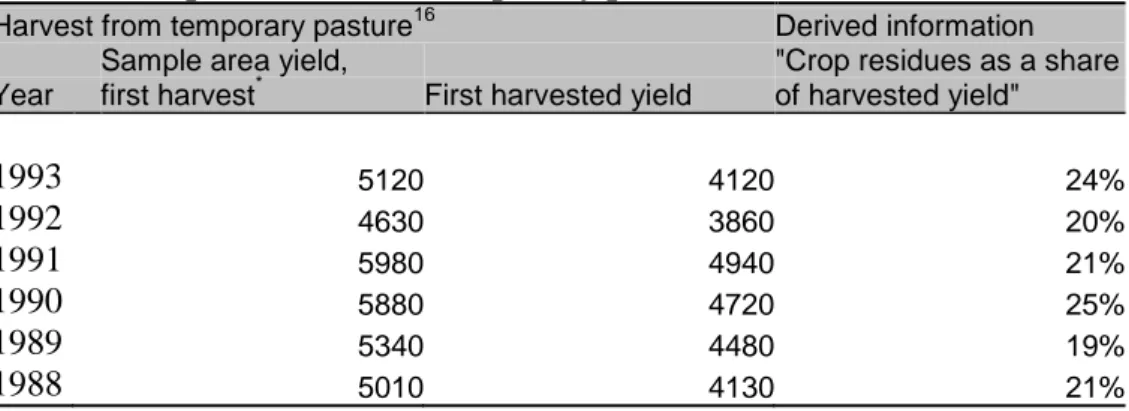
8 For crop residues in the temporary pasture, an average share of 25% of the harvested yield is assumed. This is based on the derivations in Table 1 below. The higher value of 25% was chosen, since the stubble was not included in the harvest.
Table 1. Crop residues from temporary pasture
Harvest from temporary pasture16 Derived information Year
Sample area yield,
first harvest* First harvested yield
"Crop residues as a share of harvested yield" 1993 5120 4120 24% 1992 4630 3860 20% 1991 5980 4940 21% 1990 5880 4720 25% 1989 5340 4480 19% 1988 5010 4130 21% *) 5 cm stubble
For grazing temporary pastures, it is assumed that the animals exploit 60% of the harvest saved as hay or sludge.17 The calculation of "crop residues" from grazing pastures is deemed to be 40% of the yield from these fields. Data on the nitrogen content for pastures is taken from Claesson and Steineck, 1991.
5.5.2 Removed crop residues
The following revision is proposed. The amount of removed crop residues that is used for litter should be included in the calculations since, after their use, these crop residues are returned to the field again via manure. This revision results in a share of removed
straw/tops in the 2006 Submission (See Appendix 1) that is significantly lower than it is in the 2005 Submission (See Appendix 3).
It would be most correct to subtract only the conditioned crop residues. Today, this can be done for cereal crops. However, this is not yet introduced in the calculations since IPCC data as well as a considerable amount of the national data do not distinguish between conditioned and unconditioned crop residues.
5.6 Sensitivity analysis
According to Submission 2005, N2O emissions from crop residues amounted to 1.29 Gg in 2003, which was 7.5% of the total N2O emissions from the agricultural sector. By
introducing the new data on crop residue, the estimated emissions from crop residue will decrease to 0.93 Gg, corresponding to 5.5% of the N2O emissions from the agricultural sector. The inclusion of crop residues used as litter increases the estimated N2O emissions again to 1.1 Gg, corresponding to 6 % of the total emissions.
16
Table 7.21 in JÅ, 1994.
9
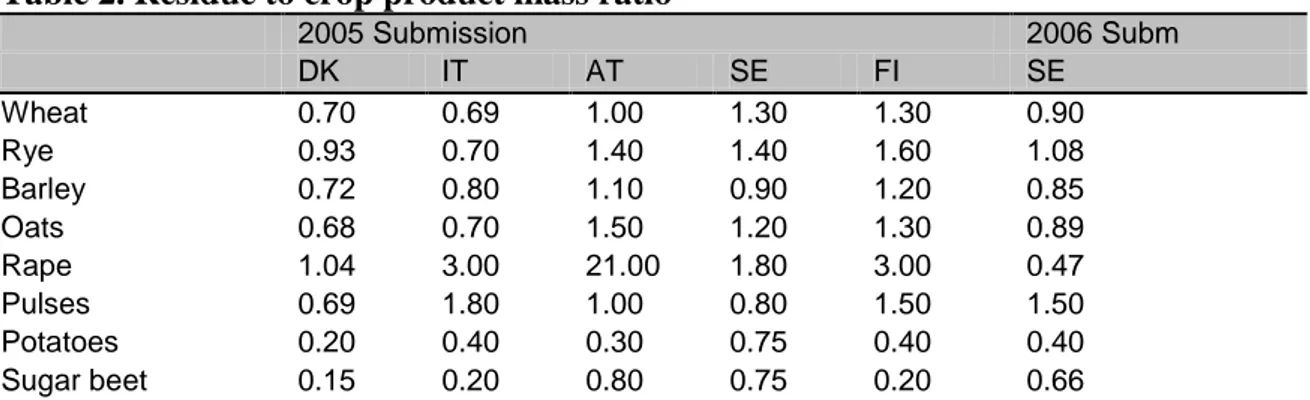
5.7 Comparisons with Finland and Denmark
Table 2 below is based on a previous summary18 but is complemented with the new national factors according to the tables in Appendix 1. The Finnish values correspond to IPCC standard values while Danish national measurements serve as the main basis for the data for Denmark. The new Swedish values for cereal crops lay closer to the Danish values that are also based upon data from national trials. The new value for rape has attained a very low level compared to the other countries, but the variation between other countries does also seem to be especially high for this type of crop. Reasons for this have yet to be investigated, as there is insufficient national documentation and a lack of standard values. Some possible explanations may be cultivation of different crop sorts in different
countries, or different definitions of crop residues. For potatoes and sugar beets, the Finnish and the Swedish values will be the same, since both countries now use the IPCC standard values.
Table 2. Residue to crop product mass ratio
2005 Submission 2006 Subm DK IT AT SE FI SE Wheat 0.70 0.69 1.00 1.30 1.30 0.90 Rye 0.93 0.70 1.40 1.40 1.60 1.08 Barley 0.72 0.80 1.10 0.90 1.20 0.85 Oats 0.68 0.70 1.50 1.20 1.30 0.89 Rape 1.04 3.00 21.00 1.80 3.00 0.47 Pulses 0.69 1.80 1.00 0.80 1.50 1.50 Potatoes 0.20 0.40 0.30 0.75 0.40 0.40 Sugar beet 0.15 0.20 0.80 0.75 0.20 0.66
Correspondingly, the share of nitrogen in crop residues is reported below. The Swedish values for cereal crops are adjusted downward somewhat and approach the Danish values.
Table 3. Nitrogen fractions in different countries, kg N /kg dry matter, percent
2005 Submission 2006 Subm DK IT AT SE FI SE Wheat 0.5 0.5 0.5 0.7 0.3 0.5 Rye 0.6 0.6 0.5 0.8 0.5 0.6 Barley 0.6 0.6 0.5 0.9 0.4 0.8 Oats 0.6 1.1 0.5 0.8 0.7 0.7 Rape 0.6 1.5 0.5 1.1 1.5 1.1 Pulses 1.2 1.5 1.5 1.9 3.5 1.4 Potatoes 2.0 - 0.5 3.3 1.1 1.1 Sugar beet 2.6 2.3 0.5 2.3 2.3 2.3 5.8 Potential improvements
Upcoming guidelines should be studied in case the definition of crop residues changes or new statistics are presented. Roots may possibly have to be included in the concept. Since stubble plays such a significant role in the statistics for utilised crop residues, the stubble height should also be included in this statistics.
A further refinement would be to distinguish between conditioned and unconditioned crop residues when subtracting the crop residues removed from the field.
10
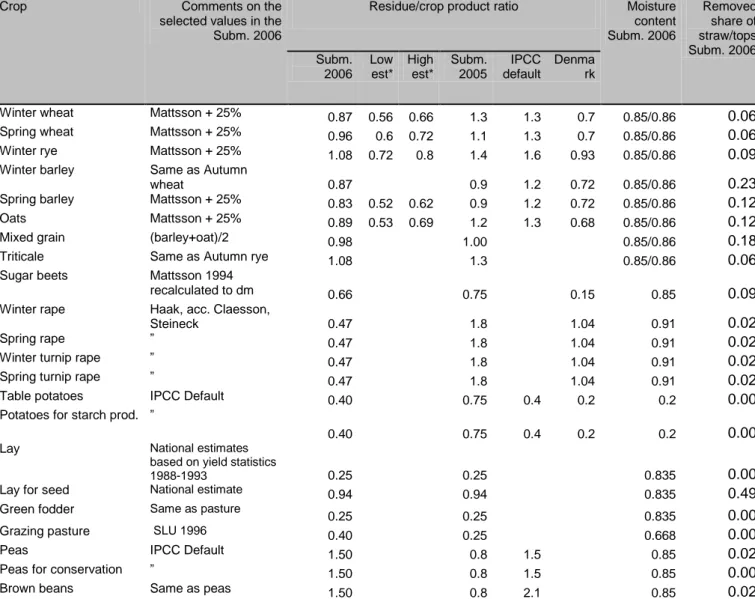
Appendix 1, Choice of factors in the GHG-inventory, Submission 2006
Crop Comments on the
selected values in the Subm. 2006
Residue/crop product ratio Moisture content Subm. 2006 Removed share of straw/tops Subm. 2006 Subm. 2006 Low est* High est* Subm. 2005 IPCC default Denma rk
Winter wheat Mattsson + 25% 0.87 0.56 0.66 1.3 1.3 0.7 0.85/0.86 0.06
Spring wheat Mattsson + 25% 0.96 0.6 0.72 1.1 1.3 0.7 0.85/0.86 0.06
Winter rye Mattsson + 25% 1.08 0.72 0.8 1.4 1.6 0.93 0.85/0.86 0.09
Winter barley Same as Autumn
wheat 0.87 0.9 1.2 0.72 0.85/0.86 0.23
Spring barley Mattsson + 25% 0.83 0.52 0.62 0.9 1.2 0.72 0.85/0.86 0.12
Oats Mattsson + 25% 0.89 0.53 0.69 1.2 1.3 0.68 0.85/0.86 0.12
Mixed grain (barley+oat)/2 0.98 1.00 0.85/0.86 0.18
Triticale Same as Autumn rye 1.08 1.3 0.85/0.86 0.06
Sugar beets Mattsson 1994
recalculated to dm 0.66 0.75 0.15 0.85 0.09
Winter rape Haak, acc. Claesson,
Steineck 0.47 1.8 1.04 0.91 0.02
Spring rape ” 0.47 1.8 1.04 0.91 0.02
Winter turnip rape ” 0.47 1.8 1.04 0.91 0.02
Spring turnip rape ” 0.47 1.8 1.04 0.91 0.02
Table potatoes IPCC Default 0.40 0.75 0.4 0.2 0.2 0.00
Potatoes for starch prod. ”
0.40 0.75 0.4 0.2 0.2 0.00
Lay National estimates
based on yield statistics
1988-1993 0.25 0.25 0.835 0.00
Lay for seed National estimate 0.94 0.94 0.835 0.49
Green fodder Same as pasture
0.25 0.25 0.835 0.00
Grazing pasture SLU 1996 0.40 0.25 0.668 0.00
Peas IPCC Default 1.50 0.8 1.5 0.85 0.02
Peas for conservation ” 1.50 0.8 1.5 0.85 0.00
Brown beans Same as peas 1.50 0.8 2.1 0.85 0.02
(*) Mattsson 2005. The values correspond to different levels of nitrogen consumption and a weighted average is used in Submission 2006.
11
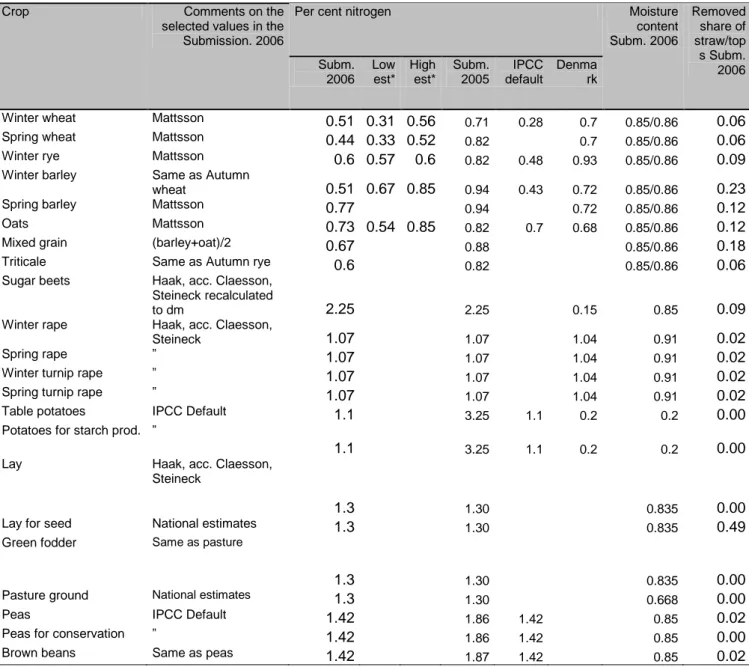
Appendix 2, Choice of factors for the nitrogen content of crop residues
Crop Comments on the
selected values in the Submission. 2006
Per cent nitrogen Moisture
content Subm. 2006 Removed share of straw/top s Subm. 2006 Subm. 2006 Low est* High est* Subm. 2005 IPCC default Denma rk
Winter wheat Mattsson 0.51 0.31 0.56 0.71 0.28 0.7 0.85/0.86 0.06
Spring wheat Mattsson 0.44 0.33 0.52 0.82 0.7 0.85/0.86 0.06
Winter rye Mattsson 0.6 0.57 0.6 0.82 0.48 0.93 0.85/0.86 0.09
Winter barley Same as Autumn
wheat 0.51 0.67 0.85 0.94 0.43 0.72 0.85/0.86 0.23
Spring barley Mattsson 0.77 0.94 0.72 0.85/0.86 0.12
Oats Mattsson 0.73 0.54 0.85 0.82 0.7 0.68 0.85/0.86 0.12
Mixed grain (barley+oat)/2 0.67 0.88 0.85/0.86 0.18
Triticale Same as Autumn rye 0.6 0.82 0.85/0.86 0.06
Sugar beets Haak, acc. Claesson, Steineck recalculated
to dm 2.25 2.25 0.15 0.85 0.09
Winter rape Haak, acc. Claesson,
Steineck 1.07 1.07 1.04 0.91 0.02
Spring rape ” 1.07 1.07 1.04 0.91 0.02
Winter turnip rape ” 1.07 1.07 1.04 0.91 0.02
Spring turnip rape ” 1.07 1.07 1.04 0.91 0.02
Table potatoes IPCC Default 1.1 3.25 1.1 0.2 0.2 0.00
Potatoes for starch prod. ”
1.1 3.25 1.1 0.2 0.2 0.00
Lay Haak, acc. Claesson,
Steineck
1.3 1.30 0.835 0.00
Lay for seed National estimates 1.3 1.30 0.835 0.49
Green fodder Same as pasture
1.3 1.30 0.835 0.00
Pasture ground National estimates 1.3 1.30 0.668 0.00
Peas IPCC Default 1.42 1.86 1.42 0.85 0.02
Peas for conservation ” 1.42 1.86 1.42 0.85 0.00
Brown beans Same as peas 1.42 1.87 1.42 0.85 0.02
(*) Mattsson 2005. The values correspond to different levels of nitrogen consumption and a weighted average is used in Submission 2006.
12
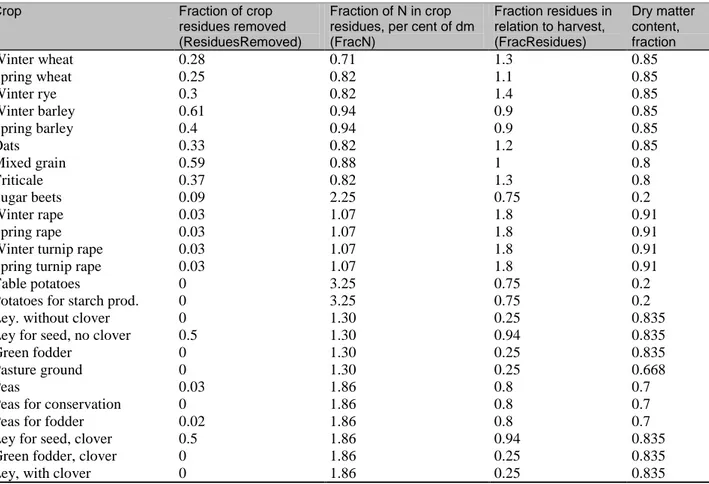
Appendix 3, Data on crop residues according to the Submission 2005
Crop Fraction of crop
residues removed (ResiduesRemoved)
Fraction of N in crop residues, per cent of dm (FracN) Fraction residues in relation to harvest, (FracResidues) Dry matter content, fraction Winter wheat 0.28 0.71 1.3 0.85 Spring wheat 0.25 0.82 1.1 0.85 Winter rye 0.3 0.82 1.4 0.85 Winter barley 0.61 0.94 0.9 0.85 Spring barley 0.4 0.94 0.9 0.85 Oats 0.33 0.82 1.2 0.85 Mixed grain 0.59 0.88 1 0.8 Triticale 0.37 0.82 1.3 0.8 Sugar beets 0.09 2.25 0.75 0.2 Winter rape 0.03 1.07 1.8 0.91 Spring rape 0.03 1.07 1.8 0.91
Winter turnip rape 0.03 1.07 1.8 0.91
Spring turnip rape 0.03 1.07 1.8 0.91
Table potatoes 0 3.25 0.75 0.2
Potatoes for starch prod. 0 3.25 0.75 0.2
Ley. without clover 0 1.30 0.25 0.835
Ley for seed, no clover 0.5 1.30 0.94 0.835
Green fodder 0 1.30 0.25 0.835
Pasture ground 0 1.30 0.25 0.668
Peas 0.03 1.86 0.8 0.7
Peas for conservation 0 1.86 0.8 0.7
Peas for fodder 0.02 1.86 0.8 0.7
Ley for seed, clover 0.5 1.86 0.94 0.835
Green fodder, clover 0 1.86 0.25 0.835
Ley, with clover 0 1.86 0.25 0.835
13
Appendix 4, Calculation of the amount of crop residues based on the level of fertilizer use
Data on use of fertilizers and manure in agriculture have been put together from Statistics Sweden, 2004, dividing the area in the following fractions:
Level of nitrogen consumption Area of grain (fraction)
No use of fertilizer 0,05
Low 0,1
Medium 0,48
High 0,37
Data on nitrogen content and relation crop residue are from Mattson L. 2005a.
Nitrogen content, % of dm Oats Winter Rye Winter wheat Spring barley Spring wheat No use of fertilizer 0,55 0,31 0,71 0,33 Low 0,54 0,57 0,44 0,67 0,48 Medium 0,7 0,6 0,56 0,73 0,52 High 0,85 0,49 0,85 0,33
Relation crop residue (dm)/crop (wet weight)
Oats Winter Rye Winter wheat Spring barley Spring wheat No use of fertilizer 0,62 0,62 0,58 0,6 Low 0,62 0,8 0,66 0,54 0,62 Medium 0,53 0,72 0,56 0,52 0,61 High 0,69 0,61 0,62 0,72
The weighted averages of the parameters are:
Nitrogen content, % of dm Oats Winter Rye Winter wheat Spring barley Spring wheat Mean values: 0,73 0,60 0,51 0,77 0,44
Relation crop residue/crop
Oats Winter Rye Winter wheat Spring barley Spring wheat Mean values: 0,60 0,73 0,59 0,56 0,65 dm/dm 0,71 0,86 0,70 0,66 0,77 +25% 0,89 1,08 0,87 0,83 0,96
14
References
Claesson & Steineck, 1991: (Växtnäring hushållning miljö (Plant nutrient management environment), the Swedish University of Agricultural Sciences (SLU), 1991)
Djurhuus J., Möller H. 2003: Notat vedr. Törstof og kvälstof ID 2057 0 1 efterladte planterester for landbrugsjord (Dry matter and green matter in the plant remains spread out on agricultural lands). Unpublished.
Faustzahlen für die Landwirtschaft, 1974: Ruhr-Stickstoff Aktiengesellschaft. 7. Auflage 1974. Haak 1998: Okänd referens (Unknown reference)
JÅ, 1994: Jordbruksstatistisk årsbok 1994 (Yearbook of Agricultural Statistics 1994) .
Leip 2004: Note on the estimation of N2O emissions from crop residues using IPCC Tier 1a or Tier 1b methods 2004. Prepared by Adrian Leip for the “Expert meeting on improving the quality of greenhouse gas emission inventories for category 4D” 21-22 October 2004.
Mattsson L 1994: Kärna/halm-kvot (Grain/straw ratio). En metodikstudie (A study of methodology). Lennart Mattsson unpublished 1994-11-16.
Mattsson L 2005a: Halmskörden, hur stor är den? (The straw harvest, how big is it? ) PM SLU 2005-09-02. Mattsson L 2005b: Personligt meddelande (Personal memorandum) från Lennart Mattsson, SLU 2005-09-22 SLU, 1996: Databok för driftplanering (Data book for operational planning), Sveriges Lantbruksuniversitet (Swedish University of Agricultural Sciences) 1996
Statistics Sweden, 1981: Skördeuppsksattning av stråsädeshalm, provundersökning 1980. PM A/FU 1981:30. Statistics Sweden, 1997: Utnyttjande av halm och blast från jordbruksgrödor 1997 (Utilization of straw and tops from agriculture crops in 1997). Mi 63 SM 9901.
Statistics Sweden, 2004: Gödselmedel ID 2057 0 1 jordbruket (Fertilisers in agriculture) 2002/03. Handels- och stallgödsel till olika grödor samt hantering och lagring av stallgödsel (Commercial fertiliser and barnyard manure for different crops and the handling and storage of barnyard manure).
Strehler A. Stützle W. 1987: Biomass residues. Ur Biomass: regenerable energy. Edited by D. O. Hall, R. P. LOverend – World energy options. Wiley 1987.